
How to Get Weather Station Data With Meteostat in Python
On this page
Problem statement
Meteostat is the quickest way to get real weather station observations into pandas: one library finds the stations near a point and returns daily, hourly or monthly data from national weather services and NOAA, in tidy metric units. Version 2 of the library changed its interface, so most examples online no longer run. And station data has the habits of station data: missing days, variables some stations never measure, and stations that start, stop or move.
This page uses Meteostat 2 to find the stations around Washington, D.C., fetch daily and hourly data for Washington National Airport for 2024, measure how complete each variable is, and compare the record with a second station.
Quick answer
Find the nearest stations to a point, then fetch daily data for one of them:
from datetime import date
import meteostat as ms
point = ms.Point(38.8472, -77.0345, 4)
near = ms.stations.nearby(point, limit=5)
print(near[["name", "distance"]].assign(distance=lambda d: (d.distance / 1000).round(1)).to_string())
D = ms.daily(near.index[0], date(2024, 1, 1), date(2024, 12, 31)).fetch()
print(f"{near.name.iloc[0]}: {len(D)} days, columns {list(D.columns)}")
name distance
id
72405 Washington National Airport 0.3
74594 Camp Springs / Andrews Air Force Base 16.3
KCGS0 College Park / Lakeland 17.7
TOFHW Fort Belvoir 19.4
KFME0 Fort Meade / Ft Meade / Portland Station (Historical) 35.6
Washington National Airport: 366 days, columns ['temp', 'tmin', 'tmax', 'rhum', 'prcp', 'snwd', 'wspd', 'wpgt', 'pres', 'tsun', 'cldc']
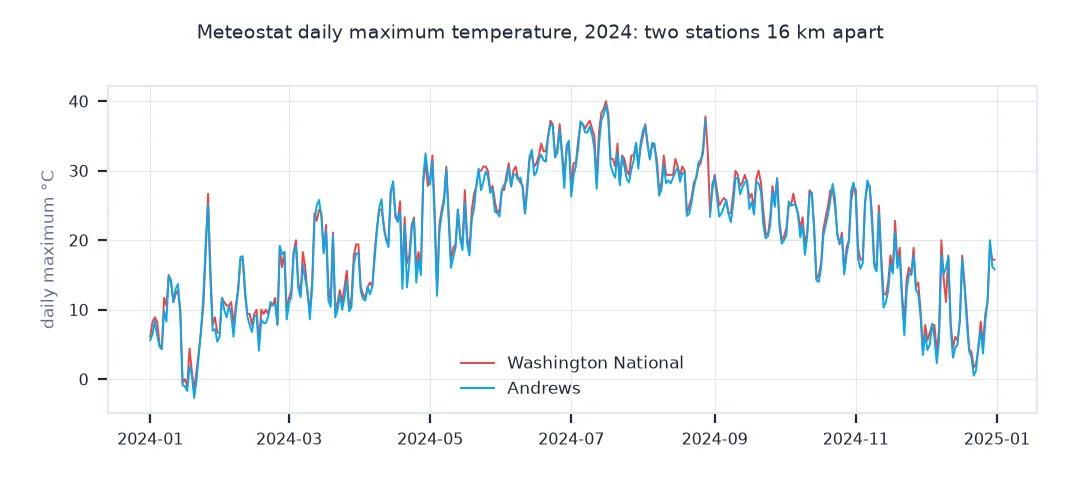
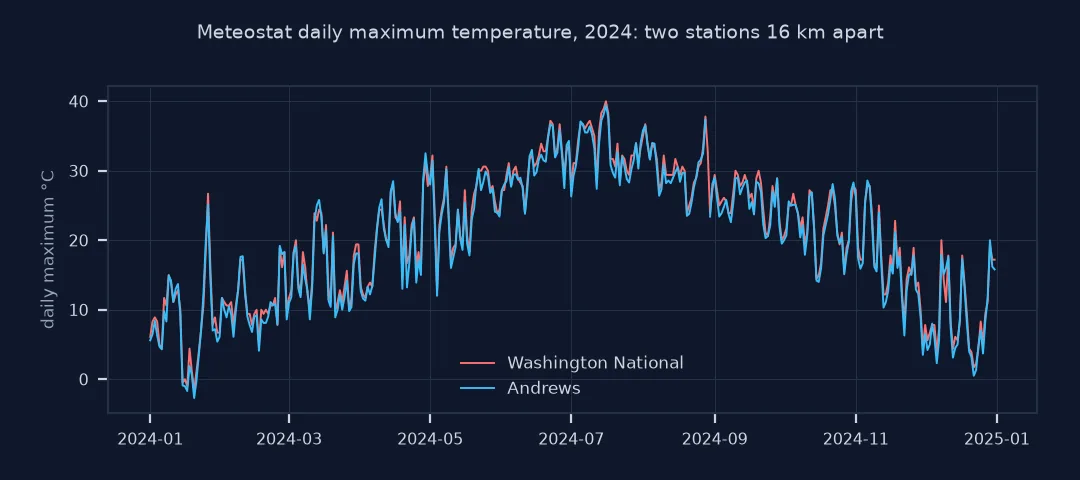
Washington National Airport is 0.3 km from the point, and Andrews 16.3 km. The 2024 daily data has 366 rows and eleven variables.
Completeness by variable, hourly data, monthly totals
1. How complete each variable is
complete = D.notna().mean().mul(100).round(0).astype(int)
print(complete.to_dict())
print(f"mean {D.temp.mean():.1f} °C; hottest {D.tmax.idxmax():%d %b} {D.tmax.max():.1f} °C; precipitation {D.prcp.sum():.0f} mm")
{'temp': 100, 'tmin': 100, 'tmax': 100, 'rhum': 100, 'prcp': 65, 'snwd': 17, 'wspd': 100, 'wpgt': 0, 'pres': 100, 'tsun': 0, 'cldc': 100}
mean 16.4 °C; hottest 16 Jul 40.0 °C; precipitation 314 mm
Temperature, humidity, wind and pressure are complete. Snow depth is on 17% of days, and gusts and sunshine never. Precipitation is the weak point: only 65% of days have a value, and the year sums to just 314 mm, far below the station's official 955 mm in GHCN. Missing rainfall days are not zeros, and for precipitation at this station GHCN is the better source.
2. Hourly data
Hourly observations come from the station's routine reports, timestamped in UTC:
Hh = ms.hourly(near.index[0], datetime(2024, 7, 15), datetime(2024, 7, 15, 23)).fetch()
print(f"{len(Hh)} hourly rows on 15 July 2024 (UTC); max {Hh.temp.max():.1f} °C at {Hh.temp.idxmax():%H:%M} UTC; columns {list(Hh.columns)[:6]}")
24 hourly rows on 15 July 2024 (UTC); max 38.3 °C at 19:00 UTC; columns ['temp', 'rhum', 'prcp', 'snwd', 'wdir', 'wspd']
The 24 hourly rows for 15 July reach 38.3 °C at 19:00 UTC, 3 pm local time. The hourly set has wind direction but no dew point.
3. Monthly totals and a second station
Compare the airport with Andrews, about 16 km to the south-east:
other = near.index[near.name.str.contains("Andrews", na=False)][0]
D2 = ms.daily(other, date(2024, 1, 1), date(2024, 12, 31)).fetch()
cmp = pd.DataFrame({"National tmax": D.tmax.resample("MS").mean(), "Andrews tmax": D2.tmax.resample("MS").mean(),
                    "National prcp": D.prcp.resample("MS").sum(), "Andrews prcp": D2.prcp.resample("MS").sum()})
cmp.index = cmp.index.strftime("%b")
print(cmp.round(1).to_string())
print(f"annual precipitation: National {D.prcp.sum():.0f} mm, Andrews {D2.prcp.sum():.0f} mm")
National tmax Andrews tmax National prcp Andrews prcp
time
Jan 8.2 7.5 149.3 81.3
Feb 11.3 10.7 0.0 3.5
Mar 15.9 15.1 0.3 2.3
Apr 20.3 19.9 3.6 5.7
May 24.8 23.9 31.3 7.7
Jun 31.3 30.8 0.0 15.6
Jul 33.6 32.7 122.5 20.9
Aug 30.4 29.9 3.0 15.7
Sep 26.2 25.3 0.0 0.1
Oct 22.4 22.0 0.0 0.0
Nov 17.3 16.3 3.9 21.4
Dec 9.3 8.7 0.0 0.3
annual precipitation: National 314 mm, Andrews 174 mm
Andrews runs about a degree cooler than the airport in monthly maximum temperature. The precipitation columns show the problem again: whole months at 0.0 mm at one or both stations, and annual totals of 314 and 174 mm, against 955 mm in the airport's official record.
The station's long record
The data used on this page
Station observations from Meteostat, which compiles data from national weather services and NOAA's ISD and GHCN under the Creative Commons Attribution 4.0 licence, fetched with the meteostat Python library version 2. Washington National Airport is Meteostat station 72405.
from datetime import datetime
from importlib.metadata import version

import pandas as pd

print(f"meteostat {version('meteostat')}")
meteostat 2.1.5
The code below uses Meteostat 2.1.5.
Example 1: the station's long record
Meteostat merges a station's history from several sources. Requests longer than 30 years are blocked unless you switch the guard off. Get annual means and totals back to 1990 and check the number of days behind each:
ms.config.block_large_requests = False                               # requests over 30 years are blocked by default
Y = ms.daily(near.index[0], date(1990, 1, 1), date(2024, 12, 31)).fetch()
A = Y.resample("YS").agg({"temp": ["mean", "count"], "prcp": "sum"})
A.index = A.index.year
A.columns = ["mean_temp", "days_with_temp", "prcp_mm"]
print(A.iloc[[0, 10, 20, 30, -1]].round(1).to_string())
print(f"years with fewer than 360 days of temperature: {(A.days_with_temp < 360).sum()}")
mean_temp days_with_temp prcp_mm
time
1990 15.4 360 681.6
2000 14.0 366 1033.9
2010 15.3 365 23.1
2020 15.7 366 1457.3
2024 16.4 366 313.9
years with fewer than 360 days of temperature: 1
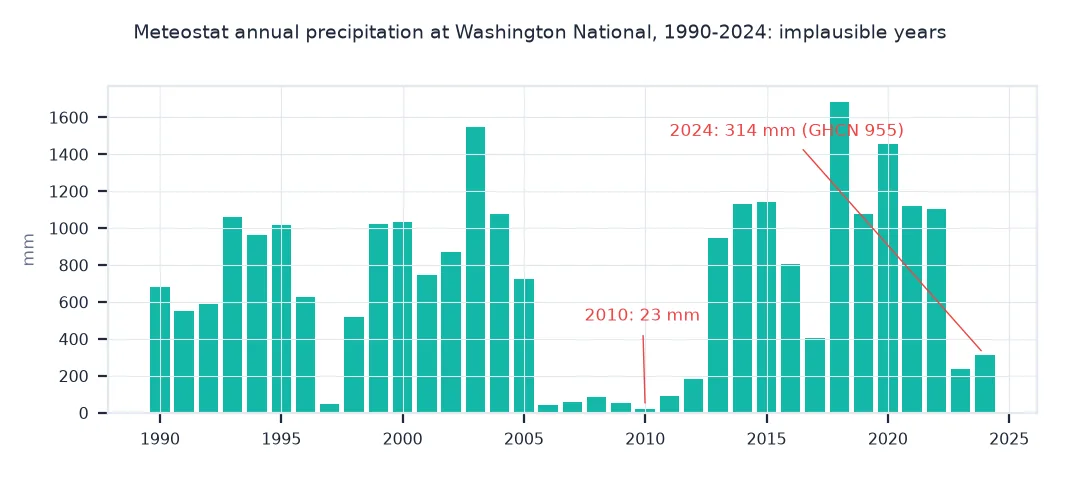
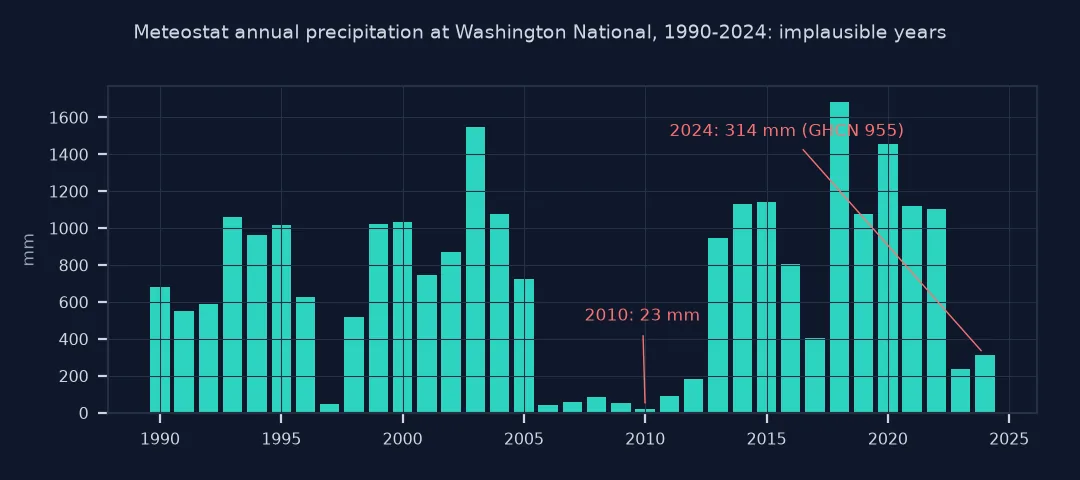
The long record has temperature for almost every day since 1990, with only one year short of 360 days. Its precipitation totals swing implausibly, from 1,457 mm in 2020 to 23 mm in 2010, so annual totals from Meteostat need checking against GHCN before use.
An open database built from public sources
Meteostat is an open database and API built from public sources: SYNOP and METAR reports, NOAA's Integrated Surface Database and GHCN-Daily, and national services such as Germany's DWD. For each station it merges these into one series per granularity: hourly from the reports, daily and monthly from official daily data where available and otherwise aggregated from hours. The Python library finds stations by distance from a Point, fetches the series for a date range and returns a pandas DataFrame in metric units: temperature in °C, precipitation in mm, wind speed in km/h, pressure in hPa.
Station data measures what happened at one place, which makes it the reference for local extremes and the input to almost every official statistic, but it comes with gaps. Some variables are not observed at a station at all, others drop out for days or months, and nearby stations can differ substantially, especially in rainfall. Always check completeness before computing totals, and compare a station with its neighbours before attributing a difference to climate.
Version 1 code, interpolation and caching
- Version 1 code:
Point,Daily(...).fetch()andStations().nearby()from Meteostat 1.x no longer work; usems.stations.nearbyandms.daily(...).fetch(). - Interpolation: passing a
Pointinstead of a station ID interpolates nearby stations to that point, with a lapse-rate correction for elevation. - Units: wind is km/h, not m/s; convert before comparing with model data.
- Caching: the library caches downloaded data locally; clear it with
ms.purge()if a station's history is updated.
Internal links
- How to get historical weather data in Python — gridded data for any point
- How to get NOAA GHCN daily weather station data in Python — the US source behind many stations
- Fixing gaps and missing values in weather station data — cleaning the record
FAQ
How do I get weather station data in Python?
Install meteostat, find stations with ms.stations.nearby(ms.Point(lat, lon)), and fetch with ms.daily(station_id, start, end).fetch().
Why does my Meteostat code not work any more?
Meteostat 2 replaced the classes of version 1; Daily, Hourly and Stations() became functions such as ms.daily and ms.stations.nearby.
What units does Meteostat use?
Metric: °C, mm, km/h for wind and hPa for pressure.
Is Meteostat free?
Yes; the data is under CC BY 4.0, so credit Meteostat and its sources.