
How to Get Historical Weather Data in Python
On this page
Problem statement
Daily temperature, rainfall and wind for any place on Earth, going back decades, used to mean finding a weather station, requesting its records and cleaning them. Today a single HTTP request to the Open-Meteo archive API returns a gap-free series for any coordinates, built from the ERA5 reanalysis and related models, with no key and no account. What needs care is the detail: which variables and model are used, which time zone the days are counted in, how the series compares with a real station, and how to stay within the free tier's limits.
This page gets the daily weather of 2024 for Washington, D.C. from the Open-Meteo archive, summarises it by month, compares two of the underlying models, and pulls a record back to 1940 to measure the long-term warming trend.
Quick answer
Request daily variables for a latitude and longitude, in local time, and load the result into pandas:
D = archive(start="2024-01-01", end="2024-12-31",
            daily="temperature_2m_max,temperature_2m_min,temperature_2m_mean,precipitation_sum,wind_speed_10m_max")
print(f"{len(D)} days; hottest {D.temperature_2m_max.idxmax():%d %b} at {D.temperature_2m_max.max():.1f} °C; coldest night {D.temperature_2m_min.idxmin():%d %b} at {D.temperature_2m_min.min():.1f} °C")
print(f"total precipitation {D.precipitation_sum.sum():.0f} mm on {(D.precipitation_sum >= 1).sum()} days with at least 1 mm; mean temperature {D.temperature_2m_mean.mean():.1f} °C")
366 days; hottest 22 Jun at 37.0 °C; coldest night 17 Jan at -11.3 °C
total precipitation 1239 mm on 124 days with at least 1 mm; mean temperature 14.5 °C
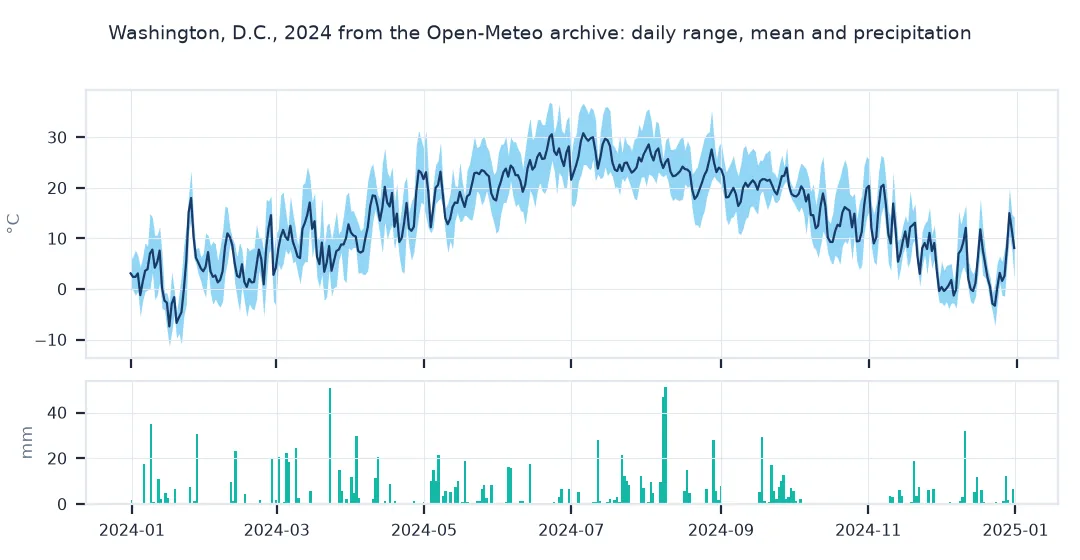
2024 has 366 days. The hottest was 22 June at 37.0 °C, and the coldest night 17 January at −11.3 °C. The series has 1,239 mm of precipitation, with 124 days of at least 1 mm, and a mean temperature of 14.5 °C.
A monthly summary, a chosen model, hourly data
1. Monthly summary
M = D.resample("MS").agg({"temperature_2m_max": "mean", "temperature_2m_min": "mean", "precipitation_sum": "sum"})
M.index = M.index.strftime("%b")
print(M.round(1).to_string())
temperature_2m_max temperature_2m_min precipitation_sum
time
Jan 7.4 -1.5 123.2
Feb 10.3 0.0 61.4
Mar 14.9 3.9 171.4
Apr 20.0 8.8 96.3
May 24.1 14.4 138.5
Jun 31.0 18.8 71.6
Jul 31.6 21.3 117.2
Aug 29.2 19.2 191.4
Sep 25.3 16.4 113.5
Oct 20.6 9.6 9.9
Nov 15.1 6.7 60.2
Dec 8.0 0.2 84.1
July was the warmest month, with a mean maximum of 31.6 °C, and January the coldest. Precipitation swings from 191.4 mm in August to 9.9 mm in October.
2. Choose the model
models= selects the source: era5 at 0.25° (about 25 km) and era5_land at 0.1° over land, among others. Compare the year's mean temperature and total precipitation:
rows = {}
for model in ("era5", "era5_land"):
    d = archive(start="2024-01-01", end="2024-12-31", daily="temperature_2m_mean,precipitation_sum", models=model)
    rows[model] = {"mean °C": d.temperature_2m_mean.mean(), "precip mm": d.precipitation_sum.sum(min_count=1), "days with precip value": d.precipitation_sum.notna().sum()}
print(pd.DataFrame(rows).T.round(1).to_string())
mean °C precip mm days with precip value
era5 15.5 1044.3 366.0
era5_land 15.1 NaN 0.0
Asked for era5 alone, the year averages 15.5 °C with 1,044 mm of precipitation, less than the default series' 1,239 mm. era5_land gives 15.1 °C and no precipitation at all: the variable is not available from that model here, and a careless sum() would have reported 0 mm. The default "best match" combines sources, so the model behind a series should always be stated.
3. Hourly data
Hourly variables come in the same way; the timezone parameter shifts the timestamps to local time:
Hh = archive(start="2024-07-15", end="2024-07-15", hourly="temperature_2m,relative_humidity_2m,precipitation")
print(f"{len(Hh)} hours on 15 July 2024; warmest {Hh.temperature_2m.idxmax():%H:%M} local at {Hh.temperature_2m.max():.1f} °C, humidity then {Hh.loc[Hh.temperature_2m.idxmax(), 'relative_humidity_2m']:.0f}%")
24 hours on 15 July 2024; warmest 16:00 local at 36.0 °C, humidity then 38%
On 15 July 2024 the warmest hour was 16:00 local time at 36.0 °C, with humidity at 38%.
Back to 1940
The data used on this page
The Open-Meteo historical weather API, free for non-commercial use without a key, which serves ERA5, ERA5-Land and other reanalysis data (Copernicus Climate Change Service), for the location of Washington Reagan National Airport. Responses are cached on disk, and requests retry when the rate limit answers 429.
import hashlib
import json
import time
from pathlib import Path

import numpy as np
import pandas as pd
import requests

Path("data").mkdir(exist_ok=True)
LAT, LON, TZ = 38.8472, -77.0345, "America/New_York"

def archive(start, end, daily=None, hourly=None, models=None, lat=LAT, lon=LON):
    params = {"latitude": lat, "longitude": lon, "start_date": start, "end_date": end, "timezone": TZ}
    if daily: params["daily"] = daily
    if hourly: params["hourly"] = hourly
    if models: params["models"] = models
    f = Path("data/om_" + hashlib.md5(json.dumps(params, sort_keys=True).encode()).hexdigest() + ".json")
    if not f.exists():
        for attempt in range(6):
            r = requests.get("https://archive-api.open-meteo.com/v1/archive", params=params, timeout=300)
            if r.status_code == 429:
                time.sleep(30 * (attempt + 1)); continue
            r.raise_for_status(); f.write_text(r.text); break
    js = json.loads(f.read_text())
    block = js["daily" if daily else "hourly"]
    df = pd.DataFrame(block).assign(time=lambda d: pd.to_datetime(d.time)).set_index("time")
    df.attrs.update(lat=js["latitude"], lon=js["longitude"], elevation=js["elevation"])
    return df

probe = archive(start="2024-01-01", end="2024-01-01", daily="temperature_2m_max")
print(f"grid cell used: {probe.attrs['lat']:.3f}, {probe.attrs['lon']:.3f}, elevation {probe.attrs['elevation']:.0f} m (requested {LAT}, {LON})")
grid cell used: 38.840, -77.090, elevation 3 m (requested 38.8472, -77.0345)
The API answers with the grid cell it used, centred 38.840° N, 77.090° W at 3 m elevation, about 5 km from the airport.
Example 1: back to 1940
ERA5 starts in 1940. Get the annual mean temperature since then and fit a linear trend:
L = archive(start="1940-01-01", end="2024-12-31", daily="temperature_2m_mean", models="era5")
annual = L.temperature_2m_mean.resample("YS").mean()
annual.index = annual.index.year
slope = np.polyfit(annual.index, annual.values, 1)[0]
print(f"{len(L):,} days; annual mean {annual.min():.1f} °C ({annual.idxmin()}) to {annual.max():.1f} °C ({annual.idxmax()}); trend {slope * 10:+.2f} °C per decade")
print(f"1940s mean {annual.loc[1940:1949].mean():.2f} °C; 2015-2024 mean {annual.loc[2015:2024].mean():.2f} °C")
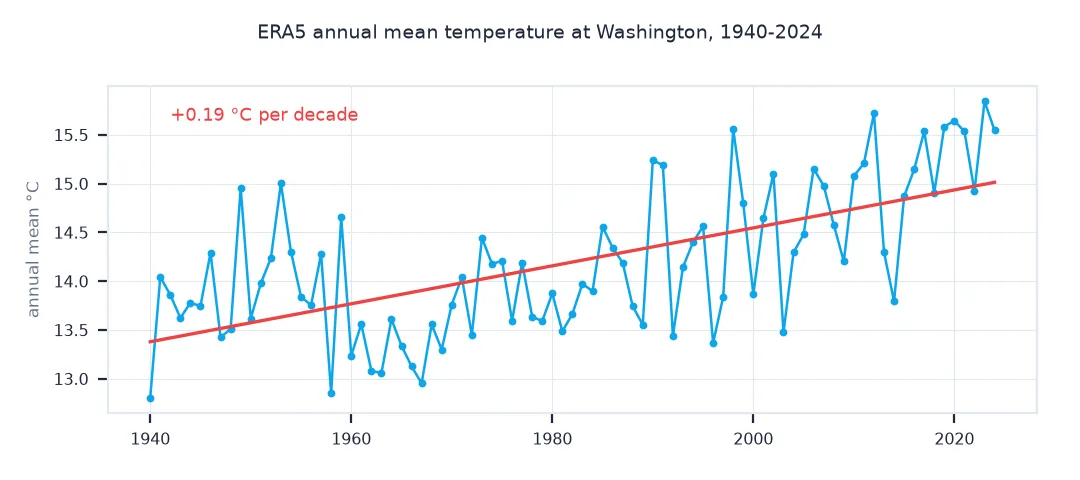
31,047 days; annual mean 12.8 °C (1940) to 15.8 °C (2023); trend +0.19 °C per decade
1940s mean 13.80 °C; 2015-2024 mean 15.35 °C
Since 1940 the annual mean has ranged from 12.8 °C, in 1940 itself, to 15.8 °C in 2023. The linear trend is +0.19 °C per decade, and 2015-2024 averaged 15.35 °C against 13.80 °C in the 1940s.
Gridded reanalysis, not station records
The Open-Meteo archive does not store station records. It serves gridded reanalysis: ERA5 from the European Centre for Medium-Range Weather Forecasts, which combines a weather model with observations from stations, balloons, aircraft and satellites into a consistent hourly record at 0.25° since 1940, plus higher-resolution products such as ERA5-Land. A request for a point returns the nearest grid cell, so the coordinates and elevation in the response are those of the cell, not of the requested place. The values are a cell average, smoother than any single station: extremes are damped, and local effects such as a city's heat island or a coastline are blurred.
That makes the archive excellent for consistent, gap-free series anywhere, for long-term trends and for places without stations, and weaker for exact local extremes or rainfall at a point. Two details decide whether the numbers are right. timezone sets how hours are grouped into days: without it, days run midnight to midnight UTC. The model choice changes the values, particularly precipitation. For a specific site, compare the archive with a nearby station before relying on it.
Rate limits, recent days and units
- Rate limits: the free API limits calls per minute, hour and day, and counts multi-location requests per location; cache responses and retry on 429. See the 429 fix.
- Recent days: the archive lags real time by a few days; the forecast API's
past_dayscovers the gap. - Commercial use: the free tier is for non-commercial use; commercial users need an API key.
- Units:
temperature_unit=fahrenheitandprecipitation_unit=inchchange the units at the source.
Internal links
- How to get weather station data with Meteostat in Python — real stations instead of a grid
- How to get ERA5 reanalysis data in Python — the underlying dataset, gridded
- Reanalysis vs station data explained — which to trust for what
FAQ
How do I get historical weather data in Python for free?
Call the Open-Meteo archive API with a latitude, longitude, date range and the variables you need; it returns JSON that pandas reads directly, without a key.
How far back does historical weather data go?
ERA5-based data from Open-Meteo starts in 1940; station records vary, some back to the 19th century.
Is Open-Meteo historical data from weather stations?
No; it is reanalysis, a model constrained by observations on a grid, so values are cell averages rather than station readings.
Why are my daily values different from a weather station's?
The grid cell averages a larger area, and days may be counted in UTC unless you set timezone.