
How to Get Weather Forecast Data in Python and Check Its Accuracy
On this page
Problem statement
Getting a weather forecast into Python is a single request: the Open-Meteo forecast API returns hourly temperature, rain, wind and dozens of other variables for the next 16 days at any coordinates, with no key. The harder question is how much to trust it. A forecast for tomorrow and one for next week are not equally good, and the only way to know how good is to compare past forecasts with what actually happened. Open-Meteo keeps an archive of previous forecast runs that makes this possible.
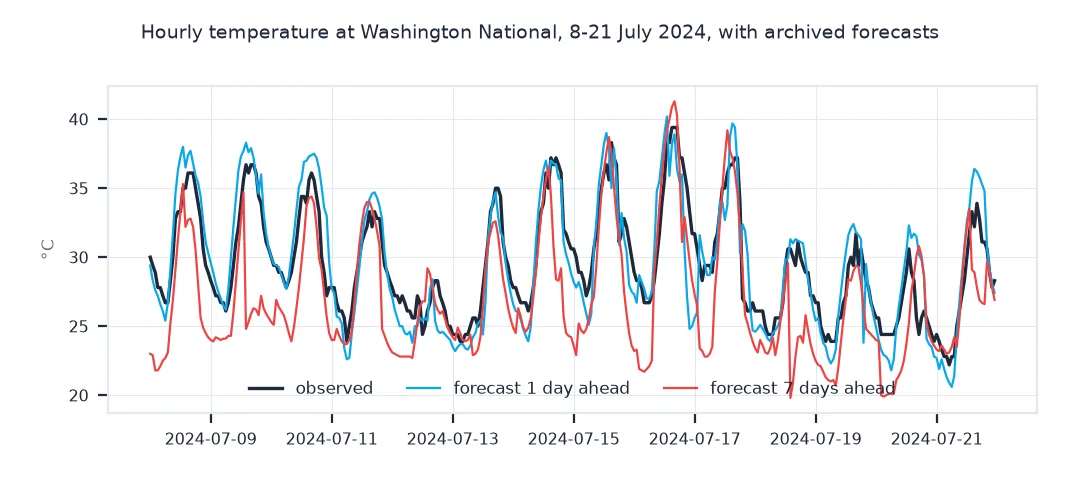
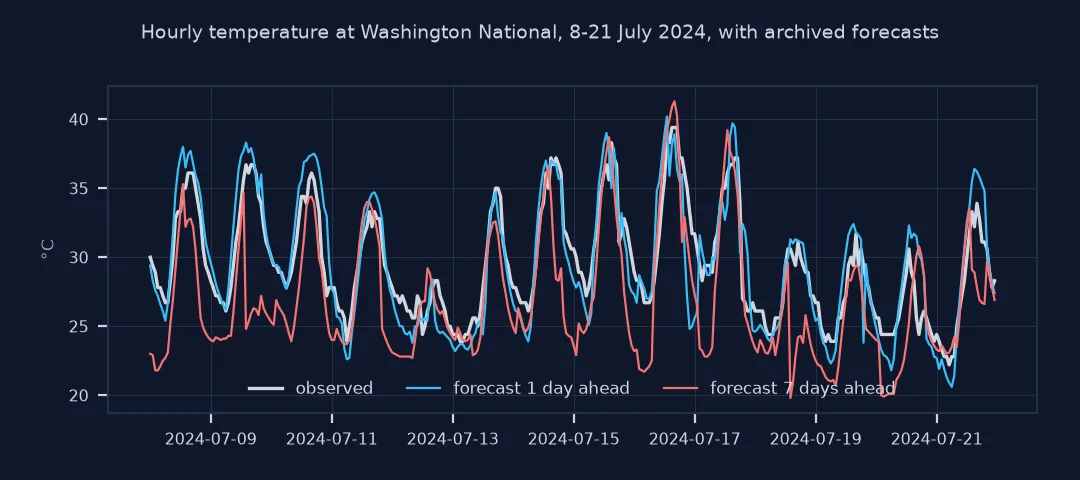
This page requests the current forecast for Washington, D.C. and looks at what the response contains. It then uses the previous-runs archive to fetch the temperature forecasts issued one, three, five and seven days ahead for every hour of 2024, and scores each lead time against the observations at Reagan National Airport.
Quick answer
Request hourly and daily forecast variables in local time:
r = requests.get("https://api.open-meteo.com/v1/forecast", params={
    "latitude": LAT, "longitude": LON, "timezone": TZ, "forecast_days": 7,
    "hourly": "temperature_2m,precipitation_probability,precipitation,wind_speed_10m",
    "daily": "temperature_2m_max,temperature_2m_min,precipitation_sum"}, timeout=60)
r.raise_for_status(); js = r.json()
F = pd.DataFrame(js["hourly"]).assign(time=lambda d: pd.to_datetime(d.time)).set_index("time")
print(f"{len(F)} hourly steps and {len(js['daily']['time'])} days; variables {list(F.columns)}; units {js['hourly_units']['temperature_2m']}, {js['hourly_units']['wind_speed_10m']}")
168 hourly steps and 7 days; variables ['temperature_2m', 'precipitation_probability', 'precipitation', 'wind_speed_10m']; units °C, km/h
The forecast has 168 hourly steps and 7 daily values, with temperature in °C and wind in km/h. The values themselves change with every model run, which is why they are not shown.
Past forecasts, scores by lead time, where it went wrong
1. Previous forecasts for a past period
The previous-runs API returns, for each hour, the value forecast one to seven days earlier, beside the latest:
P = previous_runs("2024-01-01", "2024-12-31")
print(f"{len(P):,} hours; columns {list(P.columns)}")
print(P.loc["2024-07-15 15:00"].round(1).to_dict())
8,784 hours; columns ['temperature_2m', 'temperature_2m_previous_day1', 'temperature_2m_previous_day3', 'temperature_2m_previous_day5', 'temperature_2m_previous_day7']
{'temperature_2m': 37.3, 'temperature_2m_previous_day1': 35.0, 'temperature_2m_previous_day3': 38.2, 'temperature_2m_previous_day5': 38.6, 'temperature_2m_previous_day7': 37.5}
The archive returns all 8,784 hours of 2024, each with the latest value and the forecasts issued one, three, five and seven days earlier. At 15:00 on 15 July, the latest value was 37.3 °C, and the forecasts from 1 to 7 days earlier said 35.0, 38.2, 38.6 and 37.5 °C.
2. Score each lead time against the station
Join the forecasts to the station's hourly observations and compute the mean absolute error and the bias:
obs = ms.hourly("72405", datetime(2024, 1, 1, 5), datetime(2025, 1, 1, 4)).fetch().temp
obs.index = obs.index.tz_localize("UTC").tz_convert(TZ).tz_localize(None)
J = P.join(obs.rename("observed"), how="inner").dropna()
score = pd.DataFrame({lead: {"MAE °C": (J[col] - J.observed).abs().mean(), "bias °C": (J[col] - J.observed).mean()}
                      for lead, col in LEADS.items()}).T
print(f"hours compared: {len(J):,}")
print(score.round(2).to_string())
hours compared: 8,200
MAE °C bias °C
1 day 1.84 -1.02
3 days 1.80 -0.69
5 days 2.28 -0.75
7 days 2.81 -0.90
Over 8,200 hours with an observation, the one-day forecast was off by 1.84 °C on average and the seven-day forecast by 2.81 °C. Oddly, the three-day forecast (1.80 °C) did slightly better than the one-day one. Every lead time runs 0.7 to 1.0 °C colder than the airport. A bias that does not grow with lead time points to the difference between a model grid cell and this one station, not to forecast error.
3. Where the forecast misses most
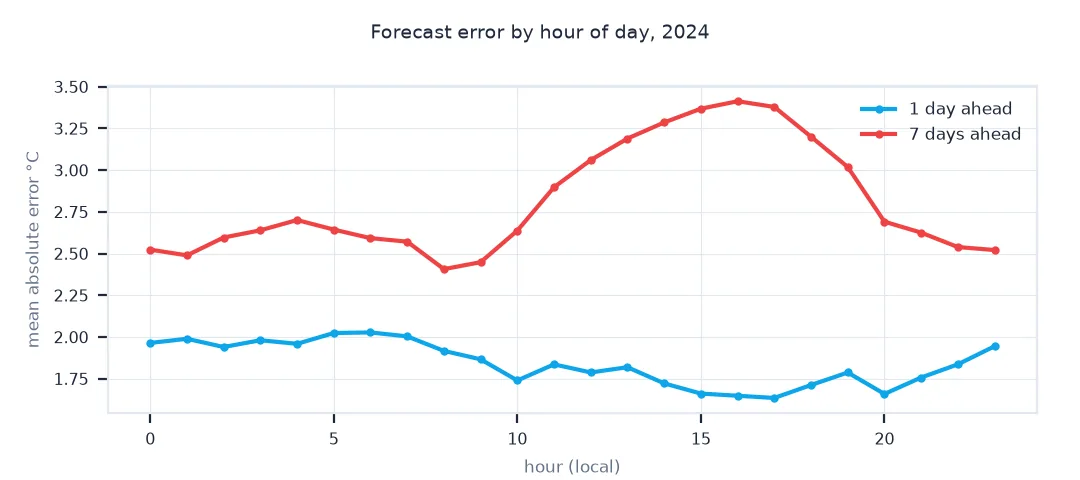
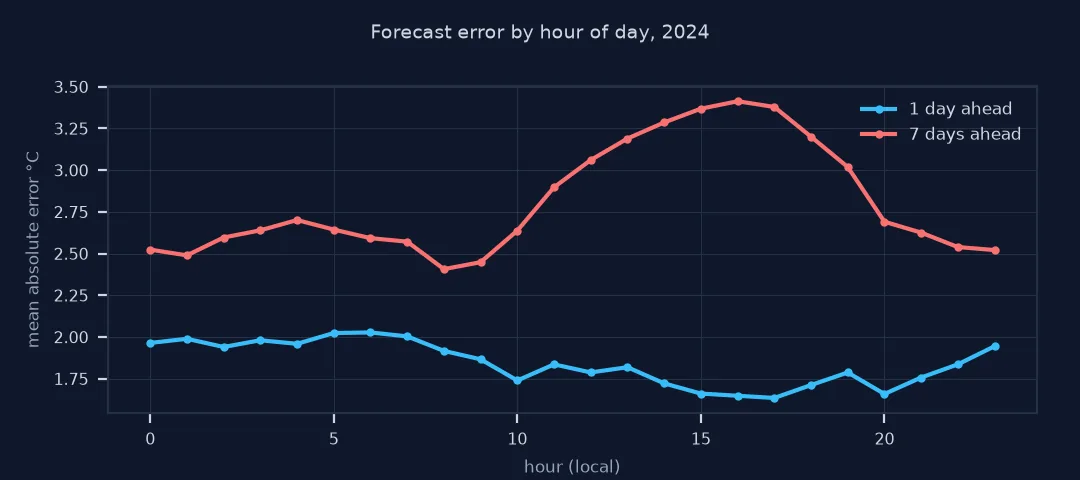
Look at the error of the one-day forecast by month and by hour of day:
e = (J["temperature_2m_previous_day1"] - J.observed)
print("MAE by month:", e.abs().groupby(J.index.month).mean().round(2).to_dict())
by_hour = e.abs().groupby(J.index.hour).mean()
print(f"MAE by hour: lowest {by_hour.min():.2f} °C at {by_hour.idxmin()}:00, highest {by_hour.max():.2f} °C at {by_hour.idxmax()}:00")
MAE by month: {1: 1.93, 2: 1.94, 3: 2.02, 4: 1.89, 5: 1.55, 6: 1.61, 7: 1.63, 8: 1.58, 9: 1.47, 10: 2.02, 11: 2.49, 12: 2.06}
MAE by hour: lowest 1.63 °C at 17:00, highest 2.03 °C at 6:00
The one-day forecast was best in September (1.47 °C) and worst in November (2.49 °C). By hour, it was best at 17:00 (1.63 °C) and worst at 06:00 (2.03 °C), around dawn.
How errors grow with lead time
The data used on this page
The Open-Meteo forecast API and previous runs API, which archives the forecasts of national weather models from 2024 on, free for non-commercial use; and hourly observations from Meteostat station 72405, Washington National Airport (CC BY 4.0).
import hashlib
import json
import time
from datetime import datetime
from pathlib import Path

import meteostat as ms
import pandas as pd
import requests

Path("data").mkdir(exist_ok=True)
LAT, LON, TZ = 38.8472, -77.0345, "America/New_York"
LEADS = {"1 day": "temperature_2m_previous_day1", "3 days": "temperature_2m_previous_day3",
         "5 days": "temperature_2m_previous_day5", "7 days": "temperature_2m_previous_day7"}

def previous_runs(start, end):
    params = {"latitude": LAT, "longitude": LON, "timezone": TZ, "start_date": start, "end_date": end,
              "hourly": ",".join(["temperature_2m"] + list(LEADS.values()))}
    f = Path("data/prev_" + hashlib.md5(json.dumps(params, sort_keys=True).encode()).hexdigest() + ".json")
    if not f.exists():
        for attempt in range(6):
            r = requests.get("https://previous-runs-api.open-meteo.com/v1/forecast", params=params, timeout=600)
            if r.status_code == 429:
                time.sleep(60 * (attempt + 1)); continue
            r.raise_for_status(); f.write_text(r.text); break
    return pd.DataFrame(json.loads(f.read_text())["hourly"]).assign(time=lambda d: pd.to_datetime(d.time)).set_index("time")
print("ready")
ready
The previous-runs helper is ready.
Example 1: how errors grow with lead time
The day-ahead forecast is the baseline. Express the error at each lead as a multiple of it:
base = score.loc["1 day", "MAE °C"]
print({lead: f"{v / base:.2f}x" for lead, v in score["MAE °C"].items()})
big = (J["temperature_2m_previous_day7"] - J.observed).abs()
print(f"hours where the 7-day forecast was off by more than 5 °C: {(big > 5).mean():.1%}; for the 1-day forecast: {((J['temperature_2m_previous_day1'] - J.observed).abs() > 5).mean():.1%}")
{'1 day': '1.00x', '3 days': '0.98x', '5 days': '1.24x', '7 days': '1.53x'}
hours where the 7-day forecast was off by more than 5 °C: 16.0%; for the 1-day forecast: 2.4%
Relative to the day-ahead forecast, the error grows to 1.24 times at five days and 1.53 times at seven. Large misses grow faster: the seven-day forecast was more than 5 °C off in 16.0% of hours, the one-day forecast in 2.4%.
Forecast APIs serve weather models
A weather forecast API serves the output of numerical weather prediction models: the American GFS, ECMWF's IFS, Germany's ICON, Canada's GEM and others, run several times a day from the latest observations. Open-Meteo combines them into a "best match" for each location and returns the result as JSON. The forecast changes every time the models run, so the values above will differ tomorrow, which is why code that uses forecasts should store each response with the time it was fetched.
Forecast skill falls with lead time because small errors in the starting state grow as the model runs forward, and weather is chaotic. Scoring that decline needs the forecasts as they were issued, not as they are now, which is what an archive of previous runs provides. Temperature is the easiest variable to forecast and to score. Precipitation and wind need other measures, because a forecast of 2 mm on a day with 0 mm is a different kind of error from being 2 °C too warm. Errors also vary with season and time of day, and the observing station's siting matters as much as the model.
Reproducibility, models and ensembles
- Reproducibility: live forecast values change with every model run; save the response if results must be repeatable.
- Models:
models=gfs_seamless,ecmwf_ifs025oricon_seamlesspin the forecast to one model. - Ensembles: the ensemble API returns all members, for probability forecasts rather than single values.
- Station time stamps: observations are in UTC; align them with the forecast's time zone before joining.
Internal links
- How to get historical weather data in Python — what happened, not what was forecast
- How to get weather station data with Meteostat in Python — the observations used for scoring
- Fixing weather data in the wrong time zone — aligning forecasts and observations
FAQ
How do I get a weather forecast in Python?
Call the Open-Meteo forecast API with latitude, longitude, the variables and forecast_days; it returns JSON that pandas reads directly.
How accurate are weather forecasts?
For hourly temperature at Washington National in 2024, the one- and three-day forecasts were off by about 1.8 °C on average, the seven-day forecast by 2.8 °C; measure it for your location with archived forecasts.
How do I get past weather forecasts?
Open-Meteo's previous-runs API returns the values forecast one to seven days before each hour, from 2024 on.
Is the Open-Meteo forecast API free?
Yes for non-commercial use without a key; commercial use needs a subscription.