
How to Plot Wind Barbs in Python
On this page
Problem statement
Wind barbs are the meteorologist's wind symbol: a staff pointing into the wind, with feathers on the end it comes from. Each half feather is 5 knots, a full feather 10 and a pennant 50, so a barb can be read as a number, which an arrow cannot. Matplotlib draws them with barbs, but it counts in whatever units it is given. Pass metres per second and every barb shows a speed about half the real one, while still looking like a correct weather map.
This page plots barbs for the GFS 10-metre wind around Hurricane Helene at 00 UTC on 27 September 2024, in knots, and shows how much the barbs round off.
Quick answer
Convert to knots before plotting, and thin the grid:
KT = 1.94384                                                   # knots per m/s
u_kt, v_kt = W.u10.values * KT, W.v10.values * KT
step = 6
fig, ax = plt.subplots(figsize=(8, 6.5))
ax.set_aspect(1 / np.cos(np.radians(27)))
ax.barbs(LON[::step], LAT[::step], u_kt[::step, ::step], v_kt[::step, ::step], length=5.5, linewidth=0.6)
fig.savefig("helene_barbs.png", dpi=150)
speed_kt = np.hypot(u_kt, v_kt)[::step, ::step]
print(f"{speed_kt.size} barbs; strongest {speed_kt.max():.0f} kt; with a pennant (50 kt or more): {(speed_kt >= 47.5).sum()}")
195 barbs; strongest 56 kt; with a pennant (50 kt or more): 1
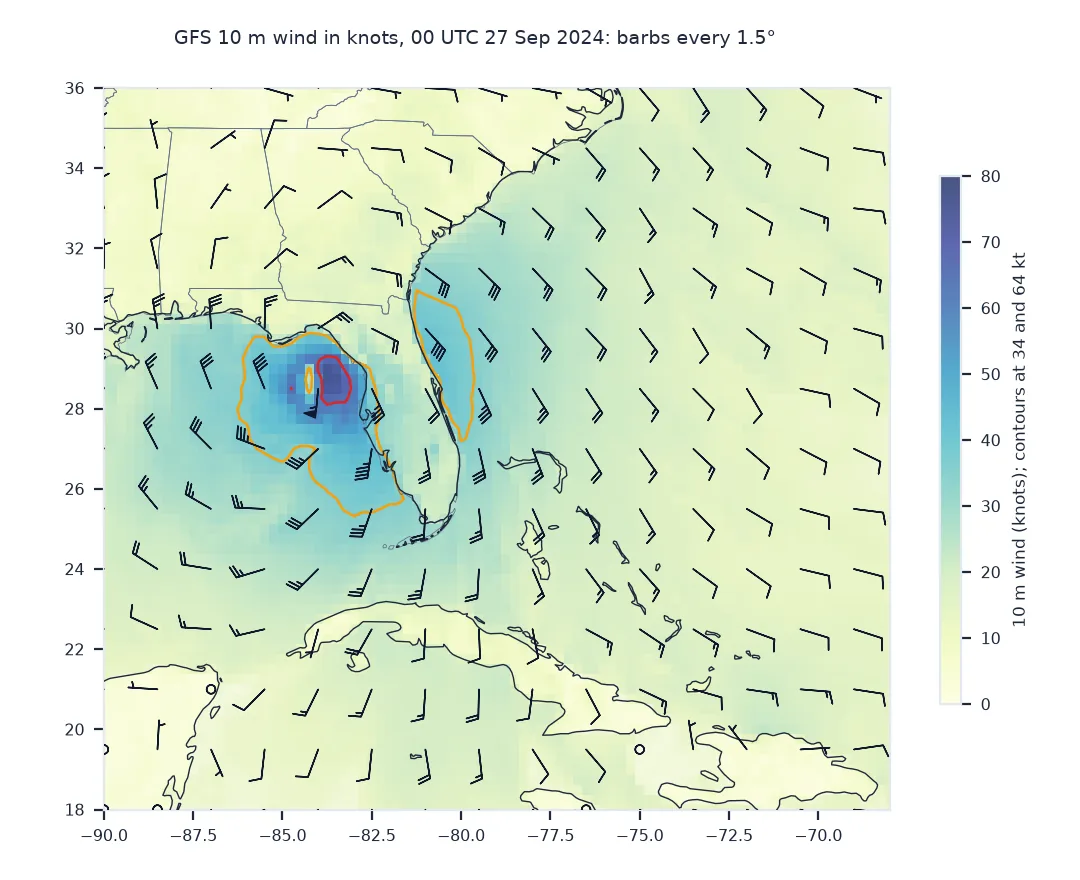
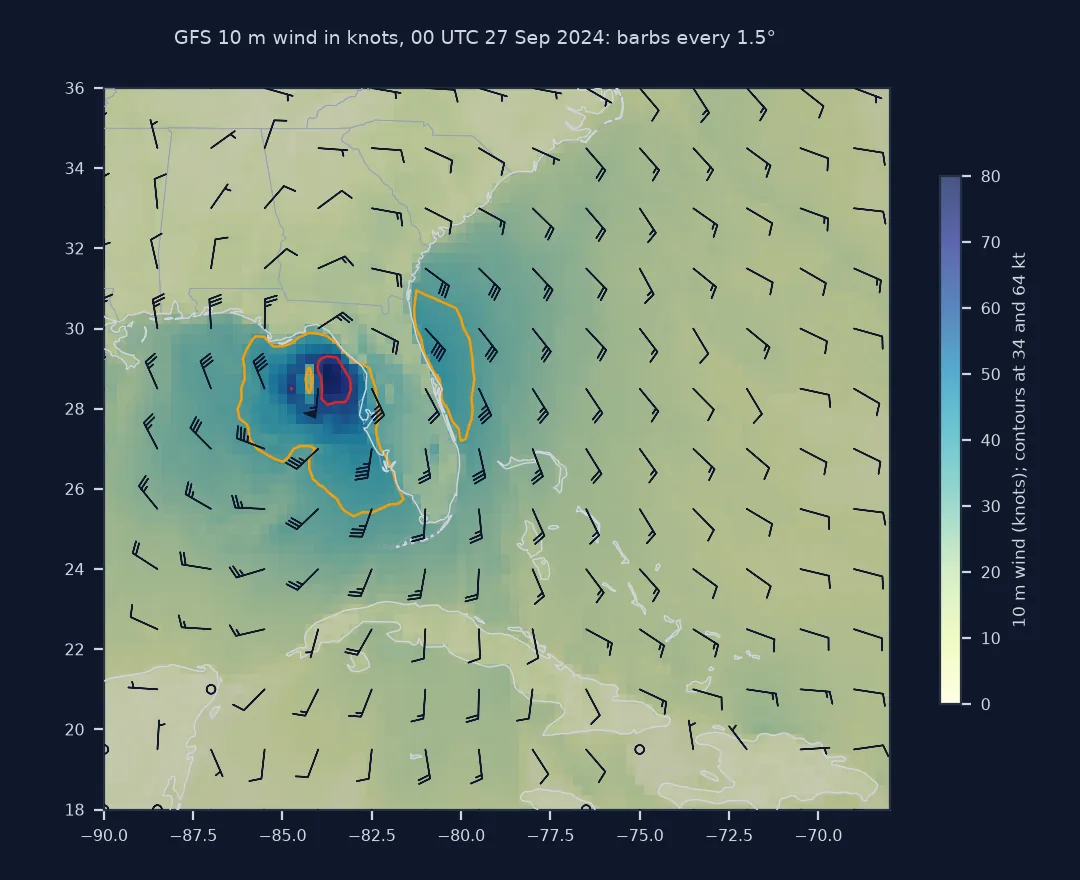
Plot in knots, know the rounding, read the thresholds
1. Plot in knots
Barbs have no unit of their own; a full feather is 10 of whatever you pass. The same wind in metres per second loses half its feathers:
s = np.hypot(W.u10.values, W.v10.values)[::step, ::step]
for label, x in (("m/s passed as is", s), ("knots", s * KT)):
    print(f"{label:>18}: strongest barb {np.round(x.max() / 5) * 5:.0f} units, pennants: {(x >= 47.5).sum()}")
m/s passed as is: strongest barb 30 units, pennants: 0
knots: strongest barb 55 units, pennants: 1
2. Know what the barb rounds to
Matplotlib rounds each speed to the nearest half feather, 5 knots, before drawing. A barb is therefore a band, not a value:
drawn = np.round(speed_kt / 5) * 5
err = drawn - speed_kt
print(f"largest rounding: {np.abs(err).max():.1f} kt; median {np.median(np.abs(err)):.1f} kt")
print(f"winds under 2.5 kt are drawn as a calm circle: {(speed_kt < 2.5).sum()} of {speed_kt.size}")
largest rounding: 2.5 kt; median 1.3 kt
winds under 2.5 kt are drawn as a calm circle: 6 of 195
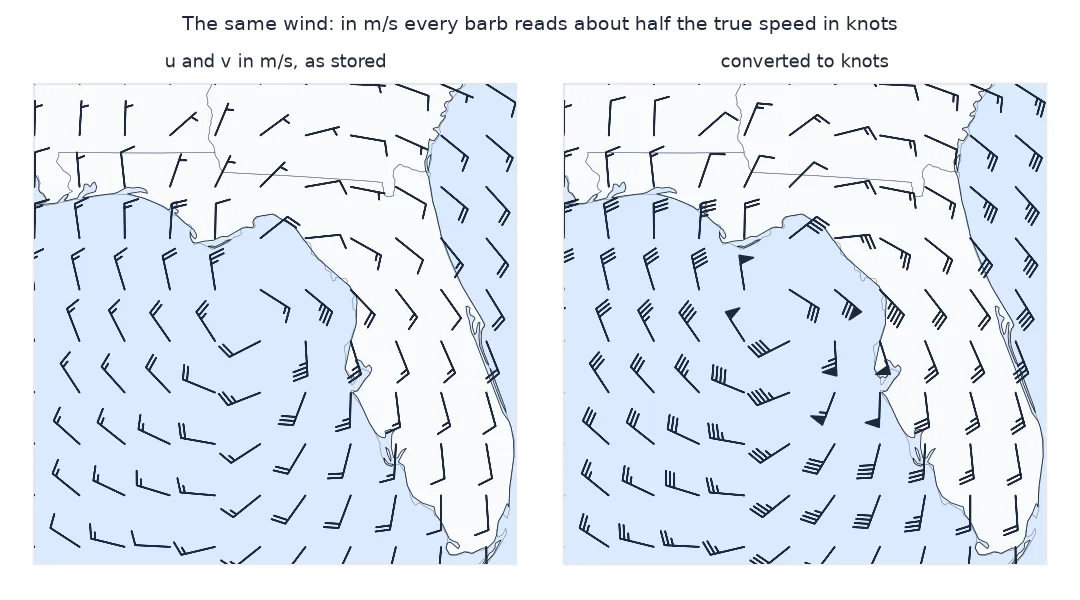
3. Read the thresholds that matter
Tropical storm force begins at 34 knots and hurricane force at 64. Barbs round 34 kt to 35, so count the categories from the data, not from the picture:
full = np.hypot(u_kt, v_kt)
for name, lo in (("tropical storm force (34 kt+)", 34), ("50 kt+", 50), ("hurricane force (64 kt+)", 64)):
    print(f"{name:>30}: {(full >= lo).sum():>4} grid points of {full.size:,}")
tropical storm force (34 kt+): 262 grid points of 6,497
50 kt+: 57 grid points of 6,497
hurricane force (64 kt+): 15 grid points of 6,497
Southern Hemisphere barbs and station reports
The data used on this page
The GFS 0.25° analysis for 00 UTC on 27 September 2024 from the NOAA GFS bucket on AWS, 10 m UGRD and VGRD, cut to 18–36°N and 90–68°W.
from pathlib import Path

import matplotlib
matplotlib.use("Agg")
import matplotlib.pyplot as plt
import numpy as np
import requests
import xarray as xr

Path("data").mkdir(exist_ok=True)
GFS = "https://noaa-gfs-bdp-pds.s3.amazonaws.com/gfs.20240927/00/atmos/gfs.t00z.pgrb2.0p25.f000"
G = Path("data/gfs_helene.grib2")
if not G.exists():
    lines = requests.get(GFS + ".idx", timeout=60).text.splitlines()
    starts = [int(l.split(":")[1]) for l in lines]
    with open(G, "wb") as f:
        for i, l in enumerate(lines):
            if ":UGRD:10 m above ground:" in l or ":VGRD:10 m above ground:" in l:
                f.write(requests.get(GFS, headers={"Range": f"bytes={starts[i]}-{starts[i + 1] - 1}"}, timeout=120).content)
ds = xr.open_dataset(G, engine="cfgrib", decode_timedelta=False, backend_kwargs={
    "indexpath": "", "filter_by_keys": {"typeOfLevel": "heightAboveGround", "level": 10}}).load()
W = ds.sel(latitude=slice(36, 18), longitude=slice(270, 292))
LON, LAT = W.longitude.values - 360, W.latitude.values
print(f"{W.u10.size:,} grid points; units of u10: {W.u10.attrs.get('units')}")
6,497 grid points; units of u10: m s**-1
Example 1: the Southern Hemisphere
Matplotlib draws the feathers on the side of the staff that points towards low pressure in the Northern Hemisphere; Southern Hemisphere barbs are drawn the other way. flip_barb takes an array, so a global map can set it from latitude:
lat2d = np.broadcast_to(LAT[:, None], W.u10.shape)
flip = lat2d < 0
print(f"barbs to flip on this map: {flip.sum()} (all of it is north of the equator)")
barbs to flip on this map: 0 (all of it is north of the equator)
Example 2: barbs from station reports
Stations report speed and direction; convert to knots and components before plotting, with the same sign convention as for model winds:
obs_dir, obs_kt = np.array([40.0, 10.0, 160.0]), np.array([6.7, 13.4, 12.9]) * KT       # Tallahassee, Apalachicola, Tampa
u_o, v_o = -obs_kt * np.sin(np.radians(obs_dir)), -obs_kt * np.cos(np.radians(obs_dir))
print(np.column_stack([obs_kt.round(0), u_o.round(1), v_o.round(1)]))
[[ 13. -8.4 -10. ]
[ 26. -4.5 -25.7]
[ 25. -8.6 23.6]]
How a barb is built
A barb is built from the wind's speed and direction: the staff lies along the direction, drawn from the station towards where the wind comes from, and the feathers sit at the far end. Speed is then a sum: count pennants as 50, full feathers as 10 and half feathers as 5. The design suits hand-plotted station maps, where a symbol has to carry a speed in very little space, and that is also why it works in steps of 5 knots.
Barbs are precise and hard to read at a glance; arrows are the opposite. For specialist audiences, and wherever a reader needs the number at a point, use barbs; for the general shape of the flow, use arrows or streamlines, or barbs over a colour field of speed.
Units, calm and increments
- Units: GFS winds are m/s; knots are m/s × 1.94384.
- Calm: barbs under half a feather are drawn as an empty circle;
sizes=dict(emptybarb=0)hides them. - Increments:
barb_increments=dict(half=5, full=10, flag=50)is the default; changing it makes the barbs unreadable to anyone else. - Length:
lengthis in points, not data units; barbs do not scale with the map. - Projected maps: rotate
uandvto the map axes first, as for arrows.
Internal links
- How to draw a wind arrow map in Python — the other way to draw vectors
- How to calculate wind speed and direction from u and v — the components
FAQ
How do I plot wind barbs in Python?
Use matplotlib.pyplot.barbs(lon, lat, u, v) with u and v converted to knots, on a thinned grid.
What units do wind barbs use?
Knots by convention: a half feather is 5 knots, a full feather 10 and a pennant 50.
Why do my wind barbs show half the expected speed?
The components were passed in metres per second; matplotlib counts feathers in whatever unit it receives.
Which way do wind barbs point?
Along the direction the wind comes from, with the feathers at the upwind end.