
How to Analyse Pedestrian Deaths with FARS in Python
On this page
Problem statement
Pedestrians are about one in six people killed on US roads, and a crash map of all fatalities hides them among vehicle occupants. FARS records every person involved in a fatal crash, with their role, injury and, for pedestrians, where they were: in a crosswalk, at an intersection, on the shoulder, mid-block. Joined to the crash file, which carries the light, the road type and the location, it shows when and where pedestrians die, and which of the usual explanations the data supports.
This page selects pedestrians killed in 2023 from the FARS person file, joins their crashes, measures the light, location and road type, maps the deaths, and computes pedestrian deaths per 100,000 residents by state.
Quick answer
Select people with PER_TYP 5 (pedestrian) and INJ_SEV 4 (killed), then join the crash file on ST_CASE:
PED = P[(P.PER_TYP == 5) & (P.INJ_SEV == 4)].merge(A[["ST_CASE", "LGT_CONDNAME", "LATITUDE", "LONGITUD"]], on="ST_CASE")
print(f"pedestrians killed in 2023: {len(PED):,} of {(P.INJ_SEV == 4).sum():,} road deaths ({len(PED) / (P.INJ_SEV == 4).sum():.1%})")
print(f"in the dark: {PED.LGT_CONDNAME.str.startswith('Dark').mean():.1%}; in urban areas: {(PED.RUR_URBNAME == 'Urban').mean():.1%}")
print(f"all fatal crashes: in the dark {A.LGT_CONDNAME.str.startswith('Dark').mean():.1%}; in urban areas {(A.RUR_URBNAME == 'Urban').mean():.1%}")
pedestrians killed in 2023: 7,367 of 41,025 road deaths (18.0%)
in the dark: 76.5%; in urban areas: 83.2%
all fatal crashes: in the dark 50.2%; in urban areas 59.6%
7,367 pedestrians were killed in 2023, 18.0% of all road deaths. Three in four died in the dark, against half of all fatal crashes, and five in six in urban areas, against three in five.
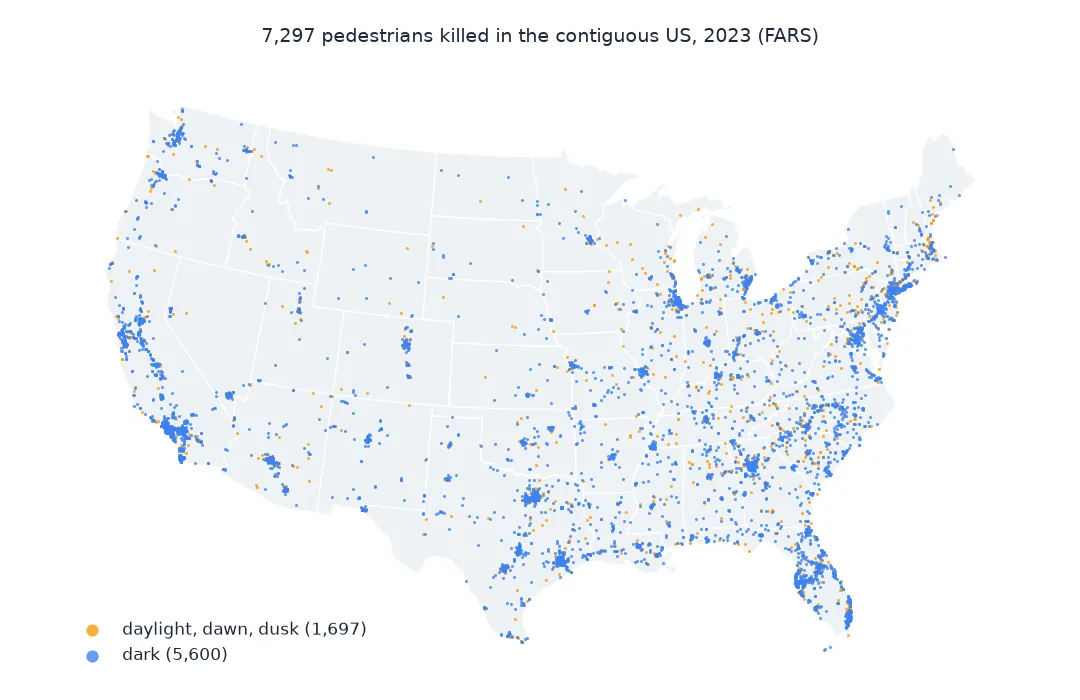
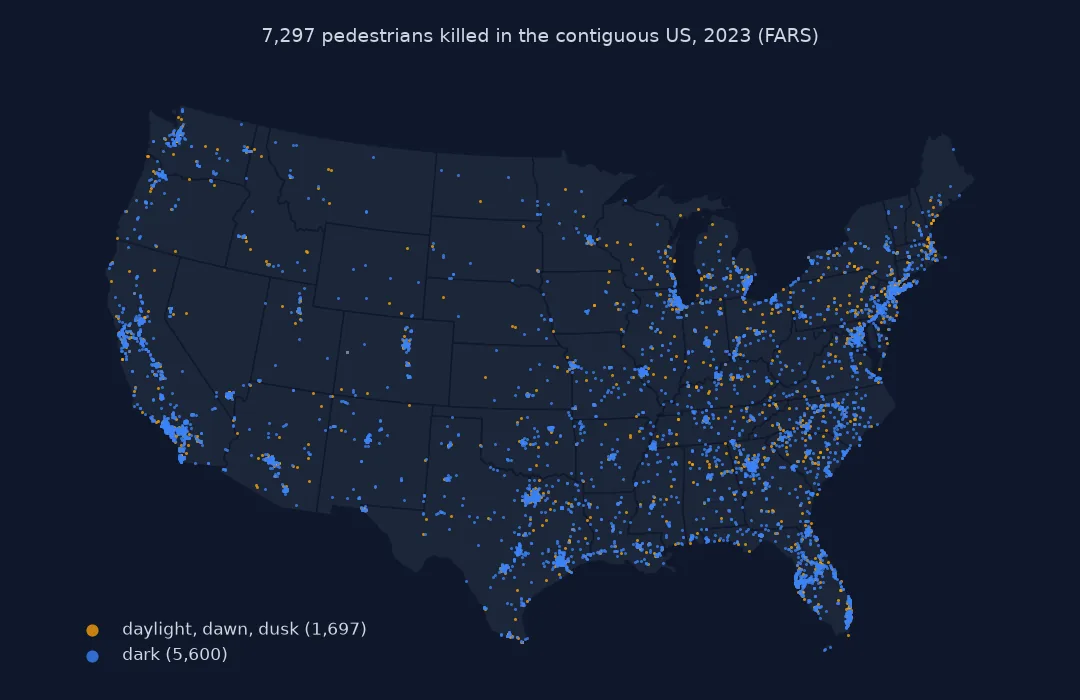
Where pedestrians were, what road, state rates
1. Where the pedestrian was
The person file's LOCATION records where each pedestrian was when struck:
loc = PED.LOCATIONNAME.value_counts(normalize=True)
print(loc.head(5).map("{:.1%}".format).to_string())
mid = PED.LOCATIONNAME.str.startswith("Not at Intersection")
print(f"away from an intersection: {mid.mean():.1%}; in a marked crosswalk at an intersection: {loc['At Intersection - In Marked Crosswalk']:.1%}")
LOCATIONNAME
Not at Intersection - On Roadway, Not in Marked Crosswalk 69.8%
At Intersection - In Marked Crosswalk 9.9%
Shoulder/Roadside 5.2%
At Intersection - Not In Crosswalk 4.0%
Not at Intersection - On Roadway, Crosswalk Availability Unknown 2.4%
away from an intersection: 72.9%; in a marked crosswalk at an intersection: 9.9%
Seven in ten were struck on the roadway away from an intersection and outside any marked crosswalk; one in ten in a marked crosswalk at an intersection.
2. What kind of road
FARS classifies the road by its functional system, from interstates to local streets:
road = PED.FUNC_SYSNAME.value_counts(normalize=True)
print(road.head(6).map("{:.1%}".format).to_string())
arterial = PED.FUNC_SYSNAME.isin(["Other Principal Arterial", "Minor Arterial"])
print(f"principal and minor arterials together: {arterial.mean():.1%}; all fatal crashes: "
      f"{A.FUNC_SYSNAME.isin(['Other Principal Arterial', 'Minor Arterial']).mean():.1%}")
FUNC_SYSNAME
Other Principal Arterial 38.3%
Minor Arterial 24.4%
Interstate 12.4%
Major Collector 10.4%
Local 8.4%
Other Freeways and Expressways 3.9%
principal and minor arterials together: 62.7%; all fatal crashes: 52.9%
Arterials account for 62.7% of pedestrian deaths, against 52.9% of all fatal crashes, and local streets for 8.4%. One in eight died on an interstate.
3. Deaths per 100,000 residents by state
d = PED.groupby("STATE").size()
pop = POP.set_index("STATE")
R = pd.DataFrame({"state": pop.NAME, "deaths": d, "residents": pop.POPESTIMATE2023}).dropna().astype({"deaths": int})
R["per_100k"] = R.deaths / R.residents * 1e5
print(f"US: {R.deaths.sum() / R.residents.sum() * 1e5:.2f} pedestrian deaths per 100,000")
print(R.sort_values("per_100k", ascending=False).iloc[[0, 1, 2, -2, -1]][["state", "deaths", "per_100k"]].round(2).to_string(index=False))
US: 2.20 pedestrian deaths per 100,000
state deaths per_100k
New Mexico 105 4.97
Arizona 270 3.63
South Carolina 187 3.48
Minnesota 39 0.68
Nebraska 13 0.66
The US rate is 2.20 per 100,000. New Mexico's 4.97 is more than double it and seven times Nebraska's 0.66; Arizona and South Carolina follow New Mexico.
The ages of pedestrians killed
The data used on this page
NHTSA's Fatality Analysis Reporting System 2023 national CSV file, person.csv and accident.csv, and the Census Bureau's state population estimates, vintage 2023.
import zipfile
from pathlib import Path

import pandas as pd
import requests

Path("data").mkdir(exist_ok=True)
SRC = {"FARS2023NationalCSV.zip": "https://static.nhtsa.gov/nhtsa/downloads/FARS/2023/National/FARS2023NationalCSV.zip",
       "NST-EST2023-ALLDATA.csv": "https://www2.census.gov/programs-surveys/popest/datasets/2020-2023/state/totals/NST-EST2023-ALLDATA.csv"}
for name, url in SRC.items():
    if not Path("data", name).exists():
        Path("data", name).write_bytes(requests.get(url, timeout=600).content)
Z = zipfile.ZipFile("data/FARS2023NationalCSV.zip")
A = pd.read_csv(Z.open("FARS2023NationalCSV/accident.csv"), encoding="latin1", low_memory=False)
P = pd.read_csv(Z.open("FARS2023NationalCSV/person.csv"), encoding="latin1", low_memory=False,
                usecols=["STATE", "ST_CASE", "PER_TYP", "INJ_SEV", "AGE", "LOCATIONNAME", "RUR_URBNAME", "FUNC_SYSNAME", "HOUR"])
POP = pd.read_csv("data/NST-EST2023-ALLDATA.csv").query("SUMLEV == 40")
print(f"{len(A):,} crashes; {len(P):,} people")
37,769 crashes; 92,768 people
Example 1: age of pedestrians killed
Compare the ages of pedestrians killed with the ages of all people killed:
age = PED.AGE[PED.AGE < 998]                                          # 998 and 999 code unknown age
killed = P.AGE[(P.INJ_SEV == 4) & (P.AGE < 998)]
print(f"pedestrians: median age {age.median():.0f}, 65 or older {(age >= 65).mean():.1%}; all people killed: median {killed.median():.0f}, "
      f"65 or older {(killed >= 65).mean():.1%}")
print(f"pedestrians killed under 16: {(age < 16).sum()}")
pedestrians: median age 47, 65 or older 21.2%; all people killed: median 42, 65 or older 19.4%
pedestrians killed under 16: 199
Pedestrians killed are older than road victims overall, a median of 47 against 42, and 21.2% were 65 or older; 199 were children under 16.
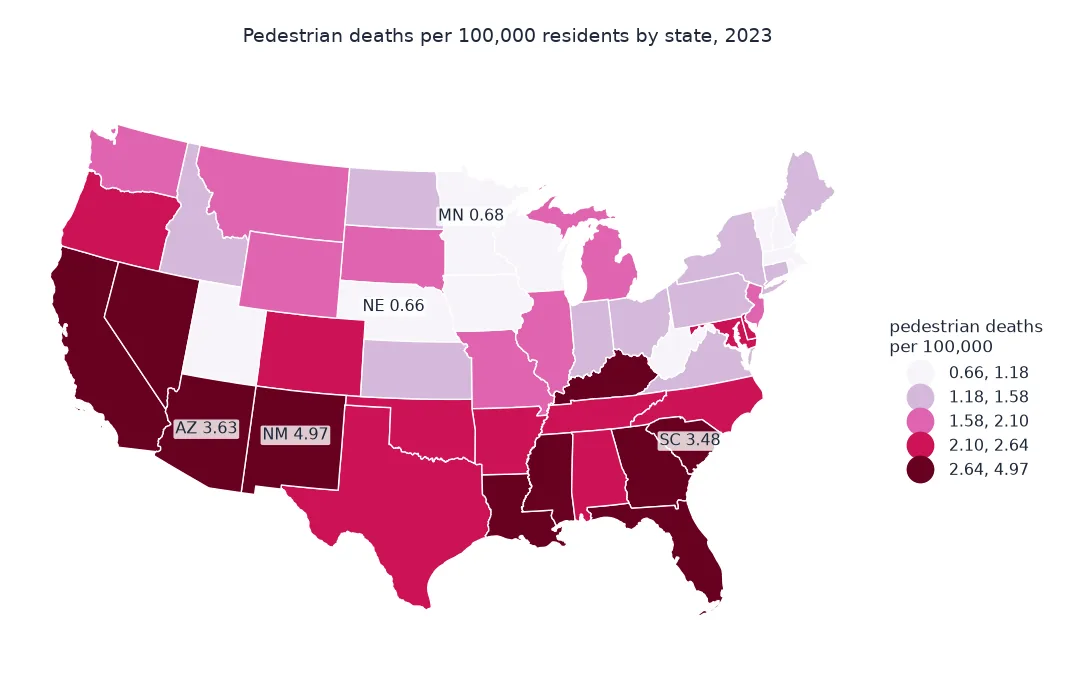
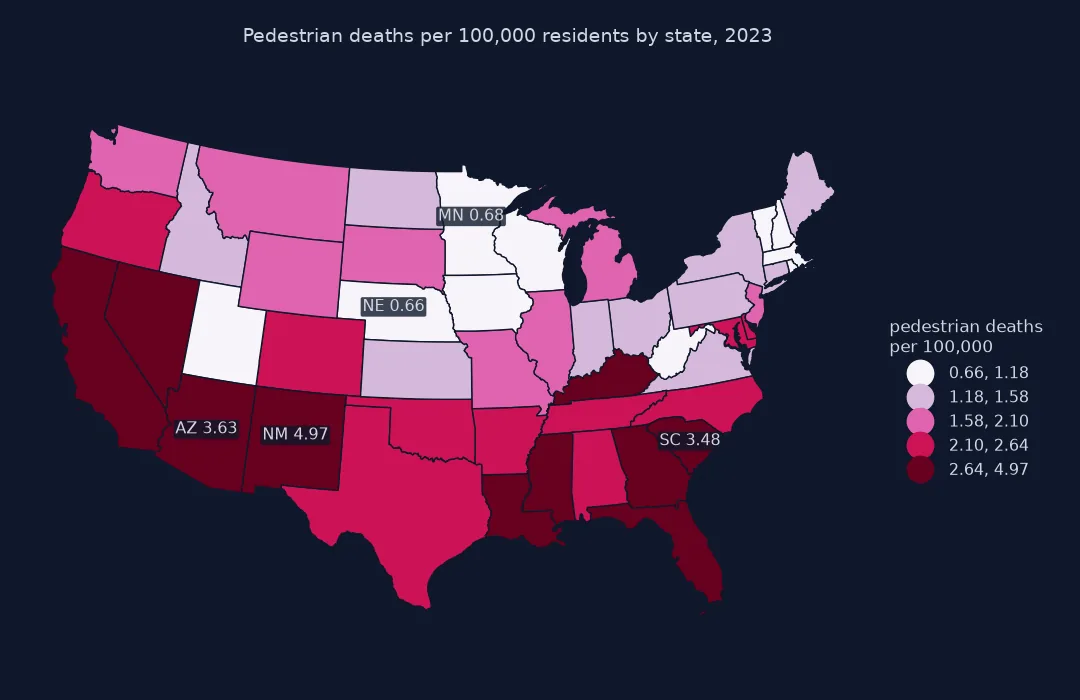
What the person file adds
The FARS person file answers questions the crash file cannot. Each person has a role (driver, passenger, pedestrian, cyclist), an injury severity and, for pedestrians, a location code. Selecting by role and injury and joining to the crash on ST_CASE gives every pedestrian death with the crash's time, light, road and coordinates.
The picture that emerges in 2023 is consistent. Pedestrian deaths are overwhelmingly urban and overwhelmingly in the dark. Most happen away from intersections, on the roadway outside any marked crosswalk, and on arterials: multi-lane roads built for vehicle throughput that pass through places where people walk. That points to road design and lighting as much as to individual behaviour, which is why pedestrian safety programmes focus on arterials.
Counts per resident are a first look, not a risk measure. A state where more people walk has more pedestrian exposure, and FARS has no denominator for walking; the American Community Survey's commute-mode question and household travel surveys are the usual substitutes.
Unknown codes, off-road deaths and cyclists
- Codes for unknown:
AGE998 and 999 mean not reported and unknown;HOUR99 is unknown. - Pedestrians not on the road: FARS covers crashes on public roads; deaths in parking lots and driveways are in NHTSA's separate non-traffic surveillance data.
- Cyclists:
PER_TYP6 is a bicyclist; the same join gives cyclist deaths. - Crash or person coordinates: coordinates are on the crash, so pedestrians in the same crash share a point.
- Year-to-year: one year of state counts is noisy for small states; pool several years before ranking them.
Internal links
- How to map fatal road crashes in the US with FARS in Python — the FARS files and their codes
- How to build a high-injury network from crash data in Python — where severe crashes concentrate in a city
FAQ
How do I find pedestrian deaths in FARS?
Read person.csv, select PER_TYP == 5 and INJ_SEV == 4, and join to accident.csv on ST_CASE for the crash's location and conditions.
How many pedestrians were killed in the US in 2023?
The FARS 2023 file records 7,367 pedestrians killed, 18% of all road deaths.
Where are pedestrians killed?
Mostly in urban areas, in the dark, away from intersections and outside marked crosswalks, and on arterial roads.
Which state has the highest pedestrian death rate?
In 2023, New Mexico, as computed on this page from FARS deaths and Census population estimates.