
How to Analyse Cyclist Casualties from STATS19 in Python
On this page
Problem statement
Cyclists are a small share of road casualties in Great Britain and a large share of the public argument about road safety. Answering questions about them needs all three STATS19 files: the casualty file says who was hurt and how badly, the collision file says where and when, and the vehicle file says what else was involved. Joining them is straightforward once the keys are clear, and the result shows when cyclists are hurt, on what kinds of roads, and by what.
This page selects the cyclists injured in 2023 from the casualty file, joins their collisions and the other vehicles involved, measures severity by speed limit with the DfT's adjusted severity, counts casualties by hour, and maps them, with London's share.
Quick answer
Select casualties with casualty_type 1 (cyclist) and join their collisions on collision_index:
CY = CAS[CAS.casualty_type == 1].merge(COL[["collision_index", "speed_limit", "time", "police_force", "urban_or_rural_area",
                                            "number_of_vehicles", "location_easting_osgr", "location_northing_osgr"]], on="collision_index")
sev = CY.casualty_severity.map({1: "killed", 2: "seriously injured", 3: "slightly injured"}).value_counts()
print(f"cyclist casualties in 2023: {len(CY):,} of {len(CAS):,} casualties ({len(CY) / len(CAS):.1%})")
print(sev.to_string())
print(f"seriously injured, adjusted for reporting method: {CY.casualty_adjusted_severity_serious.sum():,.0f}")
cyclist casualties in 2023: 14,999 of 132,977 casualties (11.3%)
casualty_severity
slightly injured 11271
seriously injured 3641
killed 87
seriously injured, adjusted for reporting method: 3,843
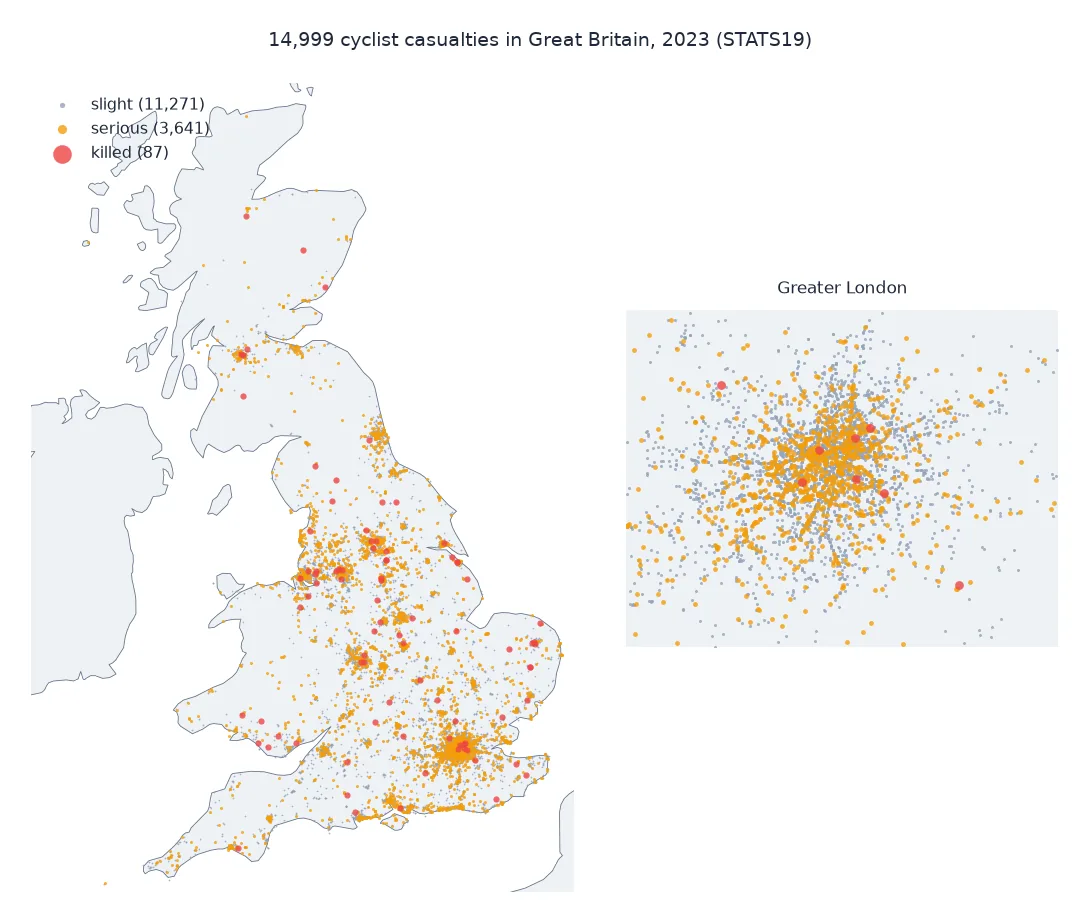
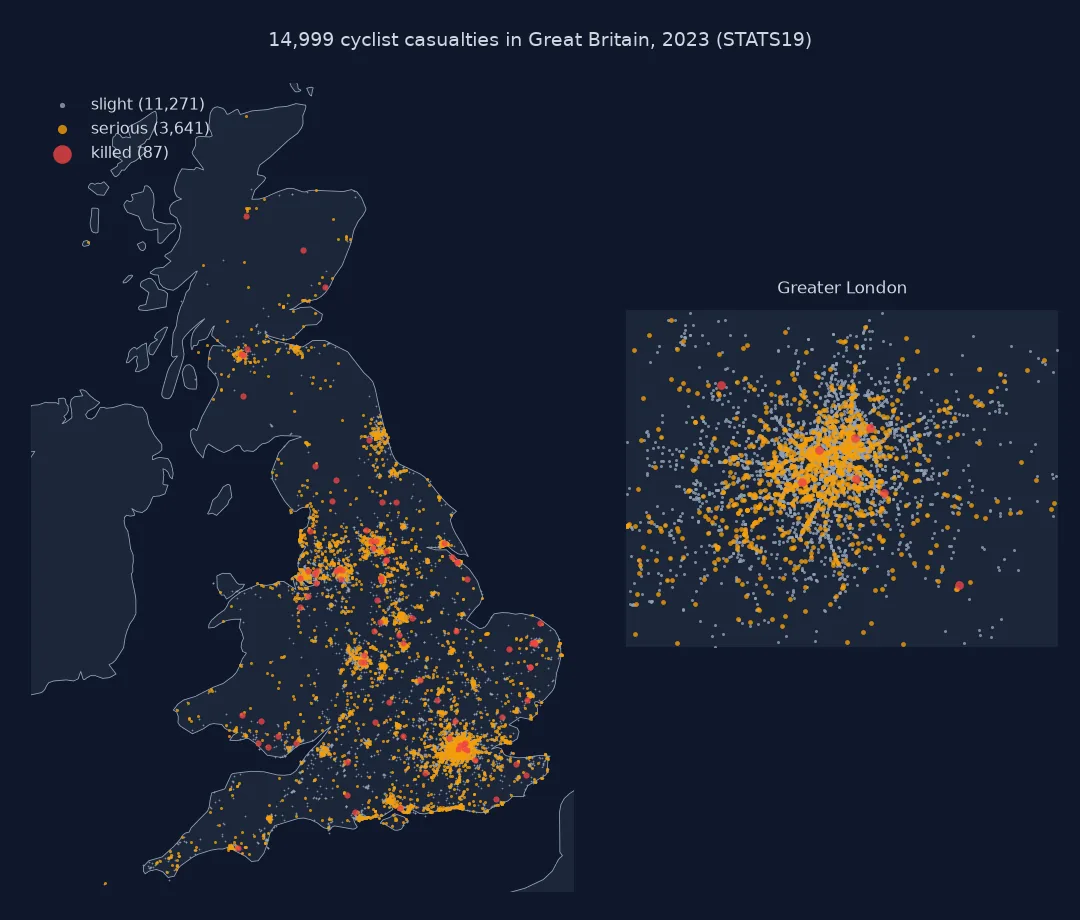
14,999 cyclists were injured in collisions reported to police in 2023, 11.3% of all casualties: 87 killed and 3,641 seriously injured as recorded, 3,843 after adjusting for reporting method.
When cyclists are hurt, severity by speed limit, other vehicles
1. When cyclists are hurt
Count by the hour of the collision:
CY["hour"] = pd.to_datetime(CY.time, format="%H:%M", errors="coerce").dt.hour
h = CY.hour.value_counts().sort_index()
print(f"busiest hours: {h.idxmax():02d}:00 ({h.max():,}) and {h.loc[6:10].idxmax():02d}:00 ({h.loc[6:10].max():,}); quietest {h.idxmin():02d}:00 ({h.min()})")
print(f"07:00-09:59 and 16:00-18:59 together: {h.loc[7:9].sum() + h.loc[16:18].sum():,} ({(h.loc[7:9].sum() + h.loc[16:18].sum()) / h.sum():.1%})")
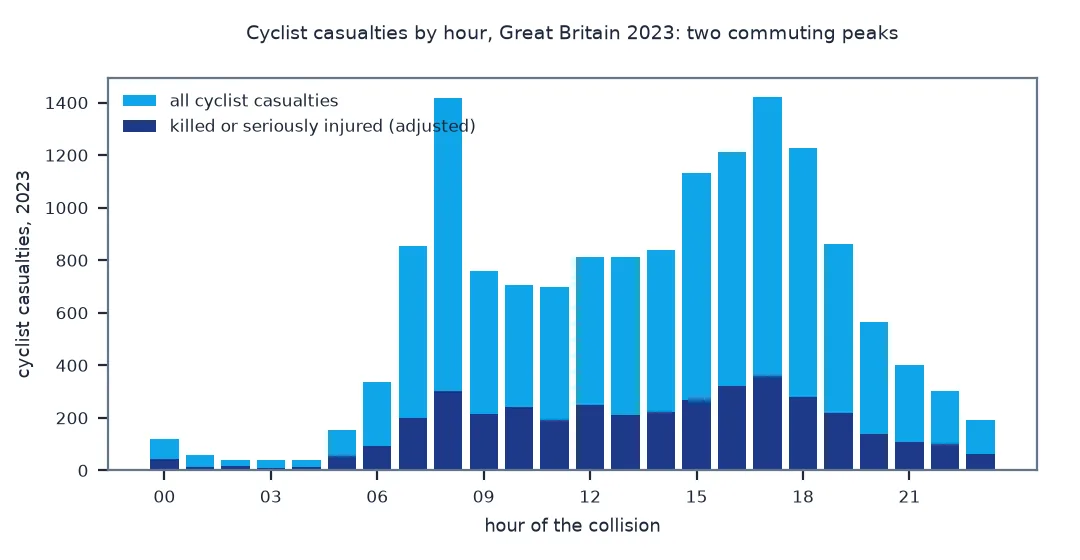
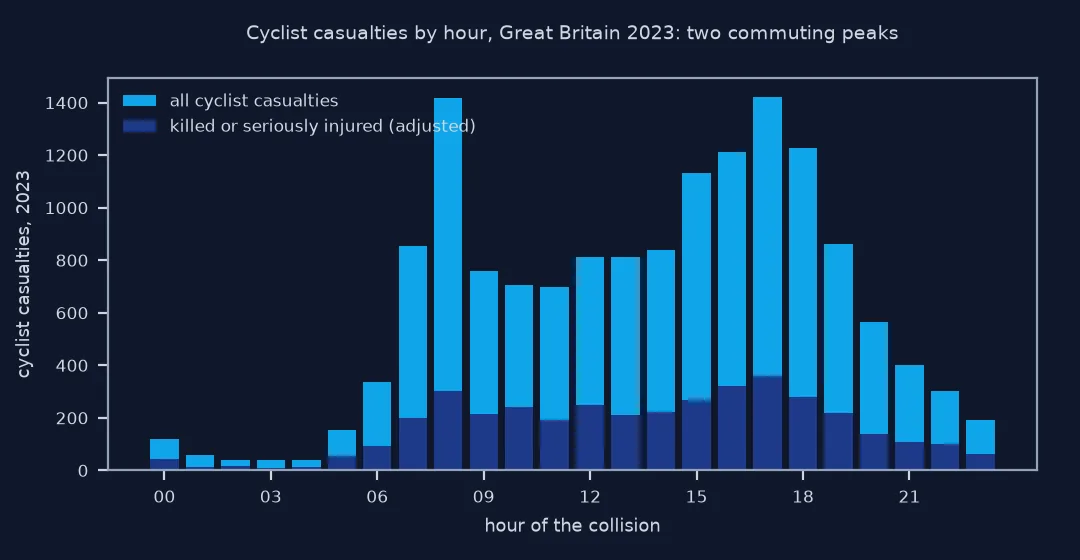
busiest hours: 17:00 (1,421) and 08:00 (1,416); quietest 04:00 (38)
07:00-09:59 and 16:00-18:59 together: 6,890 (45.9%)
Two peaks, 08:00 and 17:00, almost equal at about 1,420 casualties each, and the six commuting hours hold 45.9% of the year's cyclist casualties.
2. Severity by speed limit
The adjusted severity column gives, for each casualty, the probability of a serious injury under injury-based reporting; its mean is the KSI share once deaths are added:
CY["ksi"] = (CY.casualty_severity == 1) + CY.casualty_adjusted_severity_serious
s = CY.groupby("speed_limit").agg(casualties=("ksi", "size"), ksi_share=("ksi", "mean"))
print(s[s.casualties >= 50].round(3).to_string())
casualties ksi_share
speed_limit
20 4305 0.211
30 8922 0.259
40 828 0.356
50 234 0.400
60 659 0.458
70 51 0.418
The KSI share rises from 21.1% on 20 mph roads to 45.8% on 60 mph roads. Most cyclist casualties, 13,227 of 14,999, are on 20 and 30 mph roads, the streets of towns and cities.
3. What else was involved
Join the vehicle file on collision_index and keep the other vehicles. Codes are those of the DfT's data guide:
VEH_TYPE = {9: "car", 19: "van or goods under 3.5 t", 8: "taxi or private hire car", 11: "bus or coach",
            21: "goods 7.5 t and over", 3: "motorcycle up to 125 cc", 5: "motorcycle over 500 cc"}
other = VEH[VEH.collision_index.isin(CY.collision_index) & (VEH.vehicle_type != 1)]
print(f"collisions with a cyclist casualty and no other vehicle: {(CY.number_of_vehicles == 1).mean():.1%}")
print(other.vehicle_type.map(VEH_TYPE).fillna("other").value_counts(normalize=True).head(5).map("{:.1%}".format).to_string())
collisions with a cyclist casualty and no other vehicle: 4.0%
vehicle_type
car 80.2%
van or goods under 3.5 t 8.5%
taxi or private hire car 3.8%
other 3.6%
bus or coach 1.7%
Only 4.0% of cyclist casualties come from collisions with no other vehicle. Of the other vehicles involved, 80.2% were cars and 8.5% vans or light goods vehicles.
London's share of cyclist casualties
The data used on this page
The Department for Transport's road safety open data for 2023: the collision, casualty and vehicle files; the ONS local authority to police force area lookup for December 2023 to name forces; and Natural Earth's 1:50m land polygons.
from pathlib import Path

import pandas as pd
import requests

Path("data").mkdir(exist_ok=True)
BASE = "https://data.dft.gov.uk/road-accidents-safety-data/dft-road-casualty-statistics-{}-2023.csv"
for part in ("collision", "casualty", "vehicle"):
    f = Path(f"data/dft-road-casualty-statistics-{part}-2023.csv")
    if not f.exists():
        f.write_bytes(requests.get(BASE.format(part), timeout=600).content)
L = Path("data/ne_50m_land.zip")
if not L.exists():
    L.write_bytes(requests.get("https://naciscdn.org/naturalearth/50m/physical/ne_50m_land.zip", timeout=300).content)
COL = pd.read_csv("data/dft-road-casualty-statistics-collision-2023.csv", low_memory=False)
CAS = pd.read_csv("data/dft-road-casualty-statistics-casualty-2023.csv", low_memory=False)
VEH = pd.read_csv("data/dft-road-casualty-statistics-vehicle-2023.csv", low_memory=False)
print(f"{len(COL):,} collisions, {len(CAS):,} casualties, {len(VEH):,} vehicles")
104,258 collisions, 132,977 casualties, 189,815 vehicles
Example 1: London's share
The Metropolitan Police and the City of London Police, force codes 1 and 48, cover Greater London:
london = CY.police_force.isin([1, 48])
print(f"cyclist casualties in London: {london.sum():,} ({london.mean():.1%}); all casualties in London: {COL[COL.police_force.isin([1, 48])].number_of_casualties.sum() / len(CAS):.1%}")
print(f"KSI share, London {CY.ksi[london].mean():.1%}; elsewhere {CY.ksi[~london].mean():.1%}")
print(f"urban roads: {(CY.urban_or_rural_area == 1).mean():.1%} of cyclist casualties")
cyclist casualties in London: 4,797 (32.0%); all casualties in London: 19.7%
KSI share, London 19.6%; elsewhere 29.3%
urban roads: 83.4% of cyclist casualties
London accounts for 32.0% of Britain's cyclist casualties against 19.7% of all casualties, and its cyclist casualties are less often severe: 19.6% KSI against 29.3% elsewhere.
Linking casualties to their vehicles
STATS19 links its three files through collision_index, and the casualty and vehicle files through vehicle_reference within a collision: a cyclist casualty belongs to the pedal cycle that was their vehicle. For questions about what a cyclist collided with, the other vehicles in the same collision are the answer; most cyclist casualties involve exactly one other vehicle, usually a car.
The patterns are consistent with how and where people cycle. Casualties peak in the commuting hours, are concentrated in towns and especially London, and occur mostly on 20 and 30 mph roads. Severity rises with the speed limit: a cyclist casualty on a 60 mph road is more than twice as likely to be killed or seriously injured as one on a 20 mph road. Without data on how much cycling happens where, none of this is a risk per trip or per mile; it describes casualties, not danger.
STATS19 also misses many cyclist injuries. Comparisons with hospital records find that a large share of injured cyclists, particularly in collisions without a motor vehicle, never appear in police data. The 4% of cyclist casualties here in single-vehicle collisions are the ones police were told about.
E-scooters, adjusted severity and exposure
- E-scooters: the casualty file has an
escooter_flag; e-scooter riders are not cyclists in STATS19. - Adjusted severity: use
casualty_adjusted_severity_seriousfor serious counts across forces and years, as with collisions. - Codes: vehicle and casualty types are numeric codes from the DfT data guide; check them against the guide for the year.
- Exposure: the National Travel Survey and DfT traffic counts estimate cycling distance, the denominator for risk.
- Deprivation:
casualty_imd_decilerecords the deprivation of the casualty's home area, useful for equity analysis.
Internal links
- How to map UK road collisions from STATS19 in Python — the collision file and the severity adjustment
- How to analyse pedestrian deaths with FARS in Python — vulnerable road users in the US
FAQ
How do I find cyclist casualties in STATS19?
Read the casualty file and select casualty_type == 1; join the collision file on collision_index for location and time, and the vehicle file for the other vehicles.
How many cyclists were injured on British roads in 2023?
STATS19 recorded 14,999 cyclist casualties in 2023: 87 killed, 3,641 seriously injured as recorded, 3,843 after adjustment.
When are cyclists most often injured?
In the commuting peaks: in 2023 the busiest hours were 17:00 and 08:00.
Which vehicles are involved in collisions with cyclists?
Cars, in most cases; vans and light goods vehicles next.