
Why Does My Map Animation Jump and Jitter Between Frames?
On this page
Problem statement
The animation plays, but the map will not hold still: the coastline twitches, the whole map zooms in and out, or the frame wobbles by a few pixels as the title changes. Viewers read any movement as change in the data, so a map that moves when the data does not is misleading as well as distracting. Three settings cause almost all of it. bbox_inches="tight" gives each frame a different pixel size. Autoscaled axes fit each frame's own data. tight_layout moves the axes as tick labels and titles change. This page reproduces all three on an animation of Hurricane Beryl's 2024 track, measures the movement, and fixes it.
Quick answer
Fix the figure size, place the axes by hand, set the map limits once, and save without a tight bounding box:
def frame(n):
    fig = plt.figure(figsize=(6, 4), dpi=100)
    ax = fig.add_axes([0, 0, 1, 1])                         # the axes never move
    land.plot(ax=ax, color="#eef2f6", edgecolor="#94a3b8", lw=0.3)
    ax.plot(track.lon[:n], track.lat[:n], color="#d7301f", lw=1.5)
    ax.set_xlim(-100, -35); ax.set_ylim(8, 46)              # limits set once, from the whole track
    ax.set_axis_off()
    ax.text(0.02, 0.96, f"{track.t[n - 1]:%d %b %H:%M} UTC  {track.wind[n - 1]:.0f} kt", transform=ax.transAxes, va="top")
    fig.canvas.draw()
    img = np.asarray(fig.canvas.buffer_rgba())[..., :3].copy()
    houston = ax.transData.transform((-95.37, 29.76))
    plt.close(fig)
    return img, houston

fixed = [frame(n) for n in range(2, len(track) + 1)]
sizes = {f[0].shape for f in fixed}
spots = np.array([f[1] for f in fixed])
print(f"{len(fixed)} frames, sizes {sizes}, Houston drawn at x {spots[:, 0].min():.1f}–{spots[:, 0].max():.1f} px")
108 frames, sizes {(400, 600, 3)}, Houston drawn at x 42.7–42.7 px
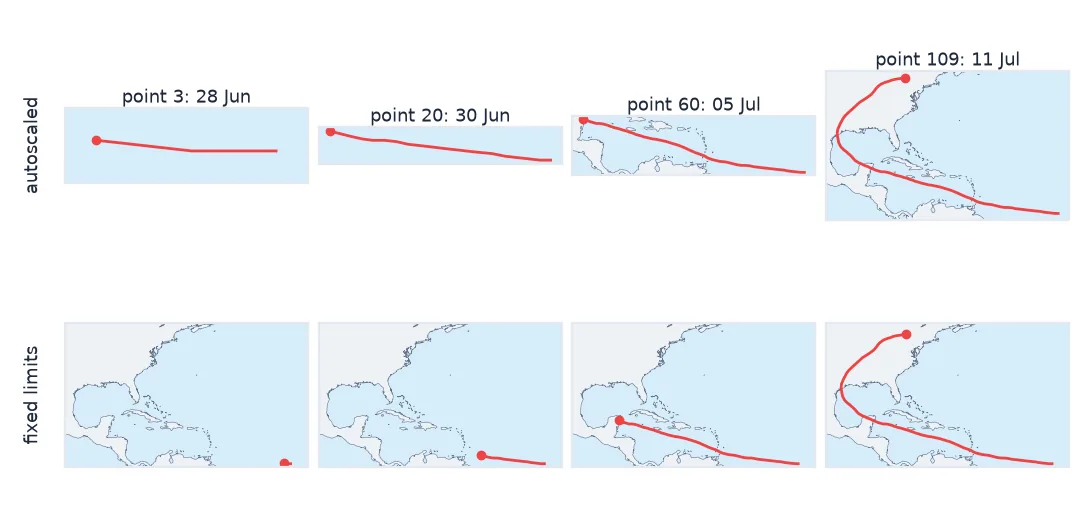
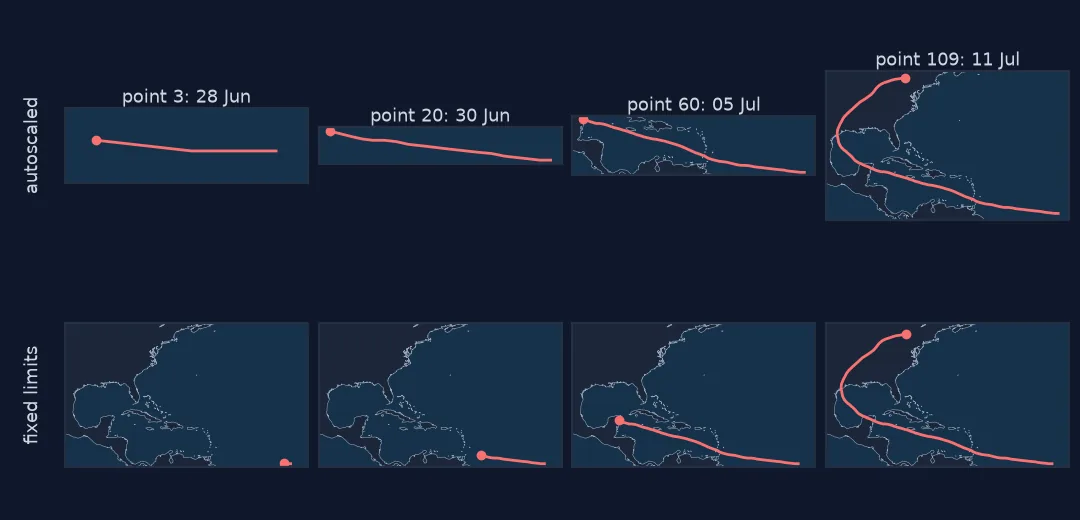
Frame sizes, map extent, axes position
1. Check the frame sizes
savefig(..., bbox_inches="tight") crops each frame to its own content, including any text that sticks out of the axes. A label beside the storm runs off the right edge while Beryl is still in the eastern Atlantic. Save a few frames that way and look:
shapes = []
for n in (2, 20, 60, len(track)):
    fig, ax = plt.subplots(figsize=(6, 4), dpi=100)
    land.plot(ax=ax, color="#eef2f6", edgecolor="#94a3b8", lw=0.3)
    ax.plot(track.lon[:n], track.lat[:n], color="#d7301f")
    ax.set_xlim(-100, -35); ax.set_ylim(8, 46)
    ax.text(track.lon[n - 1] + 1, track.lat[n - 1], f"Beryl {track.wind[n - 1]:.0f} kt")     # label beside the storm
    fig.savefig("data/tight.png", bbox_inches="tight"); plt.close(fig)
    shapes.append(iio.imread("data/tight.png").shape[:2])
print("frame sizes with bbox_inches='tight':", shapes)
frame sizes with bbox_inches='tight': [(318, 557), (318, 512), (318, 512), (318, 512)]
The first frame is wider than the rest. Frames of different sizes either fail to stack or get padded and rescaled by the writer, and the map shifts or scales with them.
2. Check the map extent
Without fixed limits, matplotlib fits the axes to whatever is drawn. When the land layer covers the world, the frame looks stable. When only the track is plotted, or the land is clipped to the track, the map zooms with it:
extents = []
for n in range(2, len(track) + 1, 10):
    fig, ax = plt.subplots(figsize=(6, 4), dpi=100)
    ax.plot(track.lon[:n], track.lat[:n])                   # no set_xlim / set_ylim
    extents.append((*ax.get_xlim(), *ax.get_ylim())); plt.close(fig)
e = np.array(extents)
width = e[:, 1] - e[:, 0]
print(f"{len(e)} sampled frames: map width from {width.min():.1f}° to {width.max():.1f}° of longitude "
      f"({width.max() / width.min():.0f}x zoom change), centre moves {np.ptp((e[:, 0] + e[:, 1]) / 2):.0f}° east-west")
11 sampled frames: map width from 0.9° to 62.0° of longitude (71x zoom change), centre moves 28° east-west
3. Check the axes position
tight_layout() and constrained_layout place the axes to fit the labels around them. With fixed limits the map's own tick labels never change, but a colour bar scaled to the data so far does: its ticks change as the storm strengthens, and the layout makes room for them. Measure where the axes land in each frame:
def axes_box(n, layout):
    fig, ax = plt.subplots(figsize=(6, 4), dpi=100)
    pts = ax.scatter(track.lon[:n], track.lat[:n], c=track.wind[:n], cmap="magma_r")   # colour range = data so far
    fig.colorbar(pts, ax=ax, label="wind (kt)")
    ax.set_xlim(-100, -35); ax.set_ylim(8, 46)
    if layout:
        fig.tight_layout()
    fig.canvas.draw()
    box = ax.get_window_extent().bounds; plt.close(fig)
    return box

for layout in (True, False):
    boxes = np.array([axes_box(n, layout) for n in range(2, len(track) + 1, 5)])
    print(f"tight_layout={layout!s:5}: axes left edge {boxes[:, 0].min():.1f}–{boxes[:, 0].max():.1f} px, "
          f"width {boxes[:, 2].min():.1f}–{boxes[:, 2].max():.1f} px")
tight_layout=True : axes left edge 42.7–42.7 px, width 432.0–433.8 px
tight_layout=False: axes left edge 75.0–75.0 px, width 372.0–372.0 px
With tight_layout the map's width wobbles by up to 1.8 px as the colour bar's labels change; placed by hand, the axes do not move at all. Two pixels is small, but it shows as a shimmer along every coastline. A colour bar should not be rescaled per frame anyway (see the flicker page linked below).
Fixed Hurricane Beryl frames that stack
The data used on this page
Hurricane Beryl's 2024 best track from IBTrACS v04r01 (North Atlantic file), and land polygons from Natural Earth 1:50m.
from pathlib import Path

import geopandas as gpd
import imageio.v3 as iio
import matplotlib
matplotlib.use("Agg")
import matplotlib.pyplot as plt
import numpy as np
import pandas as pd
import requests

Path("data").mkdir(exist_ok=True)
SRC = {"ibtracs.NA.list.v04r01.csv": "https://www.ncei.noaa.gov/data/international-best-track-archive-for-climate-stewardship-ibtracs/v04r01/access/csv/ibtracs.NA.list.v04r01.csv",
       "ne_50m_land.zip": "https://naciscdn.org/naturalearth/50m/physical/ne_50m_land.zip"}
for name, url in SRC.items():
    if not Path("data", name).exists():
        Path("data", name).write_bytes(requests.get(url, timeout=600).content)
ib = pd.read_csv("data/ibtracs.NA.list.v04r01.csv", skiprows=[1], low_memory=False, keep_default_na=False)
track = ib[(ib.NAME == "BERYL") & (ib.SEASON.astype(int) == 2024)].copy()
track = track.assign(t=pd.to_datetime(track.ISO_TIME), lat=pd.to_numeric(track.LAT), lon=pd.to_numeric(track.LON),
                     wind=pd.to_numeric(track.USA_WIND)).reset_index(drop=True)[["t", "lat", "lon", "wind"]]
land = gpd.read_file("data/ne_50m_land.zip").cx[-110:-25, 0:55]
print(f"Beryl 2024: {len(track)} track points, {track.t.min():%d %b} to {track.t.max():%d %b}")
Beryl 2024: 109 track points, 28 Jun to 11 Jul
Example 1: write the fixed frames and confirm they stack
stack = np.stack([f[0] for f in fixed])
iio.imwrite("data/beryl_fixed.gif", stack, duration=80, loop=0)
print(f"stacked {stack.shape}; {Path('data/beryl_fixed.gif').stat().st_size / 1e6:.2f} MB")
stacked (108, 400, 600, 3); 0.46 MB
Every frame is drawn independently
Every frame of an animation is drawn independently, and matplotlib's helpful defaults are decided per drawing. Autoscaling fits the data in front of it. Tight bounding boxes trim to the ink in front of them. Layout engines make room for the labels in front of them. In a single figure those defaults are what you want. In an animation each one makes a decision per frame that should have been made once for all frames, and the map moves whenever that decision changes.
The fix is to take those decisions away from the drawing loop: one figure size, one axes rectangle, one set of map limits, decided before the first frame. Then check it, rather than trusting it. Transform a fixed landmark into pixels in every frame, as the quick answer does with Houston. If it lands on the same pixel every time, the map is still, and any movement the viewer sees is in the data.
FuncAnimation, Cartopy and changing labels
FuncAnimationreuses one figure, which avoids size changes, but autoscaling andtight_layoutinside the update function still move the map.- Cartopy axes recompute extents when features are added; call
set_extentafter adding the data, every frame or once with a fixed axes. - Labels that change length (dates, counts) should be left-aligned in a fixed position or padded to a fixed width.
- Basemap tiles (contextily) fetched per frame at a fitted zoom can change zoom level; fetch once and reuse the image.
- Video writers require all frames the same size; GIF writers may silently pad, which hides the problem until the playback shows it.
Internal links
- How to animate a hurricane track — the full Beryl animation
- Why do the colours flicker in my map animation? — the colour version of the same mistake
FAQ
Why does my matplotlib animation jitter?
Something is decided per frame: the image size (bbox_inches="tight"), the axis limits (autoscaling) or the axes position (tight_layout). Fix all three once for the whole animation.
How do I keep the map extent fixed in an animation?
Call ax.set_xlim and ax.set_ylim with limits computed once from all frames' data, after plotting, in every frame.
Why are my animation frames different sizes?
savefig(bbox_inches="tight") crops each frame to its content. Remove it and use a fixed figure size and axes position.
How can I test that my animation does not jitter?
Transform a fixed point into pixel coordinates with ax.transData.transform in every frame and check it never moves.