
Why Is My Map Animation File So Large, and How Do I Shrink It?
On this page
Problem statement
The animation works, but the file is several megabytes: too heavy for a web page, too big for an email, and slow on a phone. File size is the product of a few things you control: how many pixels each frame has, how many frames there are, how much changes between frames, and how the format compresses what is left. Guessing which one to cut usually cuts the wrong one. This page takes a real 95-frame radar loop of Hurricane Beryl, measures what each lever saves, and combines the ones that do not damage the map.
Quick answer
Measure first. Write the same frames with each change on its own and compare sizes:
def gif_size(frames, ms=100):
    frames[0].save("data/test.gif", save_all=True, append_images=frames[1:], duration=ms, loop=0, optimize=True)
    return Path("data/test.gif").stat().st_size / 1e6

base = gif_size(FRAMES)
print(f"baseline: {len(FRAMES)} frames of {FRAMES[0].size[0]} x {FRAMES[0].size[1]} px, GIF {base:.2f} MB")
baseline: 95 frames of 400 x 400 px, GIF 3.13 MB
Crop, fewer frames or pixels, measured formats
1. Crop to what the reader needs
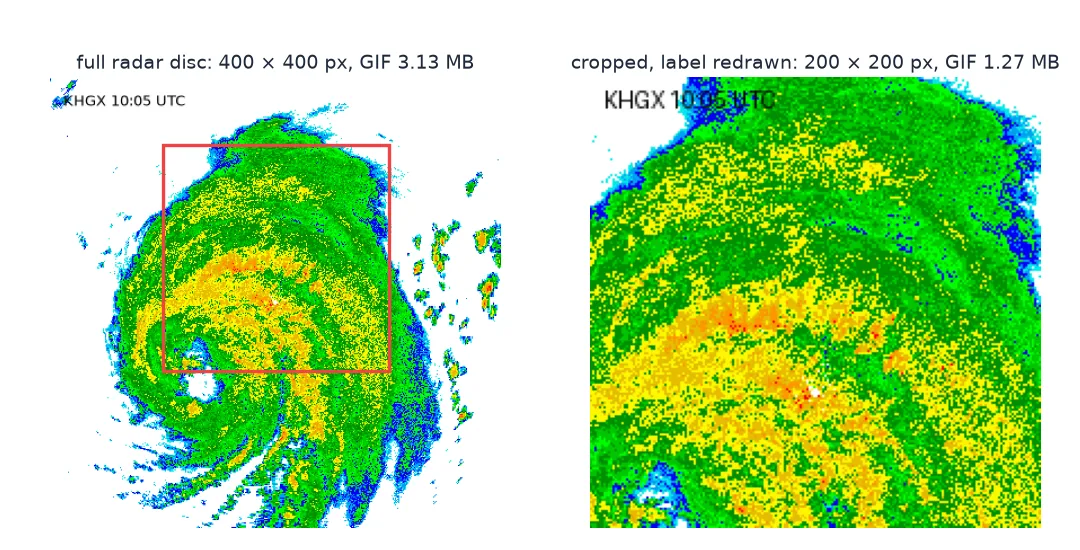
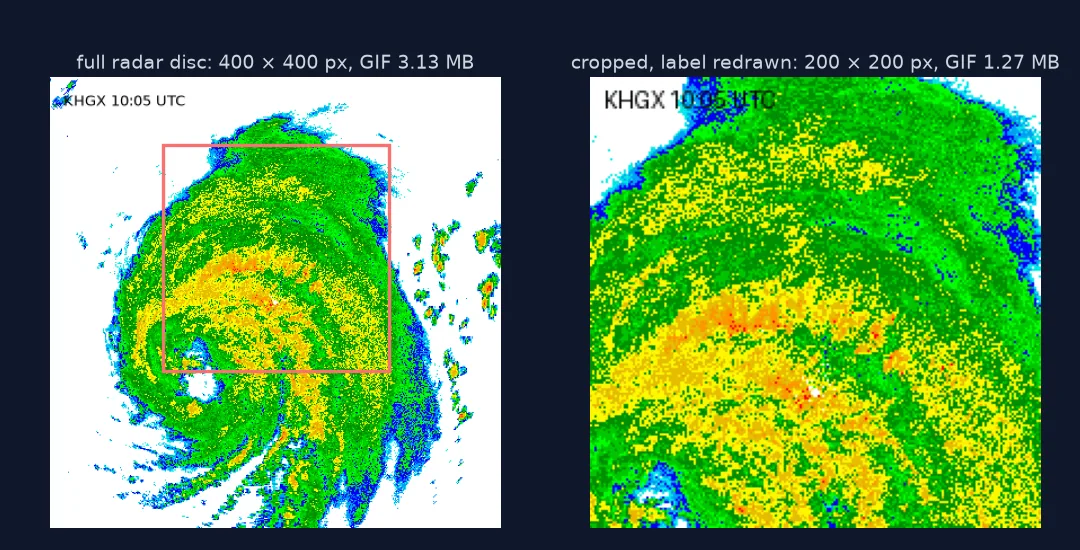
A radar covers a disc 460 km across; the story here is the storm crossing Houston. Cropping to the area of interest removes pixels from every frame. It also cuts off anything drawn outside the box, including the timestamp in the corner, so draw the label again on each cropped frame:
def crop(frames, box):
    out = []
    for f, (t, _) in zip(frames, SCANS):
        c = f.crop(box)
        ImageDraw.Draw(c).text((6, 4), f"KHGX {t:%H:%M} UTC", fill="black")            # the corner label was cropped away
        out.append(c)
    return out

houston = crop(FRAMES, (100, 60, 300, 260))                  # 200 x 200 px around Houston (1 px = 1.15 km)
print(f"cropped to 200 x 200 px: {gif_size(houston):.2f} MB ({gif_size(houston) / base:.0%} of baseline)")
cropped to 200 x 200 px: 1.27 MB (41% of baseline)
2. Use fewer frames, or fewer pixels
Every other scan halves the frames; drawing at a lower resolution cuts the pixels. Both lose information, so measure what they buy:
half_frames = FRAMES[::2]
small = [f.resize((300, 300), Image.Resampling.NEAREST) for f in FRAMES]
print(f"every other scan ({len(half_frames)} frames): {gif_size(half_frames, 200):.2f} MB")
print(f"300 x 300 px instead of 400 x 400:   {gif_size(small):.2f} MB")
every other scan (48 frames): 1.61 MB
300 x 300 px instead of 400 x 400: 1.86 MB
3. Pick the format by measuring it
The radar palette is 14 flat colours plus text, which suits lossless formats. Write the full frames in each format:
FRAMES[0].save("data/loop.webp", save_all=True, append_images=FRAMES[1:], duration=100, loop=0, lossless=True, method=6)
with imageio.get_writer("data/loop.mp4", format="FFMPEG", fps=10, codec="libx264", quality=7, macro_block_size=2) as w:
    for f in FRAMES:
        w.append_data(np.asarray(f))
for name in ("loop.webp", "loop.mp4"):
    print(f"{name:10s}: {Path('data', name).stat().st_size / 1e6:.2f} MB")
loop.webp : 2.68 MB
loop.mp4 : 6.90 MB
4. Combine the levers that cost nothing
Cropping removes only what the reader did not need, and lossless WebP loses nothing. Together:
houston[0].save("data/houston.webp", save_all=True, append_images=houston[1:], duration=100, loop=0, lossless=True, method=6)
both = Path("data/houston.webp").stat().st_size / 1e6
print(f"cropped + lossless WebP: {both:.2f} MB, {base / both:.0f}x smaller than the baseline GIF, all {len(houston)} frames kept")
cropped + lossless WebP: 1.11 MB, 3x smaller than the baseline GIF, all 95 frames kept
What changes between radar frames
The data used on this page
NEXRAD Level III base reflectivity (N0B) from the Houston radar, KHGX, 08:00–10:59 UTC on 8 July 2024 as Hurricane Beryl came ashore, from the Unidata Level III archive on AWS, resampled to a 1 km grid and drawn with the National Weather Service reflectivity colours.
import re
import warnings
from pathlib import Path

import imageio.v2 as imageio
import matplotlib
matplotlib.use("Agg")
import matplotlib.pyplot as plt
import numpy as np
import pandas as pd
import requests
from matplotlib.colors import BoundaryNorm, ListedColormap
from metpy.io import Level3File
from PIL import Image, ImageDraw

warnings.filterwarnings("ignore")
Path("data/l3").mkdir(parents=True, exist_ok=True)
L3 = "https://unidata-nexrad-level3.s3.amazonaws.com/"
keys = []
for hour in ("08", "09", "10"):
    keys += re.findall(r"<Key>([^<]+)</Key>", requests.get(L3, params={"list-type": 2, "prefix": f"HGX_N0B_2024_07_08_{hour}_"}, timeout=60).text)
SCANS = []
for key in keys:
    path = Path("data/l3", key)
    if not path.exists():
        path.write_bytes(requests.get(L3 + key, timeout=60).content)
    try:
        f = Level3File(str(path)); d = f.sym_block[0][0]
        z = np.array(f.map_data(d["data"]), float)[np.argsort(d["start_az"])]
    except Exception:
        continue
    if z.shape[0] == 720:
        SCANS.append((pd.Timestamp(f.metadata["prod_time"]), z))
SCANS.sort(key=lambda s: s[0])

c = np.arange(-229.5, 230, 1.0)                                          # 1 km pixel centres, km from the radar
X, Y = np.meshgrid(c, c[::-1])
AI = np.clip((np.degrees(np.arctan2(X, Y)) % 360 / 0.5).astype(int), 0, 719)
RI_raw = (np.hypot(X, Y) / 0.25).astype(int)
VALID, RI = RI_raw < 1840, np.clip(RI_raw, 0, 1839)
NWS = ["#04e9e7", "#019ff4", "#0300f4", "#02fd02", "#01c501", "#008e00", "#fdf802", "#e5bc00",
       "#fd9500", "#fd0000", "#d40000", "#bc0000", "#f800fd", "#9854c6"]
CMAP, NORM = ListedColormap(NWS), BoundaryNorm(np.arange(5, 76, 5), len(NWS))


def render(grid, when):
    fig = plt.figure(figsize=(4, 4), dpi=100)
    ax = fig.add_axes([0, 0, 1, 1]); ax.set_axis_off()
    ax.imshow(np.where(grid >= 5, grid, np.nan), cmap=CMAP, norm=NORM, interpolation="nearest")
    ax.text(0.03, 0.96, f"KHGX {when:%H:%M} UTC", transform=ax.transAxes, fontsize=9, va="top")
    fig.canvas.draw(); im = Image.fromarray(np.asarray(fig.canvas.buffer_rgba())).convert("RGB")
    plt.close(fig)
    return im


FRAMES = [render(np.where(VALID, z[AI, RI], np.nan), t) for t, z in SCANS]
print(f"{len(SCANS)} scans, {SCANS[0][0]:%H:%M}–{SCANS[-1][0]:%H:%M} UTC, rendered at {FRAMES[0].size}")
95 scans, 08:01–10:59 UTC, rendered at (400, 400)
Example 1: what changes between frames
a = np.stack([np.asarray(f) for f in FRAMES])
changed = (a[1:] != a[:-1]).any(axis=-1).mean(axis=(1, 2))
print(f"pixels that change from one frame to the next: median {np.median(changed):.1%}, max {changed.max():.1%}")
pixels that change from one frame to the next: median 29.9%, max 36.2%
Compression stores what is hard to predict
A compressed animation stores what is hard to predict. Flat areas, repeated colours and pixels that do not change between frames cost almost nothing; edges, noise and change cost a lot. That is why cutting pixels nobody needs is the first lever: every frame gets cheaper, and the story is untouched. Dropping frames and shrinking the drawing also save bytes, but they remove information: half the scans make the storm jump, and smaller frames blur the bands.
The format then decides how well the remaining frames compress. Here lossless WebP was 14% smaller than GIF and lost nothing, while MP4 was more than twice the size of the GIF: a video codec spends bytes on 14 flat colours and sharp edges it was not designed for. About 30% of the pixels change from one scan to the next, so no format can lean on frames repeating. On imagery and smooth gradients the order can reverse. The measurement in step 3 is the step that matters: writing the frames a few ways takes seconds, and the numbers often contradict the rule of thumb.
Lossy GIF, static backgrounds and browser support
- Lossy GIF tools (gifsicle
--lossy) can cut GIF size further at the cost of speckle; measure them like any other lever. - Frame timing: dropping every other frame must double the delay, or the storm moves twice as fast.
- Text and timestamps change every frame; a small label in a corner costs little, a large one costs more. Cropping can remove them, so check the cropped frames.
- Static background (basemap, labels) can be served as a separate image under a transparent animation, so it is downloaded once.
- Browser support: animated WebP plays in all current major browsers; check older targets before relying on it.
Internal links
- How to make a radar loop animation — where these frames come from
- How to export a map animation — format comparison on smooth and classed frames
FAQ
How do I make my animated GIF smaller?
Crop to the area of interest first; here that alone cut the file by 59%. Then compare formats. Dropping frames and pixels also helps but loses information.
Is WebP smaller than GIF for animations?
For these flat-colour radar frames, lossless WebP was 14% smaller than GIF. Lossy WebP at quality 80 was larger than GIF in an earlier comparison on the same loop, so measure the mode you will use.
Why is my MP4 animation larger than the GIF?
Video codecs are built for photographs; on flat colours with sharp edges they can lose to lossless formats. Measure both.
How many frames per second does a map animation need?
As few as show the motion smoothly; here one radar scan per frame at 10 frames per second plays three hours in under ten seconds.