
How to Make a Before-and-After Swipe Map in Python
On this page
Problem statement
A swipe map stacks two images of the same place and lets the reader drag a divider between them: before on one side, after on the other. It is the clearest way to show what a flood, fire or construction project changed, because the eye compares the same pixels across the line. Building one honestly takes three things. Both images must be on the same grid. They must be stretched to the same brightness scale, or unchanged ground will look changed. And the divider must reveal exactly the image it claims to. The last can be checked in a browser.
This page builds a swipe map of Lahaina, Maui, from Sentinel-2 images taken five days before and five days after the fire of 8 August 2023, and measures the burned area.
Quick answer
Read the same window from both scenes, stretch them with one set of limits, save two PNGs, and stack them in HTML with a range input that clips the top image:
lo, hi = np.percentile(np.concatenate([before_rgb.ravel(), after_rgb.ravel()]), [2, 98])   # one stretch for both
for name, rgb in (("before", before_rgb), ("after", after_rgb)):
    iio.imwrite(f"data/{name}.png", to_png(rgb, lo, hi))
html = """<!doctype html><meta charset="utf-8"><title>Lahaina, before and after</title><style>body{margin:0}</style>
<div id="swipe" style="position:relative;width:Wpx;height:Hpx">
  <img src="after.png" style="position:absolute;left:0;top:0" alt="Lahaina on 13 August 2023, after the fire">
  <img id="before" src="before.png" style="position:absolute;left:0;top:0;clip-path:inset(0 50% 0 0)" alt="Lahaina on 3 August 2023">
</div>
<input id="pos" type="range" min="0" max="100" value="50" style="width:Wpx" aria-label="Swipe position">
<script>
  const pos = document.getElementById("pos"), upper = document.getElementById("before");
  pos.oninput = () => upper.style.clipPath = `inset(0 ${100 - pos.value}% 0 0)`;
</script>""".replace("Wpx", f"{W}px").replace("Hpx", f"{H}px")
Path("data/swipe.html").write_text(html)
print(f"{W} x {H} px images, stretch {lo:.0f}–{hi:.0f} (reflectance x 10,000), {len(html):,} bytes of HTML")
632 x 563 px images, stretch 299–1854 (reflectance x 10,000), 722 bytes of HTML
Two clear scenes, one grid, one stretch, a browser test
1. Find two clear scenes
Search a STAC catalogue for Sentinel-2 scenes over the place, and pick dates that bracket the event with little cloud. The Earth Search catalogue indexes the open Sentinel-2 archive on AWS:
items = requests.post("https://earth-search.aws.element84.com/v1/search", timeout=60, json={
    "collections": ["sentinel-2-l2a"], "intersects": {"type": "Point", "coordinates": [-156.677, 20.875]},
    "datetime": "2023-07-25T00:00:00Z/2023-08-20T00:00:00Z", "limit": 20}).json()["features"]
for it in sorted(items, key=lambda i: i["properties"]["datetime"]):
    print(it["id"], f"scene cloud {it['properties']['eo:cloud_cover']:.0f}%")
S2B_4QGJ_20230729_0_L2A scene cloud 18%
S2A_4QGJ_20230803_0_L2A scene cloud 6%
S2B_4QGJ_20230808_0_L2A scene cloud 8%
S2A_4QGJ_20230813_0_L2A scene cloud 7%
S2B_4QGJ_20230818_0_L2A scene cloud 9%
Scene cloud cover is for the whole 110 km tile. Check the window itself with the scene classification layer (SCL):
for name, scl in (("before", SCL_BEFORE), ("after", SCL_AFTER)):
    print(f"{name}: cloud or shadow in {np.isin(scl, [3, 8, 9, 10]).mean():.1%} of the window")
before: cloud or shadow in 0.1% of the window
after: cloud or shadow in 0.0% of the window
2. Put both on one grid
The two scenes come from the same Sentinel-2 tile (4QGJ), so the same window gives the same pixels. Check rather than assume:
print("same CRS:", META["before"]["crs"] == META["after"]["crs"], "| same transform:", META["before"]["transform"] == META["after"]["transform"],
      "| shape", before_rgb.shape)
same CRS: True | same transform: True | shape (563, 632, 3)
Scenes from different tiles or sensors need resampling onto one grid (rasterio.warp.reproject) before they can be swiped.
3. Stretch both images the same way
Sentinel-2 reflectance has to be stretched to look natural. Stretch each image to its own 2nd–98th percentiles and the dark burn scar pulls the after image's lower limit down, so its stretch brightens everything, including unburned ground. Compare the limits, and the brightness change on land the fire did not touch:
unburned = (DNBR < 0.05) & LAND
for label, lims in (("shared stretch", ((lo, hi), (lo, hi))),
                    ("separate stretches", (np.percentile(before_rgb, [2, 98]), np.percentile(after_rgb, [2, 98])))):
    b, a = (to_png(img, *l).astype(float).mean(axis=2) for img, l in zip((before_rgb, after_rgb), lims))
    print(f"{label:19s}: limits {[f'{x:.0f}–{y:.0f}' for x, y in lims]}, unburned land changes brightness by {np.mean(a[unburned] - b[unburned]):+.1f} of 255")
shared stretch : limits ['299–1854', '299–1854'], unburned land changes brightness by +4.9 of 255
separate stretches : limits ['318–1852', '290–1860'], unburned land changes brightness by +6.7 of 255
Even with one stretch, unburned land is a little brighter after: ten more days of dry season, and different light. That change is in the data. Separate stretches add more on top that is not, and nothing on the map would tell the two apart.
4. Test the swipe in a browser
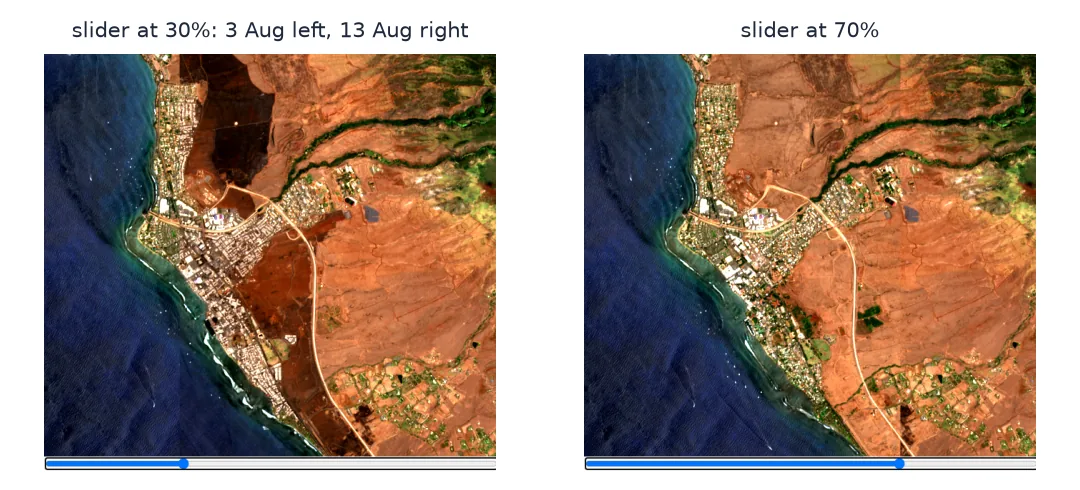
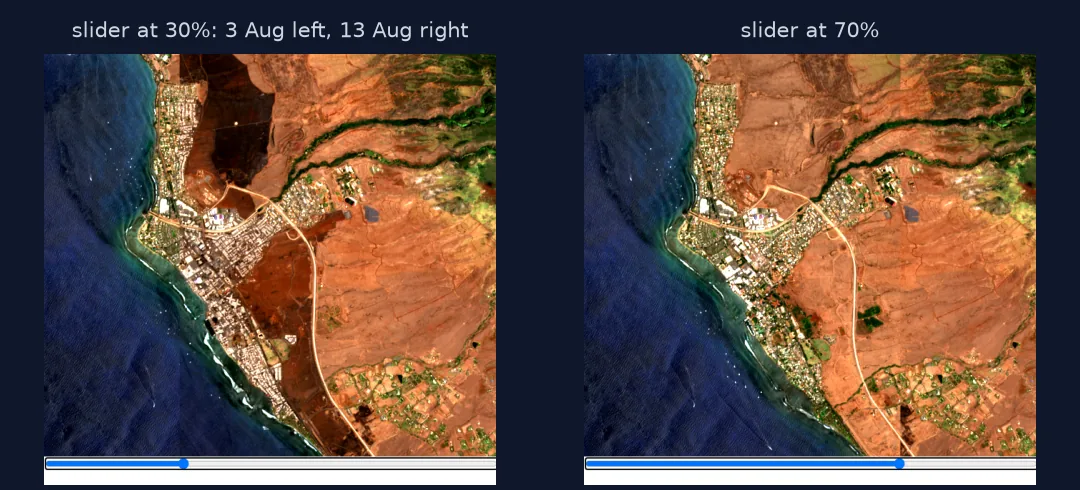
The HTML is a few lines, and that is exactly where small mistakes hide. The first version of this page gave the top image id="top" and the script used it as top.style. In a browser, top is already taken: it is window.top, the outermost window, so the slider did nothing and the divider stayed at 50%. It looked fine at a glance. The test below caught it. Open the page in headless Chromium, move the slider, and compare screen pixels with the two PNGs on each side of the divider:
from playwright.sync_api import sync_playwright

png = {n: iio.imread(f"data/{n}.png")[..., :3] for n in ("before", "after")}
with sync_playwright() as p:
    browser = p.chromium.launch()
    page = browser.new_page(viewport={"width": W, "height": H + 40})
    page.goto(Path("data/swipe.html").resolve().as_uri()); page.wait_for_timeout(1000)
    for v in (30, 70):
        page.fill("#pos", str(v)); page.dispatch_event("#pos", "input"); page.wait_for_timeout(300)
        shot = iio.imread(page.screenshot(clip={"x": 0, "y": 0, "width": W, "height": H}))[..., :3]
        split = int(W * v / 100)
        left_ok = np.array_equal(shot[:, : split - 1], png["before"][:, : split - 1])
        right_ok = np.array_equal(shot[:, split + 1 :], png["after"][:, split + 1 :])
        print(f"slider at {v}%: left of x={split} is 'before' {left_ok}, right is 'after' {right_ok}")
        page.screenshot(path=f"data/swipe_{v}.png")
    browser.close()
slider at 30%: left of x=189 is 'before' True, right is 'after' True
slider at 70%: left of x=442 is 'before' True, right is 'after' True
5. Measure what changed
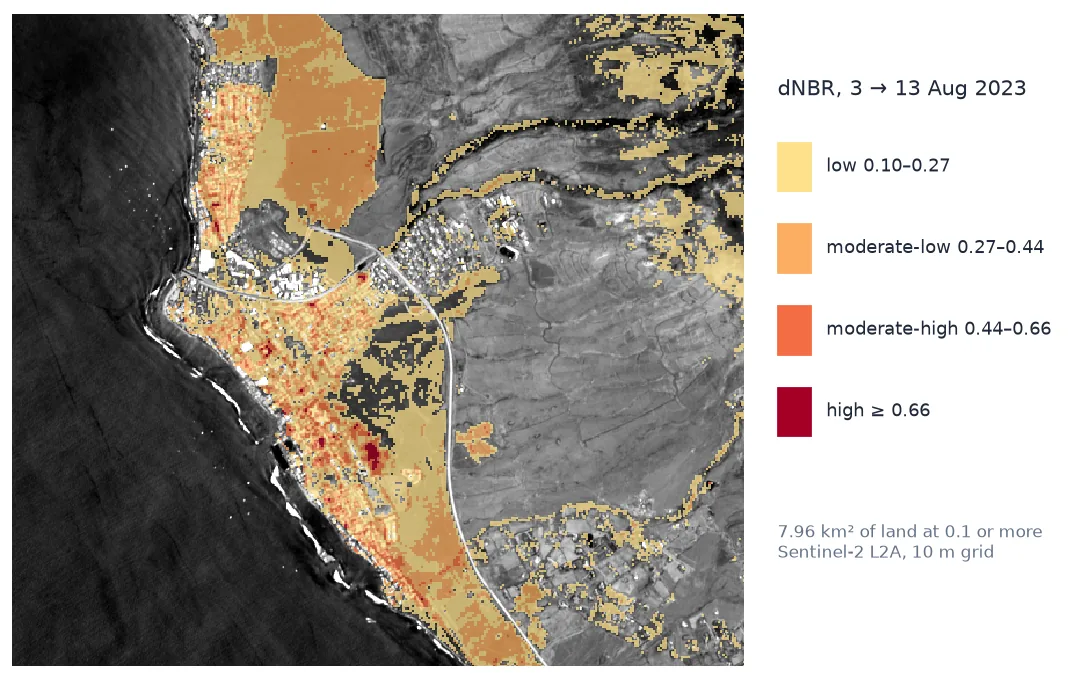
A swipe shows change; a burn index measures it. The normalised burn ratio, NBR = (NIR − SWIR) / (NIR + SWIR), falls sharply when vegetation and buildings burn. The drop from before to after (dNBR) is the standard measure:
bins = [0.1, 0.27, 0.44, 0.66, np.inf]
names = ["low", "moderate-low", "moderate-high", "high"]
cells = [((DNBR >= a) & (DNBR < b) & LAND).sum() for a, b in zip(bins[:-1], bins[1:])]
for n, c in zip(names, cells):
    print(f"{n:14s}: {c * 100 / 1e6:5.2f} km²")
print(f"dNBR >= 0.1 on land: {sum(cells) * 100 / 1e6:.2f} km² of {LAND.sum() * 100 / 1e6:.2f} km² of land in the window")
low : 4.93 km²
moderate-low : 2.68 km²
moderate-high : 0.32 km²
high : 0.03 km²
dNBR >= 0.1 on land: 7.96 km² of 23.27 km² of land in the window
The thresholds are the commonly used Key and Benson severity classes, developed for wildland vegetation. Over a town they mark where the surface changed, not a calibrated severity. The low class also catches scattered strips on the dry hills east of town, which may be grass drying out over ten days rather than fire. Read 7.96 km² as an upper bound, and the 3.03 km² at moderate-low or worse as the core of the burn.
A static split and the fire morning's scene
The data used on this page
Sentinel-2 L2A scenes S2A_4QGJ_20230803 and S2A_4QGJ_20230813 (Copernicus data, 2023) read as cloud-optimised GeoTIFFs from the Earth Search catalogue; a window about 6 km across centred on Lahaina.
from pathlib import Path

import imageio.v3 as iio
import numpy as np
import rasterio
import requests
from rasterio.warp import transform_bounds
from rasterio.enums import Resampling
from rasterio.windows import from_bounds

Path("data").mkdir(exist_ok=True)
SCENES = {"before": "S2A_4QGJ_20230803_0_L2A", "after": "S2A_4QGJ_20230813_0_L2A"}
BOUNDS = (-156.70, 20.855, -156.64, 20.905)                        # lon/lat box around Lahaina
META = {}


def band(scene, b):
    """One band over BOUNDS, on the 10 m grid of the scene's red band (20 m bands are repeated 2 x 2)."""
    f = Path(f"data/{scene}_{b}.tif")
    if not f.exists():
        item = requests.get(f"https://earth-search.aws.element84.com/v1/collections/sentinel-2-l2a/items/{SCENES[scene]}", timeout=60).json()
        with rasterio.open(item["assets"]["red"]["href"]) as ref:
            win = from_bounds(*transform_bounds(4326, ref.crs, *BOUNDS), ref.transform).round_offsets().round_lengths()
            grid = {"crs": ref.crs, "transform": ref.window_transform(win), "width": win.width, "height": win.height}
            box = rasterio.windows.bounds(win, ref.transform)
        with rasterio.open(item["assets"][b]["href"]) as r:
            data = r.read(1, window=from_bounds(*box, r.transform), out_shape=(grid["height"], grid["width"]),
                          resampling=Resampling.nearest)
            with rasterio.open(f, "w", driver="GTiff", count=1, dtype=r.dtypes[0], **grid) as out:
                out.write(data, 1)
    with rasterio.open(f) as r:
        if b == "red":
            META[scene] = {"crs": r.crs, "transform": r.transform}
        return r.read(1).astype(float)


def rgb(scene):
    return np.dstack([band(scene, b) for b in ("red", "green", "blue")])


def to_png(img, lo, hi):
    return (np.clip((img - lo) / (hi - lo), 0, 1) * 255).astype(np.uint8)


before_rgb, after_rgb = rgb("before"), rgb("after")
H, W = before_rgb.shape[:2]
SCL_BEFORE, SCL_AFTER = band("before", "scl"), band("after", "scl")
nbr = lambda s: (band(s, "nir08") - band(s, "swir22")) / (band(s, "nir08") + band(s, "swir22"))
DNBR = nbr("before") - nbr("after")
LAND = (SCL_BEFORE != 6) & (SCL_AFTER != 6)                           # SCL 6 = water
print(f"{W} x {H} pixels at 10 m; NIR, SWIR and SCL (20 m) repeated onto the same grid")
632 x 563 pixels at 10 m; NIR, SWIR and SCL (20 m) repeated onto the same grid
Example 1: a static split image for print
split = W // 2
both = to_png(before_rgb, lo, hi).copy()
both[:, split:] = to_png(after_rgb, lo, hi)[:, split:]
both[:, split - 1 : split + 1] = 255                                  # the divider
iio.imwrite("data/split.png", both)
print("split image", both.shape, "divider at x =", split)
split image (563, 632, 3) divider at x = 316
Example 2: the scene from the morning of the fire
SCENES["fireday"] = "S2B_4QGJ_20230808_0_L2A"
d8 = nbr("before") - nbr("fireday")
land8 = LAND & (band("fireday", "scl") != 6)
print(f"dNBR >= 0.1 on land: 3 to 8 Aug {((d8 >= 0.1) & land8).sum() * 100 / 1e6:.2f} km², 3 to 13 Aug {((DNBR >= 0.1) & LAND).sum() * 100 / 1e6:.2f} km²")
dNBR >= 0.1 on land: 3 to 8 Aug 0.84 km², 3 to 13 Aug 7.96 km²
Two images and a divider
A swipe map is two images and a mask, but it is only as honest as the two images are comparable. Same grid means the divider crosses the same ground on both sides. Same stretch means a brightness difference across the divider is a real difference in reflectance, not a different contrast setting. Here separate stretches made unburned land brighter by 6.7 levels instead of 4.9. The extra was a contrast setting, and the reader would have seen it as change.
The browser test is cheap insurance, and here it paid for itself: an element id that shadowed window.top left the slider dead while the page still looked right. clip-path: inset() also takes its values in a top-right-bottom-left order that is easy to get backwards, and a backwards clip shows the after image under the before label. Comparing screen pixels with the source PNGs on each side of the divider proves the swipe shows what it says. The dNBR numbers then turn the visual impression into an area, with the caveat that severity classes built for forests are only a guide in a town.
Different sensors, sun angles and smoke
- Different tiles or sensors: reproject one image onto the other's grid before stretching.
- Different sun angles between dates change shadows; pick dates close together, as here (ten days apart).
- Clouds and smoke: check the SCL layer inside the window, not just the scene cloud cover.
- Large areas: serve both images as tiles and use
leaflet-side-by-side(folium'sSideBySideLayers) instead of two PNGs. - Page margin: browsers put 8 px around the body by default; set
body { margin: 0 }or the pixel test (and any overlay you position) is off by 8 px. - Accessibility: the range input needs a label; give both images alt text that says what changed.
- Same-day imagery: the 8 August 2023 scene was taken at 11:09 local time, before the fire reached most of the town (Example 2), so it is not the "after" image.
Internal links
- How to make a time-slider web map — many dates instead of two
- How to make small-multiple maps — side-by-side comparison for print
FAQ
How do I make a before-and-after slider map?
Save the two images on the same grid with the same stretch, stack them in HTML, and clip the top image with clip-path: inset() driven by a range input; for tiled maps use leaflet-side-by-side.
Why does my after image look brighter everywhere?
Each image was contrast-stretched separately. Compute one set of stretch limits from both images and apply it to both.
Where can I get before-and-after satellite images?
Sentinel-2 (10 m, every few days) and Landsat (30 m) are free; search them through a STAC API such as Earth Search and read just the window you need from the cloud-optimised GeoTIFFs.
How do I measure a burned area from satellite images?
Compute NBR from near-infrared and shortwave-infrared bands before and after the fire, subtract, and threshold the difference (dNBR), excluding water and cloud.