
Fixing a Folium Map That Is Slow With Many Markers
On this page
Problem statement
A Folium map with a few hundred markers is instant. With tens of thousands it takes long to build in Python, makes a heavy HTML file, and opens in the browser slowly or not at all, with panning that stutters. The cause is that every folium.Marker becomes its own JavaScript statement in the page and its own element in the browser, each with an icon image and a shadow.
This page puts all 25,081 open US airports, airstrips and heliports from OurAirports on a Folium map in six ways, from a plain loop of markers to clustering, canvas-drawn circles and a heatmap. It measures the HTML size and the number of elements the browser creates for each, and picks the fix for each kind of map.
Quick answer
For many points, do not add a Marker per row. FastMarkerCluster keeps both the file and the browser light:
from folium.plugins import FastMarkerCluster
m = folium.Map(location=[39, -98], zoom_start=4)
FastMarkerCluster(US[["latitude_deg", "longitude_deg"]].values.tolist()).add_to(m)
m.save("data/fast.html")
print(f"{len(US):,} points; HTML {Path('data/fast.html').stat().st_size / 1e6:.2f} MB")
25,081 points; HTML 0.76 MB
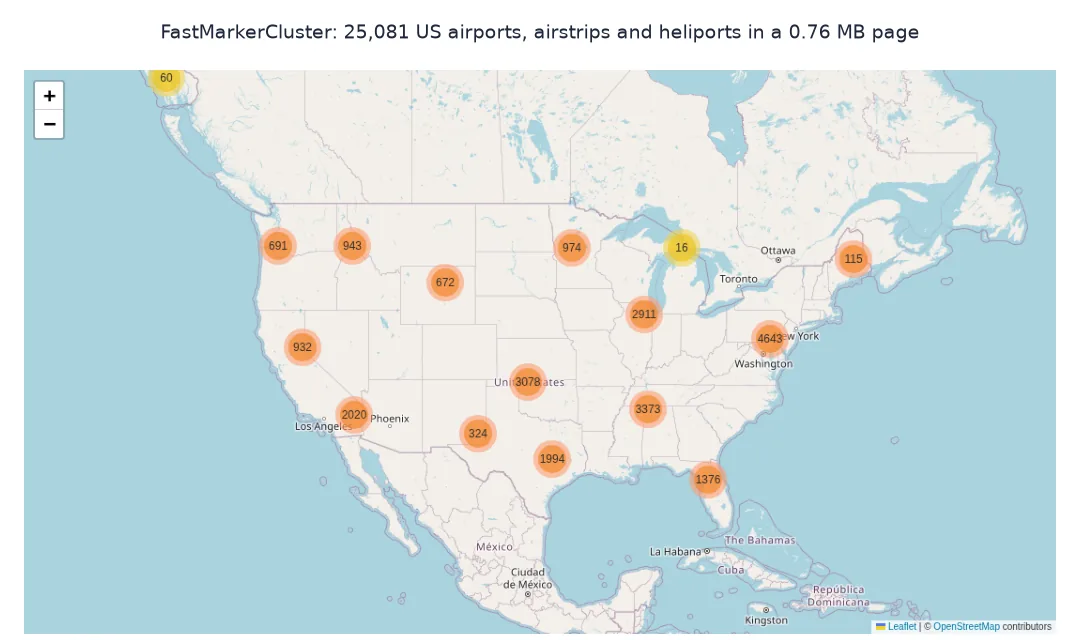
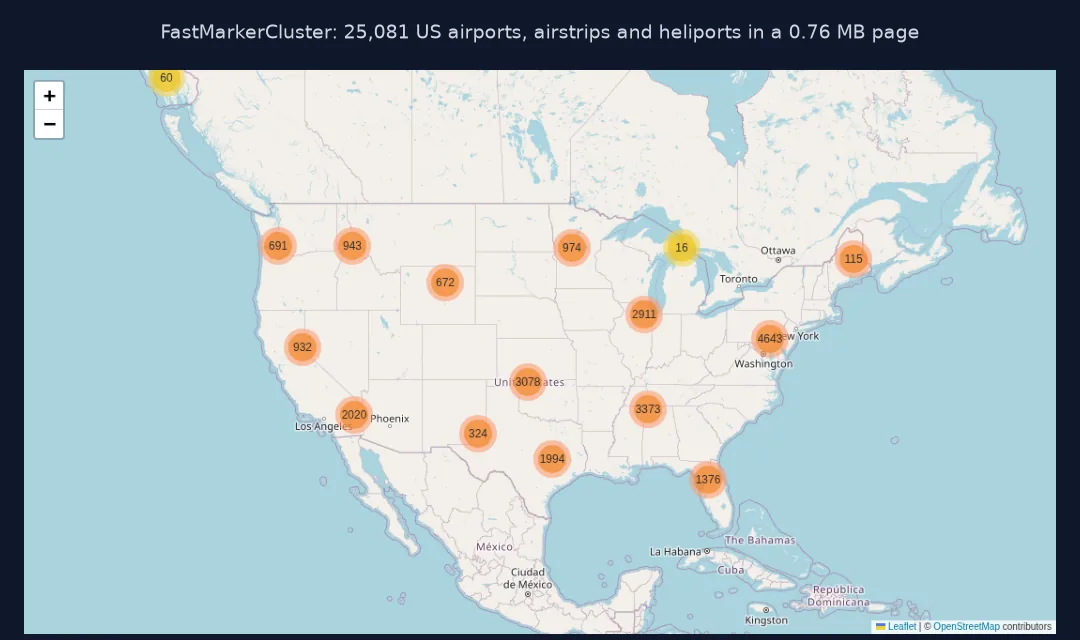
FastMarkerCluster writes all 25,081 points into a 0.76 MB page.
Measure the slow map, compare six ways, pick the fix
1. Measure the slow version
Build the naive map, one Marker per row, and measure the file:
m0 = folium.Map(location=[39, -98], zoom_start=4)
for lat, lon in US[["latitude_deg", "longitude_deg"]].values:
    folium.Marker([lat, lon]).add_to(m0)
m0.save("data/markers.html")
print(f"one Marker per row: HTML {Path('data/markers.html').stat().st_size / 1e6:.2f} MB, {m0.get_root().render().count('L.marker('):,} L.marker calls")
one Marker per row: HTML 5.20 MB, 25,081 L.marker calls
One Marker per row writes 25,081 separate L.marker calls, a 5.20 MB page, almost seven times the size.
2. Compare six ways
Save the same points as circle markers drawn as SVG, circle markers on a canvas, a MarkerCluster and a heatmap, next to the two pages above:
from folium.plugins import HeatMap, MarkerCluster
pts = US[["latitude_deg", "longitude_deg"]].values.tolist()
def new_map(**kw):
    return folium.Map(location=[39, -98], zoom_start=4, **kw)
for name, kw in (("circles_svg.html", {}), ("circles_canvas.html", {"prefer_canvas": True})):
    m = new_map(**kw)
    for p in pts:
        folium.CircleMarker(p, radius=2, weight=0, fill=True, fill_opacity=0.7).add_to(m)
    m.save(f"data/{name}")
m = new_map(); mc = MarkerCluster().add_to(m)
for p in pts:
    folium.Marker(p).add_to(mc)
m.save("data/cluster.html")
m = new_map(); HeatMap(pts, radius=4, blur=3).add_to(m); m.save("data/heat.html")
PAGES = ["markers.html", "circles_svg.html", "circles_canvas.html", "cluster.html", "fast.html", "heat.html"]
for f in PAGES:
    print(f"{f:>19}: {Path('data/' + f).stat().st_size / 1e6:5.2f} MB")
markers.html: 5.20 MB
circles_svg.html: 12.17 MB
circles_canvas.html: 12.17 MB
cluster.html: 5.47 MB
fast.html: 0.76 MB
heat.html: 0.76 MB
Circle markers make the largest files, 12.17 MB, whether drawn as SVG or on a canvas, because each circle's options are written out in full. MarkerCluster is 5.47 MB. FastMarkerCluster and the heatmap are the smallest at 0.76 MB, because they store the coordinates as one array.
3. Pick the fix
| Map | Use |
|---|---|
| a few hundred points with popups | plain Marker |
| thousands of points, popups needed | MarkerCluster |
| tens of thousands, location matters more than detail | FastMarkerCluster (smallest file) |
| every point visible at once | CircleMarker with prefer_canvas=True, accepting a large file |
| density is the message | HeatMap |
| hundreds of thousands or more | aggregate first, or lonboard |
Elements in the browser
The data used on this page
Every open airport, airstrip, heliport and seaplane base in the United States from OurAirports, a public-domain database. Pages are measured in headless Chromium with Playwright.
from pathlib import Path

import folium
import pandas as pd
import requests

Path("data").mkdir(exist_ok=True)
p = Path("data/airports.csv")
if not p.exists():
    r = requests.get("https://davidmegginson.github.io/ourairports-data/airports.csv", timeout=300)
    r.raise_for_status()
    p.write_bytes(r.content)
A = pd.read_csv(p, keep_default_na=False, na_values=[""])
US = A[(A.iso_country == "US") & (A.type != "closed")].reset_index(drop=True)
print(f"{len(US):,} open places in the US")
25,081 open places in the US
OurAirports lists 25,081 open places in the US.
Example 1: elements in the browser
Open each page in headless Chromium and count what Leaflet created: marker images and their shadows, SVG paths, canvases and cluster bubbles:
import functools, http.server, socketserver, threading
from playwright.sync_api import sync_playwright
COUNT = """() => { const q = s => document.querySelectorAll(s).length;
  return [q('img.leaflet-marker-icon'), q('img.leaflet-marker-shadow'), q('.leaflet-overlay-pane path'), q('.leaflet-overlay-pane canvas, .leaflet-heatmap-layer'), q('.marker-cluster')]; }"""
class Quiet(http.server.SimpleHTTPRequestHandler):
    def log_message(self, *a): pass
srv = socketserver.TCPServer(("127.0.0.1", 0), functools.partial(Quiet, directory="data"))
threading.Thread(target=srv.serve_forever, daemon=True).start()
with sync_playwright() as pw:
    browser = pw.chromium.launch()
    for f in PAGES:
        page = browser.new_page(viewport={"width": 1000, "height": 600})
        page.goto(f"http://127.0.0.1:{srv.server_address[1]}/{f}", timeout=300000)
        page.wait_for_timeout(4000)
        icons, shadows, paths, canvases, bubbles = page.evaluate(COUNT)
        print(f"{f:>19}: {icons:>6,} marker images, {shadows:>6,} shadows, {paths:>6,} SVG paths, {canvases} canvas, {bubbles} cluster bubbles")
        page.close()
    browser.close()
srv.shutdown()
markers.html: 25,081 marker images, 25,081 shadows, 0 SVG paths, 0 canvas, 0 cluster bubbles
circles_svg.html: 0 marker images, 0 shadows, 25,081 SVG paths, 0 canvas, 0 cluster bubbles
circles_canvas.html: 0 marker images, 0 shadows, 0 SVG paths, 1 canvas, 0 cluster bubbles
cluster.html: 1 marker images, 1 shadows, 0 SVG paths, 0 canvas, 30 cluster bubbles
fast.html: 0 marker images, 0 shadows, 0 SVG paths, 0 canvas, 30 cluster bubbles
heat.html: 0 marker images, 0 shadows, 0 SVG paths, 1 canvas, 0 cluster bubbles
The plain markers create 25,081 icon images and 25,081 shadows, 50,162 images for the browser to position on every pan and zoom. SVG circles create 25,081 paths, while the canvas version and the heatmap draw everything on a single canvas. Both clustering plugins show 30 bubbles at zoom 4, and MarkerCluster one lone marker that falls in no cluster.
Every Leaflet marker is two images
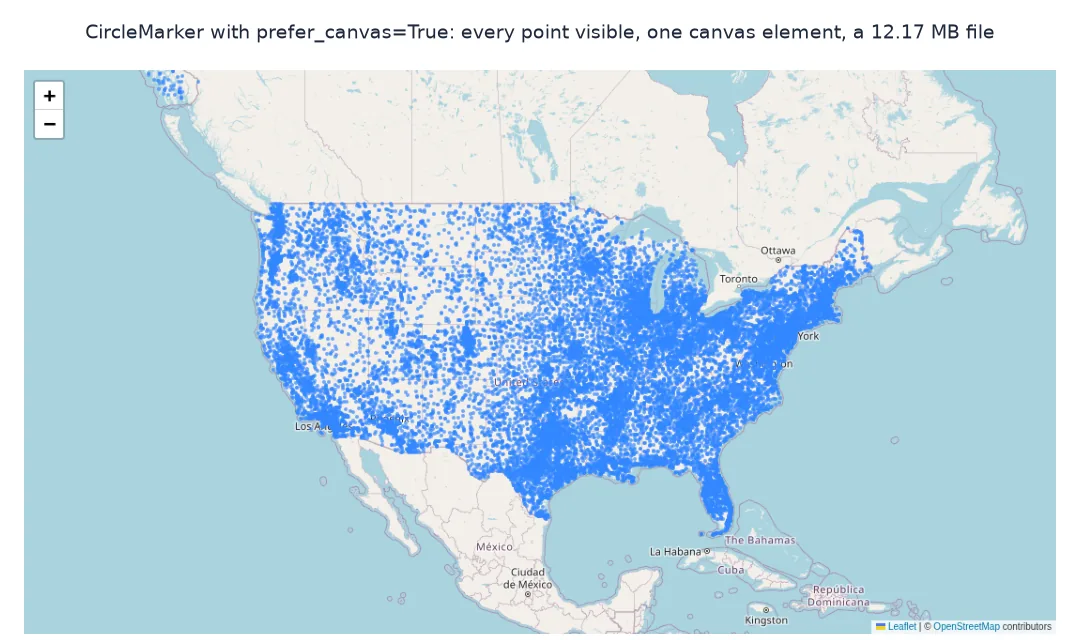
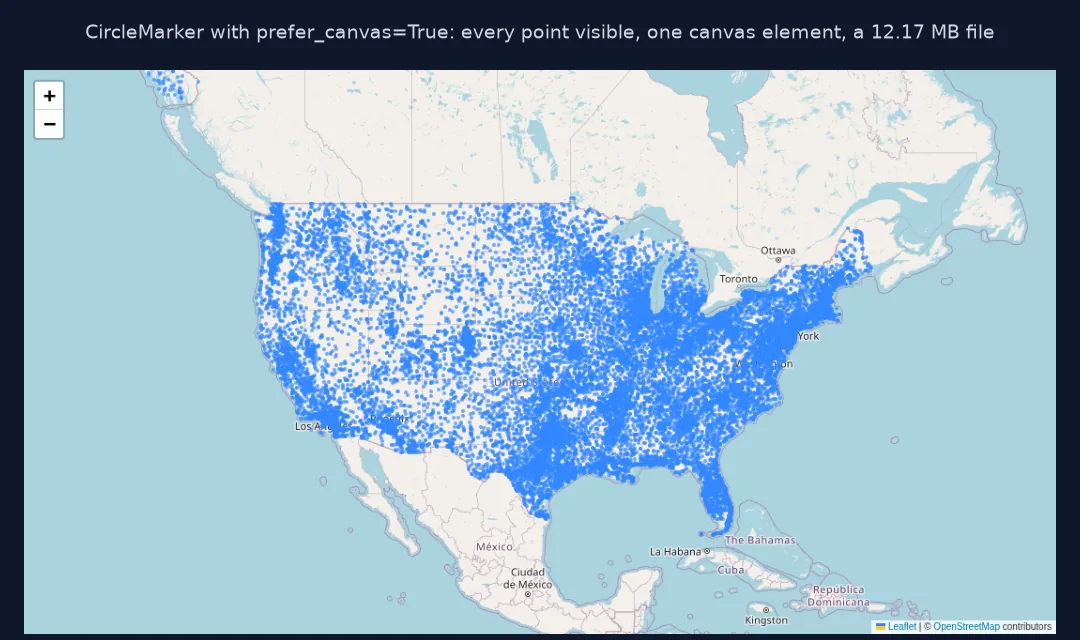
Leaflet represents each Marker as an <img> element for the icon plus another for its shadow, positioned by the browser on every pan and zoom. Twenty-five thousand markers mean fifty thousand images to lay out, which is what makes the page slow; the HTML file is large for the same reason, because Folium writes a separate JavaScript statement with its own options for every marker. CircleMarker draws vector shapes instead of images, one SVG path each by default. With prefer_canvas=True all of them are painted onto a single canvas, so the browser keeps one element instead of thousands. The file does not shrink, though: Folium still writes a statement per circle, with more options than a plain marker.
Clustering reduces what is drawn rather than how: MarkerCluster still creates every marker in JavaScript but shows only cluster bubbles until you zoom in, and FastMarkerCluster also keeps the HTML small by storing the coordinates as one array. A heatmap draws everything onto one canvas and gives up individual points altogether. Which to choose depends on what the reader needs: individual places with details, the overall distribution, or both at different zoom levels.
Build time, popups and alternatives
- Building time in Python: the loop of 25,081
Markerobjects is slow in Python too; the vectorised plugins avoid it. - Popups with FastMarkerCluster: pass a JavaScript
callbackthat builds each marker and its popup from extra columns in the data. - GeoJson layers: a
folium.GeoJsonof points withmarker=folium.CircleMarker()writes the data once as GeoJSON, a middle ground for styled points. - Beyond Folium: lonboard sends binary data to the GPU and handles a million points.
Internal links
- How to cluster thousands of markers with Folium in Python — clustering in detail
- How to make a heatmap with Folium in Python — density instead of points
- How to map a million points with lonboard in Python — past Folium's limits
FAQ
Why is my Folium map so slow?
Each Marker is a separate JavaScript object and two images in the browser; tens of thousands of them overwhelm the page.
How many markers can Folium handle?
A few thousand plain markers comfortably; far more with FastMarkerCluster, canvas circle markers or a heatmap.
What does prefer_canvas do in Folium?
It makes Leaflet draw vector layers such as CircleMarker on one canvas instead of one SVG element each; it does not make the HTML file smaller.
How do I make a Folium map with many points load faster?
Use FastMarkerCluster or HeatMap, which keep the file small, or CircleMarker with prefer_canvas=True when every point must show, instead of one Marker per row.