
How to Cluster Thousands of Markers With Folium in Python
On this page
Problem statement
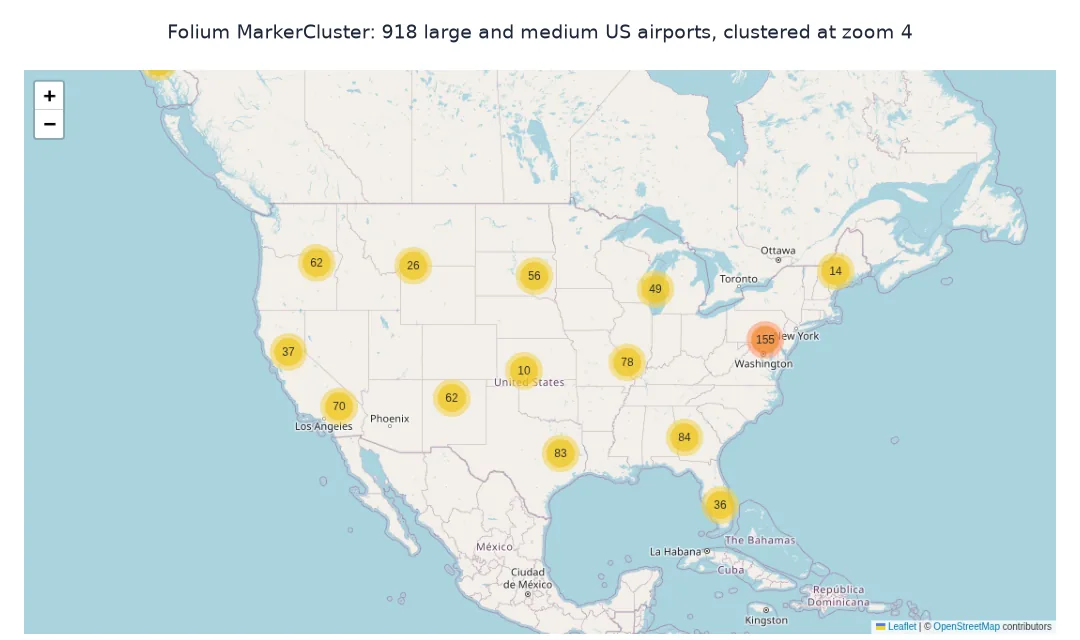
A Folium map with a marker for every one of the 25,000 airports, airstrips and heliports in the United States is unreadable and slow: the pins pile on top of each other and the browser struggles to draw them. Marker clustering groups nearby markers into a single bubble showing how many it contains, and splits them apart as you zoom in, which keeps the map legible at every scale. Folium offers two versions: MarkerCluster, which accepts full markers with popups, and FastMarkerCluster, which builds the markers in the browser and handles many more points.
This page clusters every open airport, airstrip and heliport in the United States from OurAirports, compares the two clustering plugins by the size of the HTML they produce, adds popups and custom icons, and limits clustering so individual markers appear from a chosen zoom level.
Quick answer
Add markers to a MarkerCluster instead of the map:
import folium
from folium.plugins import MarkerCluster
m = folium.Map(location=[39, -98], zoom_start=4)
mc = MarkerCluster(name="large and medium airports").add_to(m)
for _, r in LM.iterrows():
    folium.Marker([r.latitude_deg, r.longitude_deg], popup=f"{r['name']} ({r.ident})", tooltip=r.ident).add_to(mc)
m.save("data/us_airports_cluster.html")
print(f"markers: {len(LM):,}; HTML {Path('data/us_airports_cluster.html').stat().st_size / 1e6:.2f} MB")
markers: 918; HTML 0.91 MB
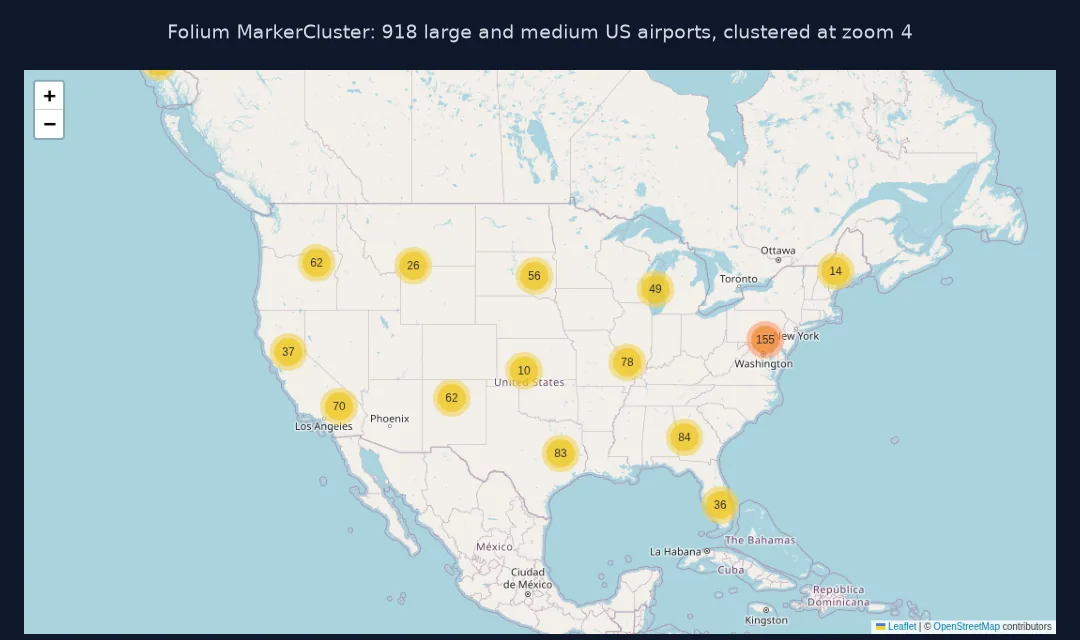
The 918 markers, each with a popup and a tooltip, make a 0.91 MB file, about 1 kB per marker.
MarkerCluster or FastMarkerCluster, popups, a zoom limit
1. MarkerCluster or FastMarkerCluster
MarkerCluster writes a JavaScript object for every marker; FastMarkerCluster writes one array of coordinates and a callback that builds the markers in the browser. Compare them on all US airfields:
from folium.plugins import FastMarkerCluster
for name, build in (("MarkerCluster", lambda mm: [folium.Marker([a, b]).add_to(mc2) for mc2 in [MarkerCluster().add_to(mm)] for a, b in US[["latitude_deg", "longitude_deg"]].values]),
                    ("FastMarkerCluster", lambda mm: FastMarkerCluster(US[["latitude_deg", "longitude_deg"]].values.tolist()).add_to(mm))):
    mm = folium.Map(location=[39, -98], zoom_start=4)
    build(mm)
    path = f"data/us_all_{name}.html"; mm.save(path)
    print(f"{name:>17}: {len(US):,} markers, HTML {Path(path).stat().st_size / 1e6:6.2f} MB")
MarkerCluster: 25,081 markers, HTML 5.47 MB
FastMarkerCluster: 25,081 markers, HTML 0.76 MB
For all 25,081 places, MarkerCluster writes a 5.47 MB page, while FastMarkerCluster writes 0.76 MB, seven times smaller, because it stores only the coordinates.
2. Popups and icons
Popups take HTML; icons can encode a category. Colour large and medium airports differently:
m2 = folium.Map(location=[39, -98], zoom_start=4)
mc = MarkerCluster().add_to(m2)
colours = {"large_airport": "red", "medium_airport": "blue"}
for _, r in LM.iterrows():
    html = f"<b>{r['name']}</b><br>{r.municipality}, {r.iso_region}<br>elevation {r.elevation_ft:,.0f} ft"
    folium.Marker([r.latitude_deg, r.longitude_deg], popup=folium.Popup(html, max_width=250),
                  icon=folium.Icon(color=colours[r.type], icon="plane", prefix="fa")).add_to(mc)
m2.save("data/us_airports_icons.html")
print(LM.type.value_counts().to_dict())
{'medium_airport': 823, 'large_airport': 95}
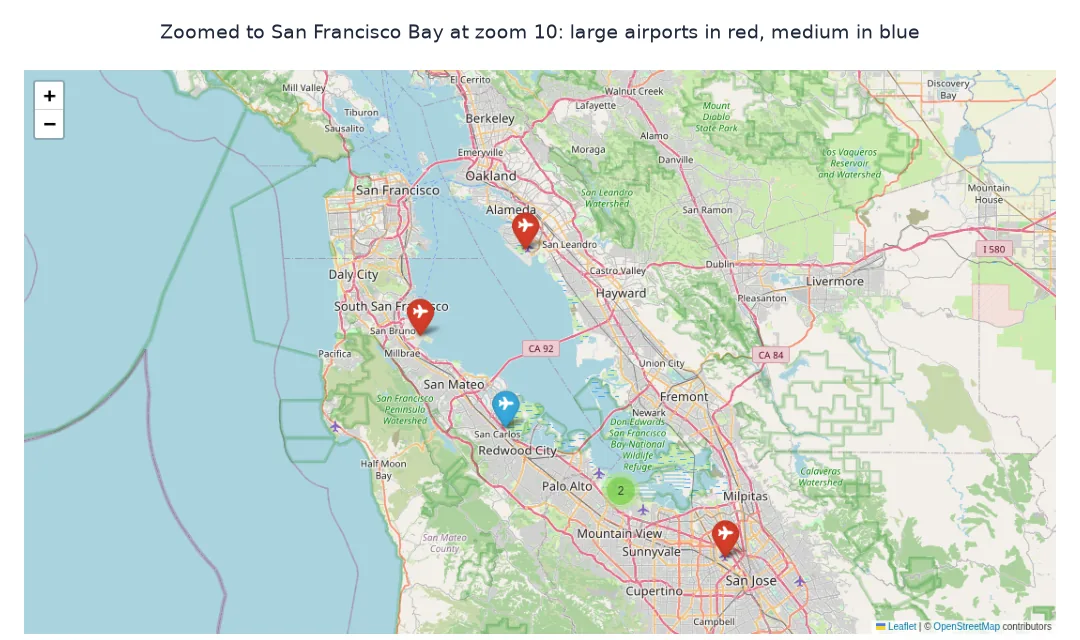
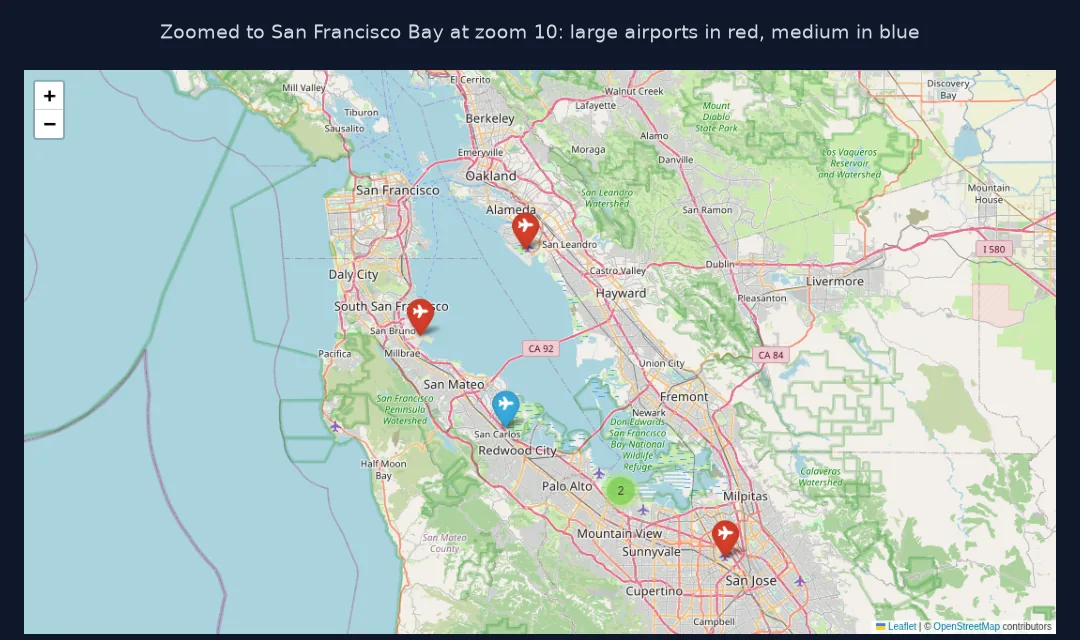
The map has 823 medium airports in blue and 95 large airports in red, each with an HTML popup giving its name, city, state and elevation.
3. Stop clustering at a zoom level
disableClusteringAtZoom shows individual markers once the user zooms in far enough; maxClusterRadius sets how far apart markers can be and still cluster:
m3 = folium.Map(location=[39, -98], zoom_start=4)
mc3 = MarkerCluster(options={"disableClusteringAtZoom": 9, "maxClusterRadius": 50}).add_to(m3)
for _, r in LM.iterrows():
    folium.CircleMarker([r.latitude_deg, r.longitude_deg], radius=4, color="#1a3a6b", fill=True, tooltip=r.ident).add_to(mc3)
m3.save("data/us_airports_zoom.html")
print(f"cluster options written to the page: {mc3.options}")
cluster options written to the page: {'disableClusteringAtZoom': 9, 'maxClusterRadius': 50}
Both options are written into the page as they were given: individual markers appear from zoom 9, and markers within 50 pixels of each other cluster. The plugin's default radius is 80 pixels.
How many markers each state contributes
The data used on this page
Every open place in the United States in OurAirports, a public-domain database, and its large and medium airports for the markers with popups. CARTO's raster basemaps, which many Folium examples load with tiles="CartoDB positron", now return a grey tile stamped "API KEY REQUIRED" (checked on 2 October 2026), so this page uses Folium's default OpenStreetMap tiles, within the OpenStreetMap tile usage policy.
from pathlib import Path

import numpy as np
import pandas as pd
import requests

Path("data").mkdir(exist_ok=True)
p = Path("data/airports.csv")
if not p.exists():
    r = requests.get("https://davidmegginson.github.io/ourairports-data/airports.csv", timeout=300)
    r.raise_for_status()
    p.write_bytes(r.content)
A = pd.read_csv(p, keep_default_na=False, na_values=[""])
US = A[(A.iso_country == "US") & (A.type != "closed")].reset_index(drop=True)
LM = US[US.type.isin(["large_airport", "medium_airport"])].reset_index(drop=True)
print(f"US places: {len(US):,}; large and medium airports: {len(LM):,}")
US places: 25,081; large and medium airports: 918
OurAirports lists 25,081 open places in the US, from heliports and seaplane bases to major airports. Of these, 918 are large or medium airports.
Example 1: how many markers each state contributes
Clusters show counts as you pan; the same counts from the data explain what the bubbles will say over each state:
by_state = US.iso_region.str[3:].value_counts()
print(f"states and territories: {len(by_state)}; most airfields: {', '.join(f'{k} {v:,}' for k, v in by_state.head(5).items())}")
print(f"fewest: {', '.join(f'{k} {v}' for k, v in by_state.tail(3).items())}")
states and territories: 52; most airfields: TX 2,701, CA 1,710, FL 1,078, AK 939, PA 854
fewest: RI 30, DC 21, U-A 15
There are 52 regions: the 50 states, DC, and U-A, the 15 places OurAirports has not assigned to a state. Texas has the most, 2,701, followed by California with 1,710. Alaska, with 939, is fourth despite its small population. Rhode Island has 30.
How Leaflet clusters markers on screen
Marker clustering, from the Leaflet.markercluster plugin, groups markers on screen with a grid-based algorithm: markers within maxClusterRadius pixels of each other at the current zoom are merged into a bubble whose label is their count and whose colour reflects its size. Zooming in recomputes the groups, and clicking a bubble zooms to its contents. Because the grouping is in pixels, the same data clusters into a few large bubbles nationally and into individual markers at street level, which keeps the number of things on screen manageable at every zoom.
The cost is in the file and the browser. MarkerCluster serialises every marker, with its popup and icon, as a separate JavaScript statement, so the HTML grows with each marker's options; FastMarkerCluster writes the coordinates once as an array and creates the markers in the browser with one callback, which is much smaller and loads faster but makes per-marker popups harder. For tens of thousands of points with little detail each, the fast version is the right choice; for a few thousand with rich popups, the regular one.
Callbacks, layers and spiderfying
- Custom callback:
FastMarkerCluster(data, callback=js)takes a JavaScript function to build each marker, including popups from extra columns. - Layers: give each cluster a
nameand addfolium.LayerControl()to switch groups on and off. - Icons:
prefix="fa"uses Font Awesome names; without it, Bootstrap glyphicons. - Spiderfy: markers at identical coordinates spread into a spiral when clicked at the maximum zoom.
Internal links
- Fixing a Folium map that is slow with many markers — the performance side
- How to make interactive maps with Folium — markers and popups
- How to make a heatmap with Folium in Python — heat instead of markers
FAQ
How do I cluster markers in Folium?
Create MarkerCluster().add_to(m) and add each marker to the cluster instead of the map.
What is the difference between MarkerCluster and FastMarkerCluster?
MarkerCluster writes every marker into the HTML with its own options; FastMarkerCluster writes only the coordinates and builds markers in the browser, which is far smaller for many points.
How do I stop clustering when zoomed in?
Pass options={"disableClusteringAtZoom": 9} to MarkerCluster.
How many markers can Folium handle?
A few thousand plain markers comfortably; with clustering tens of thousands; beyond that use FastMarkerCluster, a heatmap or a GPU library.