
How to Make a Heatmap With Folium in Python
On this page
Problem statement
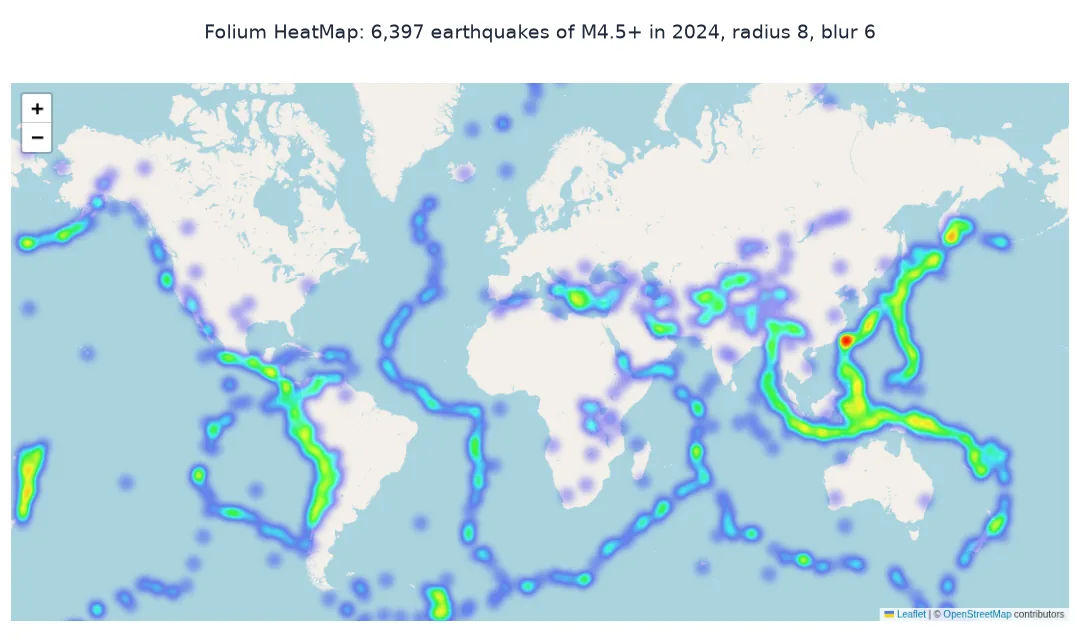
Folium wraps Leaflet, the most widely used web-mapping library, and its HeatMap plugin turns a list of coordinates into a heat layer on an OpenStreetMap basemap in a few lines. The result is a standalone HTML file. The plugin's parameters, though, are easy to get wrong in ways that change the picture: the order of coordinates in each row, the radius and blur in pixels, and weights that need to be scaled.
This page builds a Folium heatmap of every magnitude 4.5 and larger earthquake of 2024 from the USGS catalogue, compares radius settings, weights the points by magnitude, adds a time-stepped heatmap that plays through the months, and checks the HTML output.
Quick answer
Pass a list of [lat, lon] or [lat, lon, weight] rows to HeatMap and add it to the map:
import folium
from folium.plugins import HeatMap
m = folium.Map(location=[20, 10], zoom_start=2)
HeatMap(Q[["latitude", "longitude"]].values.tolist(), radius=8, blur=6, min_opacity=0.3).add_to(m)
m.save("data/quakes_heat.html")
print(f"points: {len(Q):,}; HTML {Path('data/quakes_heat.html').stat().st_size / 1e6:.2f} MB")
print(f"first row passed: {Q[['latitude', 'longitude']].values.tolist()[0]} (latitude first, Leaflet's order)")
points: 6,397; HTML 0.14 MB
first row passed: [17.6625, 145.4596] (latitude first, Leaflet's order)
All 6,397 points fit in a 0.14 MB HTML file. The first row, [17.6625, 145.4596], is latitude then longitude, 272 km north of Saipan in the Northern Mariana Islands.
Latitude first, weights, a heatmap through time
1. Latitude first
Leaflet, and so Folium, expects [latitude, longitude], the opposite of GeoJSON and shapely. Passing longitude first puts points in the wrong place, and silently:
wrong = Q[["longitude", "latitude"]].values
print(f"rows with a 'latitude' beyond ±90 if the columns are swapped: {(np.abs(wrong[:, 0]) > 90).sum():,} of {len(wrong):,}")
rows with a 'latitude' beyond ±90 if the columns are swapped: 4,610 of 6,397
With the columns swapped, 4,610 of the 6,397 rows would have a "latitude" beyond ±90, because most of these earthquakes are at longitudes past 90° east or west, around the Pacific. Folium raises no error. Leaflet's Web Mercator projection clamps latitudes beyond about 85° to the edge of the map, so those points pile up along the top and bottom, and the other 1,787 land in the wrong place.
2. Weights
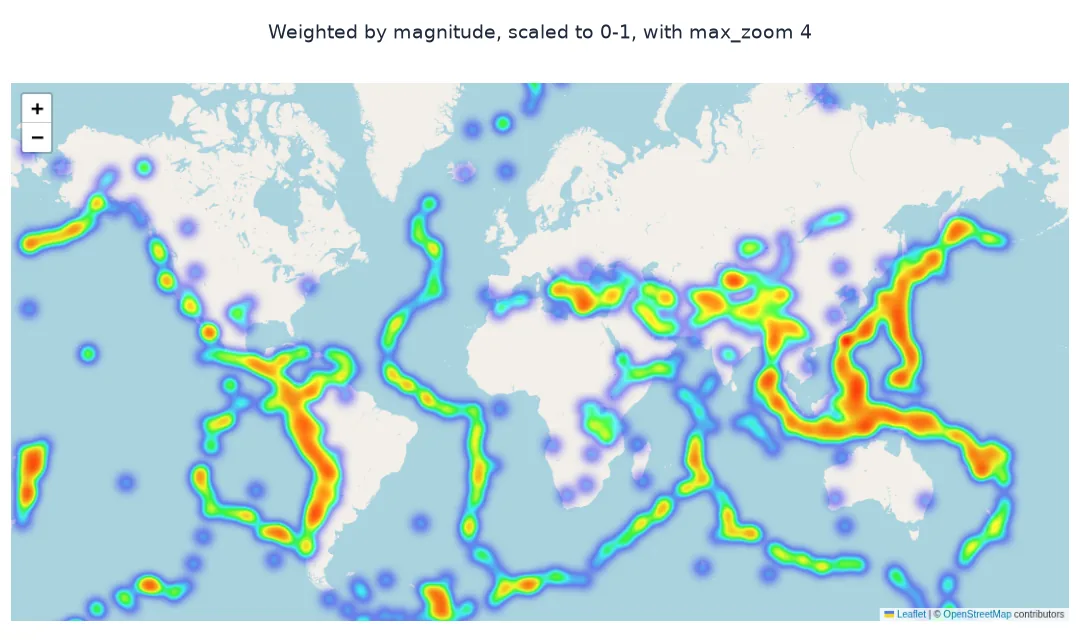
Each row can carry a weight, which HeatMap multiplies into the intensity. Weights should be in a sensible range; scale them so the largest is 1. Lowering max_zoom from its default of 18 brightens the heat at low zoom levels:
w = (Q.mag - 4.4) / (Q.mag.max() - 4.4)
rows = np.c_[Q.latitude, Q.longitude, w].tolist()
m2 = folium.Map(location=[20, 10], zoom_start=2)
HeatMap(rows, radius=10, blur=8, max_zoom=4).add_to(m2)
m2.save("data/quakes_heat_weighted.html")
print(f"weights from {w.min():.2f} to {w.max():.2f}; M7+ events carry {w[Q.mag >= 7].sum() / w.sum():.1%} of the total weight")
weights from 0.03 to 1.00; M7+ events carry 1.1% of the total weight
The weights run from 0.03 for an M4.5 to 1.00 for the year's largest event. Weights that are linear in magnitude change the picture very little: the M7 and larger earthquakes carry only 1.1% of the total weight, so the heat still mostly shows how many earthquakes there were, not how strong they were. To emphasise energy, weight by something steeper, such as 10 raised to the magnitude, scaled to 0–1.
3. A heatmap through time
HeatMapWithTime takes one list of points per time step and adds a player. Build monthly frames:
from folium.plugins import HeatMapWithTime
months = sorted(Q.month.unique())
frames = [Q[Q.month == mo][["latitude", "longitude"]].values.tolist() for mo in months]
m3 = folium.Map(location=[20, 10], zoom_start=2)
HeatMapWithTime(frames, index=months, radius=8, auto_play=False).add_to(m3)
m3.save("data/quakes_heat_time.html")
print(f"frames: {len(frames)}; points per frame {min(map(len, frames))} to {max(map(len, frames))}; HTML {Path('data/quakes_heat_time.html').stat().st_size / 1e6:.2f} MB")
frames: 12; points per frame 450 to 705; HTML 0.14 MB
There are twelve monthly frames, holding 450 to 705 points each. The file is still 0.14 MB, because each earthquake is stored once, in its own month's frame.
Radius and blur
The data used on this page
Every earthquake of magnitude 4.5 or more worldwide in 2024 from the USGS FDSN event service, as CSV. CARTO's raster basemaps, which many Folium examples load with tiles="CartoDB positron", now return a grey tile stamped "API KEY REQUIRED" (checked on 2 October 2026), so this page uses Folium's default OpenStreetMap tiles, within the OpenStreetMap tile usage policy.
from pathlib import Path

import numpy as np
import pandas as pd
import requests

Path("data").mkdir(exist_ok=True)
p = Path("data/quakes_m45_2024.csv")
if not p.exists():
    r = requests.get("https://earthquake.usgs.gov/fdsnws/event/1/query", timeout=600,
                     params=dict(format="csv", starttime="2024-01-01", endtime="2025-01-01", minmagnitude=4.5, orderby="time-asc"))
    r.raise_for_status()
    p.write_bytes(r.content)
Q = pd.read_csv(p)
Q = Q[Q["type"] == "earthquake"].reset_index(drop=True)
Q["month"] = pd.to_datetime(Q.time).dt.strftime("%Y-%m")
print(f"{len(Q):,} earthquakes of M4.5+ in 2024")
6,397 earthquakes of M4.5+ in 2024
The catalogue holds 6,397 earthquakes of magnitude 4.5 or more for 2024.
Example 1: radius and blur
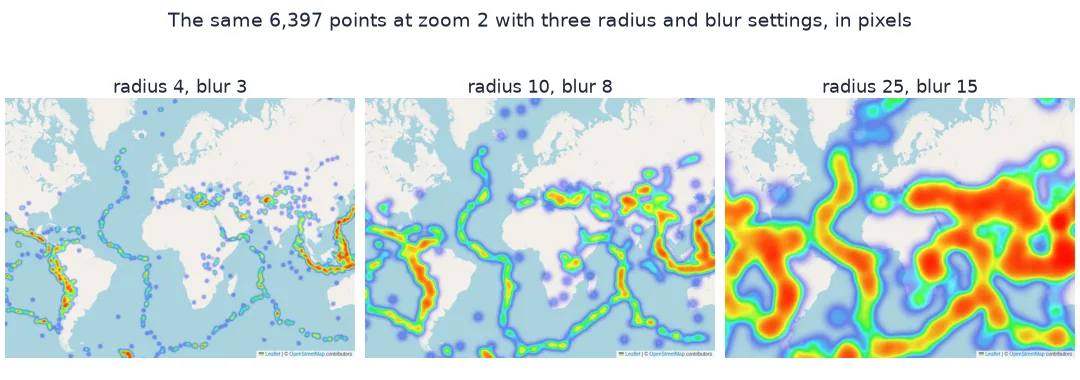
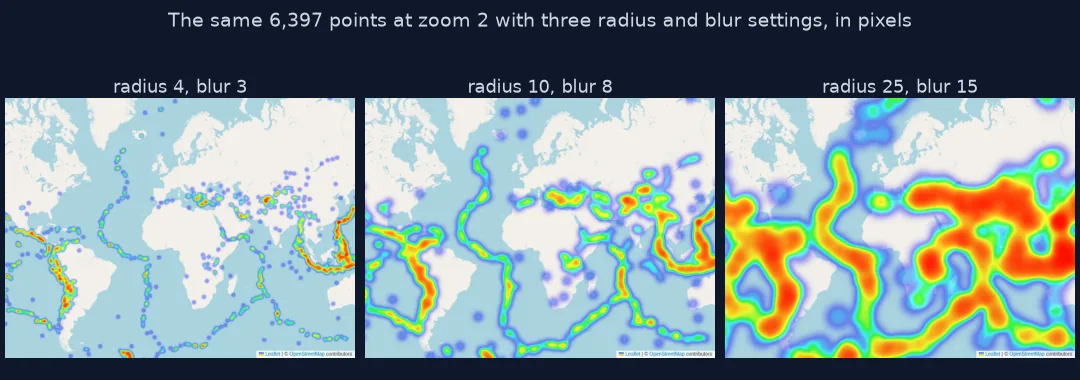
The radius and blur are in pixels. Build three maps of the same data and compare how the heat layer is configured in the saved HTML:
import re
for rad, bl in ((4, 3), (10, 8), (25, 15)):
    mm = folium.Map(location=[20, 10], zoom_start=2)
    HeatMap(Q[["latitude", "longitude"]].values.tolist(), radius=rad, blur=bl).add_to(mm)
    html = mm.get_root().render()
    opts = re.search(r'L\.heatLayer\([^{]*(\{[^}]*\})', html, re.S).group(1)
    print(f"radius {rad:>2}, blur {bl:>2}: options in the page {' '.join(opts.split())}")
radius 4, blur 3: options in the page { "minOpacity": 0.5, "maxZoom": 18, "radius": 4, "blur": 3, }
radius 10, blur 8: options in the page { "minOpacity": 0.5, "maxZoom": 18, "radius": 10, "blur": 8, }
radius 25, blur 15: options in the page { "minOpacity": 0.5, "maxZoom": 18, "radius": 25, "blur": 15, }
Only radius and blur change between the three maps. The other options are the plugin's defaults, minOpacity 0.5 and maxZoom 18, which are written into the page with them.
Folium writes a Leaflet page
Folium generates a Leaflet web page from Python objects: a Map, layers added to it, and plugins such as HeatMap, which uses the Leaflet.heat library. Leaflet.heat draws each point as a blurred circle on a canvas, adds the circles up, and maps the sum through a colour gradient, from transparent through blue and green to red. Like every browser heatmap, its radius and blur are in screen pixels, so the same settings show broad regional patterns at a low zoom and individual clusters when zoomed in; max_zoom sets the zoom at which points reach full intensity.
The data is written into the HTML as a JavaScript array, so the file grows with the number of points: a few thousand are negligible, a few hundred thousand make a heavy page. The coordinate order is the classic trap: Leaflet's convention is latitude, longitude, while GeoJSON, shapely and GeoPandas put longitude first, and a heatmap built from gdf.geometry.x, gdf.geometry.y without swapping is mirrored across the diagonal of the map.
NaN coordinates, gradients and Jupyter
- NaN coordinates: drop rows with missing values first; a single NaN can stop the layer from drawing.
- Gradient: pass
gradient={0.4: "blue", 0.65: "lime", 1: "red"}to change the colours. - Very many points: for hundreds of thousands, aggregate first or use a GPU-based library such as lonboard.
- Jupyter: the map displays inline when it is the last expression in a cell; in scripts, save to HTML.
Internal links
- How to make interactive maps with Folium — Folium basics
- How to make a density heatmap map with Plotly in Python — the Plotly equivalent
- How to cluster thousands of markers with Folium in Python — points instead of heat
FAQ
How do I make a heatmap in Folium?
Import HeatMap from folium.plugins, pass a list of [lat, lon] rows, and add it to a folium.Map.
What order do coordinates go in Folium?
Latitude first, then longitude, the Leaflet convention.
How do I weight a Folium heatmap?
Give each row a third value, [lat, lon, weight], scaled so the largest weight is about 1.
How do I animate a heatmap over time?
Use HeatMapWithTime with a list of point lists, one per time step, and an index of labels.