
Fixing a Plotly Choropleth Map That Shows No Colours
On this page
Problem statement
A Plotly choropleth that runs without an error but shows an empty basemap, or colours only some of the areas, is one of the most common Plotly questions. Plotly draws a polygon only when a value in locations matches an identifier in the GeoJSON exactly, and it says nothing when they do not match. Three mistakes cause almost all blank maps: identifiers that lost their leading zeros, a featureidkey that points at the wrong place, and a GeoJSON in projected coordinates instead of longitude and latitude.
This page reproduces each of the three on the 2023 population density of US counties, measures how many counties each one leaves uncoloured, and fixes them, with a matching check to run before drawing any choropleth.
Quick answer
Check the match before drawing. Every value in locations must equal, as a string, the property featureidkey names:
def match_report(locations, gj, featureidkey="properties.GEOID"):
    path = featureidkey.split(".")
    ids = set()
    for f in gj["features"]:
        v = f
        for k in path:
            v = v.get(k, {}) if isinstance(v, dict) else {}
        ids.add(str(v))
    loc = set(map(str, locations))
    return len(loc & ids), len(loc)

print("GEOID as zero-padded strings, featureidkey='properties.GEOID': %d of %d match" % match_report(D.GEOID, GJ))
GEOID as zero-padded strings, featureidkey='properties.GEOID': 3144 of 3144 match
With five-character string codes and featureidkey="properties.GEOID", all 3,144 locations match. A match count below the total is the first sign of a blank or patchy map.
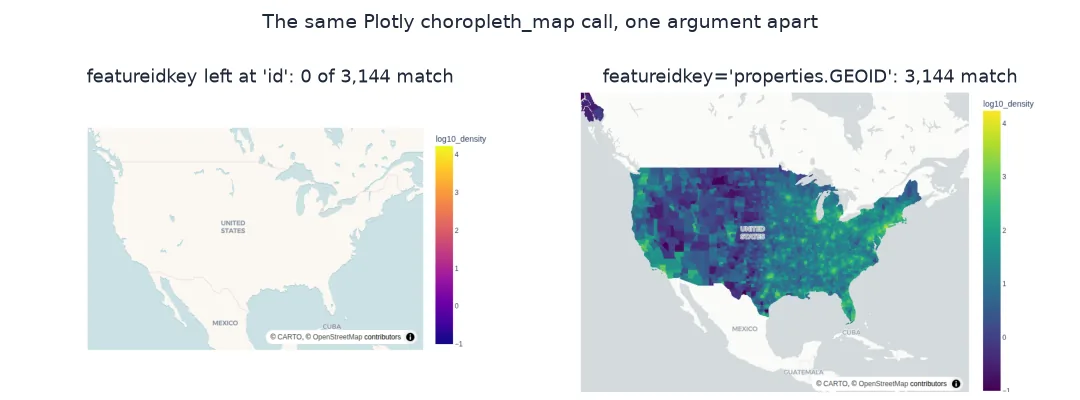
Leading zeros, featureidkey, projected coordinates
1. Leading zeros
FIPS codes such as 01001 (Autauga County, Alabama) start with a zero. Reading the CSV without dtype turns them into integers, and the zero is gone for good:
raw = pd.read_csv("data/co-est2023-alldata.csv", encoding="latin-1")
raw = raw[raw.SUMLEV == 50]
as_int = (raw.STATE * 1000 + raw.COUNTY).astype(str)
print(f"dtype of STATE when read without dtype: {raw.STATE.dtype}; first codes {as_int.head(2).tolist()}")
print("integer codes: %d of %d match" % match_report(as_int, GJ))
print("fixed with zfill(5): %d of %d match" % match_report(as_int.str.zfill(5), GJ))
dtype of STATE when read without dtype: int64; first codes ['1001', '1003']
integer codes: 2826 of 3144 match
fixed with zfill(5): 3144 of 3144 match
Read without dtype, the state code is an integer, and Autauga County's 01001 becomes 1001. Only 2,826 of the 3,144 codes still match: the 318 counties in the states coded 01 to 09, Alabama, Alaska, Arizona, Arkansas, California, Colorado and Connecticut, would be left blank. zfill(5) restores all 3,144.
2. featureidkey
Without featureidkey, Plotly matches against each feature's top-level id. GeoDataFrame's to_json() fills id with the row index, so nothing matches:
print(f"top-level id of the first feature: {GJ['features'][0]['id']!r}; its GEOID: {GJ['features'][0]['properties']['GEOID']!r}")
print("featureidkey left at 'id': %d of %d match" % match_report(D.GEOID, GJ, "id"))
fig_bad = px.choropleth_map(D, geojson=GJ, locations="GEOID", color="log10_density", zoom=2.6, center={"lat": 38, "lon": -96})
fig_bad.write_html("data/blank_featureidkey.html", include_plotlyjs="cdn")
top-level id of the first feature: '0'; its GEOID: '13027'
featureidkey left at 'id': 0 of 3144 match
The first feature's top-level id is '0', its row number, while its GEOID is '13027'. Left at the default, featureidkey matches none of the 3,144 counties, and the map is entirely blank.
3. Projected coordinates
Plotly reads GeoJSON coordinates as longitude and latitude. A GeoDataFrame in a projected CRS gives values in metres, which land nowhere on the map even when every identifier matches:
proj = json.loads(C.to_crs(5070)[["GEOID", "geometry"]].to_json())
x0, y0 = proj["features"][0]["geometry"]["coordinates"][0][0][:2]
print("EPSG:5070 GeoJSON: %d of %d match" % match_report(D.GEOID, proj))
print(f"its first vertex: ({x0:,.0f}, {y0:,.0f}), far outside ±180, ±90")
print(f"fix: to_crs(4326) first; the first vertex becomes {tuple(round(v, 3) for v in GJ['features'][0]['geometry']['coordinates'][0][0][:2])}")
EPSG:5070 GeoJSON: 3144 of 3144 match
its first vertex: (1,163,909, 959,861), far outside ±180, ±90
fix: to_crs(4326) first; the first vertex becomes (-83.736, 31.038)
In EPSG:5070 every identifier still matches, but the first vertex is at (1,163,909, 959,861), in metres, which Plotly reads as degrees far off the globe. After to_crs(4326) it is (−83.736, 31.038), in southern Georgia.
The working map
The data used on this page
The US Census Bureau's 2023 county cartographic boundaries (1:20 million) and Vintage 2023 county population estimates, read with the codes as strings.
import json
from pathlib import Path

import geopandas as gpd
import numpy as np
import pandas as pd
import plotly.express as px
import requests

Path("data").mkdir(exist_ok=True)
def cached(path, url):
    p = Path(path)
    if not p.exists():
        r = requests.get(url, timeout=600)
        r.raise_for_status()
        p.write_bytes(r.content)
    return p
C = gpd.read_file(cached("data/cb_2023_us_county_20m.zip", "https://www2.census.gov/geo/tiger/GENZ2023/shp/cb_2023_us_county_20m.zip")).to_crs(4326)
est = pd.read_csv(cached("data/co-est2023-alldata.csv", "https://www2.census.gov/programs-surveys/popest/datasets/2020-2023/counties/totals/co-est2023-alldata.csv"),
                  encoding="latin-1", dtype={"STATE": str, "COUNTY": str})
est = est[est.SUMLEV == 50].assign(GEOID=lambda d: d.STATE + d.COUNTY)[["GEOID", "POPESTIMATE2023"]]
C = C[C.STATEFP != "72"].merge(est, on="GEOID")
D = pd.DataFrame({"GEOID": C.GEOID, "density_km2": C.POPESTIMATE2023 / (C.to_crs(5070).area / 1e6)})
D["log10_density"] = np.log10(D.density_km2.clip(lower=0.1))
GJ = json.loads(C[["GEOID", "geometry"]].to_json())
print(f"{len(D):,} counties with a boundary and a 2023 estimate")
3,144 counties with a boundary and a 2023 estimate
3,144 counties and county equivalents have both a boundary and a 2023 estimate.
Example 1: the working map
With the three fixes in place, draw the map and save it:
fig = px.choropleth_map(D, geojson=GJ, locations="GEOID", featureidkey="properties.GEOID", color="log10_density",
                        color_continuous_scale="Viridis", zoom=2.6, center={"lat": 38, "lon": -96}, map_style="carto-positron")
fig.update_traces(marker_line_width=0)
fig.update_layout(margin=dict(l=0, r=0, t=0, b=0))
fig.write_html("data/fixed_choropleth.html", include_plotlyjs="cdn")
print("matched before drawing: %d of %d" % match_report(D.GEOID, GJ))
matched before drawing: 3144 of 3144
With string codes, the right featureidkey and GeoJSON in EPSG:4326, all 3,144 counties match and are coloured.
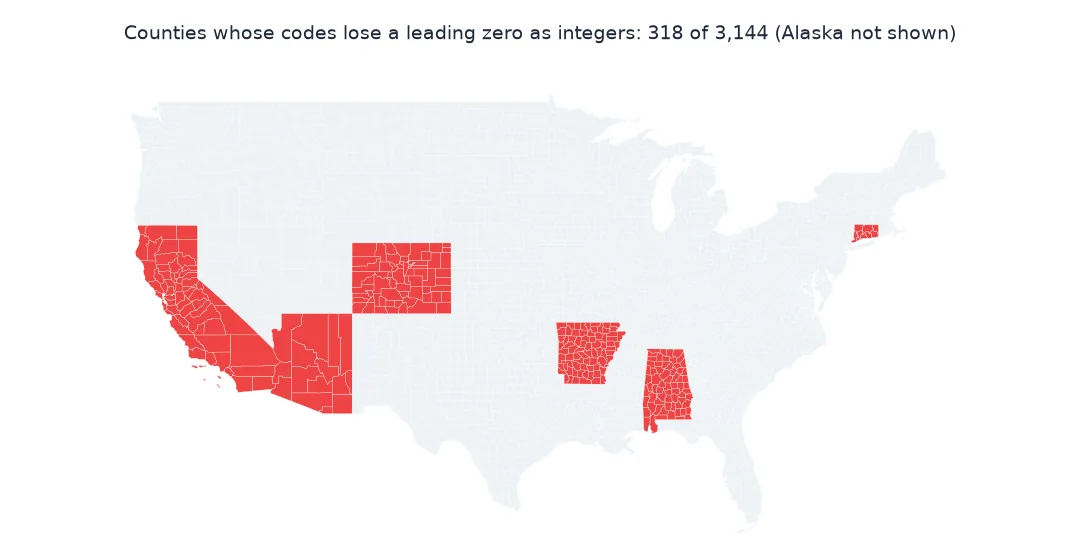
A join between values and shapes, made in the browser
A choropleth joins two things that know nothing about each other: a table of values and a set of shapes. Plotly makes the join in the browser, by looking up each value of locations among the identifiers found at featureidkey in the GeoJSON features, id by default. A value with no match is skipped, and a shape with no value is not drawn, so a complete mismatch produces a map with a basemap, a colour bar and nothing else. Because no error is raised, the fix is to count the matches yourself, as strings, before drawing.
The three causes are each easy to fall into. FIPS codes, ZIP codes and many other identifiers look numeric, so pandas reads them as integers and drops their leading zeros. GeoPandas writes the row index into each feature's id, which looks like a valid key but is not the one the data uses. And a GeoDataFrame kept in a projected CRS for area calculations produces coordinates in metres, which Plotly reads as degrees far outside the world.
Partly coloured maps and numeric locations
- Partially coloured maps: a few uncoloured areas usually mean renamed or merged units, such as Connecticut's planning regions replacing its counties in 2022; compare the sets to list them.
- px.choropleth with geo axes: also needs
fitbounds="locations"or ascope, or the shapes may be off-screen. - Numeric locations: convert both sides to strings yourself, so the match does not depend on how each library compares numbers and text.
- Large GeoJSON: simplify geometry; a blank map can also be a page that has not finished loading.
Internal links
- How to make a choropleth map with Plotly in Python — the full guide
- Fixing a census join that loses leading zeros — the identifier problem in general
- Colour on maps explained — once the colours appear
FAQ
Why is my Plotly choropleth blank?
Usually because locations does not match the GeoJSON identifiers: leading zeros lost, the wrong featureidkey, or a GeoJSON that is not in longitude and latitude.
What should featureidkey be?
The path to the identifying property in each feature, for example properties.GEOID; without it Plotly uses the feature's top-level id.
Why are only some counties coloured?
Typically codes from states 01 to 09 lost their leading zero, or some units changed between the data and the boundaries.
Does Plotly need GeoJSON in EPSG:4326?
Yes; reproject with gdf.to_crs(4326) before to_json().