
SVG, Canvas and WebGL: How Web Maps Draw Data, Explained
On this page
Problem statement
Two web maps of the same points can behave completely differently: one pans smoothly with a hundred thousand features, the other stutters with ten thousand. The difference is rarely the data or the library's quality. It is how the browser is asked to draw. There are three ways. SVG creates one element per feature in the page's document. Canvas paints everything into one bitmap. WebGL hands the coordinates to the graphics card. Every Python web-mapping library uses one of them, and knowing which explains its limits.
This page draws 1,000, 10,000 and 50,000 named places from the USGS Geographic Names Information System in all three ways: Folium circle markers as SVG, the same markers on a canvas, and a pydeck layer in WebGL. It counts what each creates in the browser and checks what the browser sees under the mouse.
Quick answer
Build the three pages for each sample, load them in headless Chromium, and count what each puts in the browser for 10,000 points:
for n in SIZES:
    pages(n)
res = measure([f"{kind}_{n}.html" for n in SIZES for kind in ("svg", "canvas", "webgl")])
for f in (f"{kind}_10000.html" for kind in ("svg", "canvas", "webgl")):
    r = res[f]
    print(f"{f:>18}: {r['paths']:>6,} SVG paths, {r['canvases']} canvas elements, {r['nodes']:>6,} elements in the page")
svg_10000.html: 10,003 SVG paths, 0 canvas elements, 10,071 elements in the page
canvas_10000.html: 3 SVG paths, 1 canvas elements, 70 elements in the page
webgl_10000.html: 0 SVG paths, 2 canvas elements, 35 elements in the page
With 10,000 points, the SVG page holds 10,003 paths, one per circle plus three that are not data and appear in the canvas page too, and 10,071 elements in all. The canvas page holds one canvas and 70 elements, the WebGL page two canvases and 35.
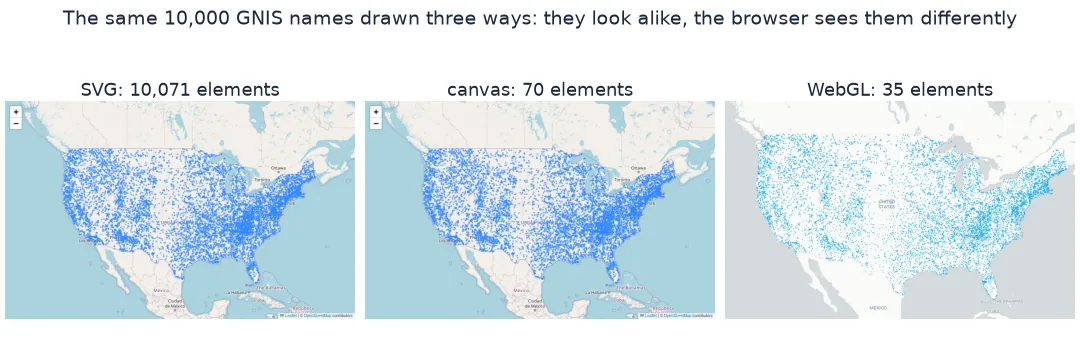
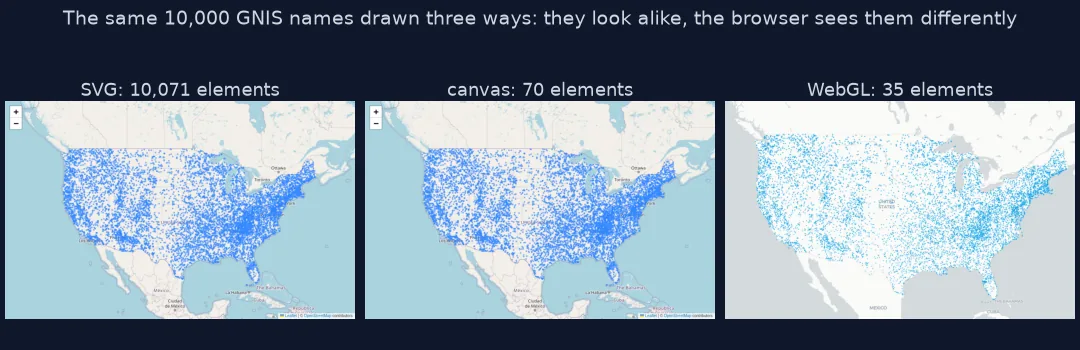
Element growth, hit testing, each library's method
1. Elements grow with the data only in SVG
for n in SIZES:
    print(f"{n:>6,} points: " + "; ".join(f"{kind} {res[f'{kind}_{n}.html']['nodes']:,} elements" for kind in ("svg", "canvas", "webgl")))
1,000 points: svg 1,071 elements; canvas 70 elements; webgl 35 elements
10,000 points: svg 10,071 elements; canvas 70 elements; webgl 35 elements
50,000 points: svg 50,071 elements; canvas 70 elements; webgl 35 elements
The SVG page grows by exactly one element per point, from 1,071 to 50,071. The canvas and WebGL pages stay at 70 and 35 elements whatever the number of points.
2. What is under the mouse
In SVG every feature is an element the browser can hit-test on its own. On a canvas or in WebGL the browser only sees one picture, and the library must work out which feature was hit:
HIT = """() => { const m = Object.values(window).find(v => v instanceof L.Map); const p = m.latLngToContainerPoint([LAT, LON]);
  const r = m.getContainer().getBoundingClientRect(); const el = document.elementFromPoint(r.left + p.x, r.top + p.y);
  return el.tagName.toLowerCase() + (el.getAttribute('class') ? '.' + el.getAttribute('class').split(' ')[0] : ''); }"""
lat, lon = S1.geometry.y.iloc[0], S1.geometry.x.iloc[0]
with browser_page() as open_page:
    for f in ("svg_1000.html", "canvas_1000.html"):
        page = open_page(f)
        print(f"{f:>16}: element under the first point is <{page.evaluate(HIT.replace('LAT', str(lat)).replace('LON', str(lon)))}>")
svg_1000.html: element under the first point is <path.leaflet-interactive>
canvas_1000.html: element under the first point is <canvas.leaflet-zoom-animated>
Under the first point, the browser finds a <path> in the SVG page: the feature itself, with its own events. In the canvas page it finds only the canvas, and Leaflet has to work out which circle the mouse is over.
3. Which method each library uses
| Library | Drawing method |
|---|---|
Folium, gdf.explore() |
SVG by default, canvas with prefer_canvas=True; marker icons are images |
Plotly tile maps (scatter_map, choropleth_map) |
WebGL, through MapLibre |
| pydeck | WebGL, through deck.gl |
| lonboard | WebGL, through deck.gl, with binary data |
| matplotlib, Cartopy | none in the browser: a finished image |
Which drawing method each library uses
The data used on this page
Random samples of 1,000, 10,000 and 50,000 names in the conterminous US from the national file of the GNIS Domestic Names. Pages are measured in headless Chromium with Playwright, served over a local HTTP server.
import contextlib
import functools
import http.server
import socketserver
import threading
import zipfile
from pathlib import Path

import folium
import geopandas as gpd
import pandas as pd
import pydeck as pdk
import requests
from playwright.sync_api import sync_playwright

Path("data").mkdir(exist_ok=True)
p = Path("data/DomesticNames_National_Text.zip")
if not p.exists():
    r = requests.get("https://prd-tnm.s3.amazonaws.com/StagedProducts/GeographicNames/DomesticNames/DomesticNames_National_Text.zip", timeout=900)
    r.raise_for_status()
    p.write_bytes(r.content)
with zipfile.ZipFile(p) as z:
    N = pd.read_csv(z.open("Text/DomesticNames_National.txt"), sep="|", low_memory=False, usecols=["feature_name", "prim_lat_dec", "prim_long_dec"])
N = N[N.prim_long_dec.between(-125, -66.5) & N.prim_lat_dec.between(24, 50)]
SIZES = (1_000, 10_000, 50_000)
SAMPLE = {n: N.sample(n, random_state=0) for n in SIZES}
S1 = gpd.GeoDataFrame(SAMPLE[1_000], geometry=gpd.points_from_xy(SAMPLE[1_000].prim_long_dec, SAMPLE[1_000].prim_lat_dec), crs=4326)

def pages(n):
    s = SAMPLE[n]
    for kind, kw in (("svg", {}), ("canvas", {"prefer_canvas": True})):
        m = folium.Map(location=[39, -98], zoom_start=4, **kw)
        for lat, lon in s[["prim_lat_dec", "prim_long_dec"]].values:
            folium.CircleMarker([lat, lon], radius=2, weight=0, fill=True, fill_opacity=0.7).add_to(m)
        m.save(f"data/{kind}_{n}.html")
    pdk.Deck(layers=[pdk.Layer("ScatterplotLayer", s, get_position=["prim_long_dec", "prim_lat_dec"], get_radius=8000, get_fill_color=[14, 165, 233, 180])],
             initial_view_state=pdk.ViewState(latitude=39, longitude=-98, zoom=3.3), map_style="light").to_html(f"data/webgl_{n}.html", open_browser=False, notebook_display=False)

@contextlib.contextmanager
def browser_page():
    class Quiet(http.server.SimpleHTTPRequestHandler):
        def log_message(self, *a): pass
    srv = socketserver.TCPServer(("127.0.0.1", 0), functools.partial(Quiet, directory="data"))
    threading.Thread(target=srv.serve_forever, daemon=True).start()
    with sync_playwright() as pw:
        browser = pw.chromium.launch()
        def open_page(f):
            page = browser.new_page(viewport={"width": 1000, "height": 600})
            page.goto(f"http://127.0.0.1:{srv.server_address[1]}/{f}", timeout=300000); page.wait_for_timeout(5000)
            return page
        yield open_page
        browser.close()
    srv.shutdown()

COUNT = """() => ({paths: document.querySelectorAll('svg path').length, canvases: document.querySelectorAll('canvas').length,
  nodes: document.getElementsByTagName('*').length})"""
def measure(files):
    out = {}
    with browser_page() as open_page:
        for f in files:
            page = open_page(f); out[f] = page.evaluate(COUNT); page.close()
    return out
print(f"{len(N):,} GNIS names in the conterminous US; samples of {', '.join(f'{n:,}' for n in SIZES)}")
922,012 GNIS names in the conterminous US; samples of 1,000, 10,000, 50,000
The conterminous US has 922,012 GNIS names, and the samples of 1,000, 10,000 and 50,000 are drawn from them.
Example 1: which method each library uses
for lib, html in (("Folium, default", "data/svg_1000.html"), ("Folium, prefer_canvas=True", "data/canvas_1000.html"), ("pydeck", "data/webgl_1000.html")):
    t = Path(html).read_text()
    method = "WebGL (deck.gl)" if "deck.gl" in t or "pydeck" in t else ("canvas" if '"preferCanvas": true' in t else "SVG")
    print(f"{lib:>27}: {method}")
Folium, default: SVG
Folium, prefer_canvas=True: canvas
pydeck: WebGL (deck.gl)
Reading the saved pages confirms the method: Folium uses SVG by default and a canvas with prefer_canvas=True, and pydeck uses deck.gl's WebGL.
SVG is part of the document
SVG, Scalable Vector Graphics, is part of the page's document: each circle is an element with its own style, events and place in the DOM, which the browser lays out and repaints. That makes SVG crisp, styleable with CSS and easy to interact with, since the browser knows which element is under the mouse, but every feature costs an element and memory, and panning moves all of them. Leaflet, and so Folium, uses SVG for vector layers by default. Canvas is a single bitmap that JavaScript paints into. Leaflet's canvas renderer draws all vector layers into one, so the document stays small no matter how many features there are. The library itself has to keep track of what was drawn where, to answer clicks and hovers.
WebGL goes a step further and moves the drawing to the graphics card. The coordinates are uploaded as arrays, and shaders draw every point in parallel each frame, which is why deck.gl (behind pydeck and lonboard) and MapLibre (behind Plotly's tile maps) handle hundreds of thousands of features smoothly. Picking is done by drawing the features again into a hidden buffer, each in a unique colour, and reading back the pixel under the mouse. The cost is complexity and a dependency on the GPU: WebGL can be unavailable on some remote desktops and headless systems, and a page can fail outright where SVG would only be slow.
Icon markers, printing and mixed pages
- Markers with icons: Leaflet's
Markeris an<img>element per feature whatever the renderer, which is why plain markers are the slowest option of all. - Printing and export: SVG maps export cleanly to vector formats; canvas and WebGL give pixels.
- Mixed pages: one Leaflet map can use both renderers, per layer, with
renderer=L.canvas(). - Element counts are not speed: a page with few elements can still be slow if it redraws a huge canvas on every frame; counts show what the browser must manage, not frame rates.
Internal links
- Fixing a Folium map that is slow with many markers — the practical side
- How to map a million points with lonboard in Python — WebGL with binary data
- Choosing a Python map library explained — which library draws how
FAQ
What is the difference between SVG, canvas and WebGL maps?
SVG creates one page element per feature, canvas paints all features into one bitmap, and WebGL draws them on the graphics card; each handles more features than the last.
Why does my Leaflet map get slow with many features?
Leaflet draws vector layers as SVG by default, one element per feature; use prefer_canvas=True in Folium or a WebGL library for large data.
Which Python map libraries use WebGL?
pydeck and lonboard (both deck.gl) and Plotly's tile-based maps (MapLibre).
Is canvas faster than SVG?
For many features, yes: the page holds one element instead of thousands, though the library must handle clicks and hovers itself.