
How to Analyse Crime by Hour and Day of Week in Python
On this page
Problem statement
Crime has a clock. Thefts follow shop hours, robberies the evening, burglaries the small hours, and the pattern differs from one place to another, so a map of when is as useful as a map of where. Building it from incident records looks like a groupby on the hour, but recorded times are not all observations: many are rounded to the hour, and some are placeholders, such as midnight or noon, entered when the real time is unknown. Counting them as real piles crime into those hours.
This page builds hour-by-weekday tables from Chicago's 2024 incident records, measures how many times are rounded or placeholders, compares the daily rhythm of six offence types, and maps where robberies happen at night.
Quick answer
Parse the timestamps, set aside records timed exactly midnight, and cross-tabulate hour against weekday:
rob = C[(C.primary_type == "ROBBERY") & ~C.midnight]
tab = pd.crosstab(rob.time.dt.hour, rob.time.dt.day_name().str[:3])[["Mon", "Tue", "Wed", "Thu", "Fri", "Sat", "Sun"]]
peak = tab.stack().idxmax()
print(f"{len(rob):,} robberies; busiest hour-day cell: {peak[1]} {peak[0]:02d}:00 with {tab.stack().max()}")
print(f"quietest cell: {tab.stack().idxmin()[1]} {tab.stack().idxmin()[0]:02d}:00 with {tab.stack().min()}")
print(tab.loc[[4, 8, 12, 16, 20]].to_string())
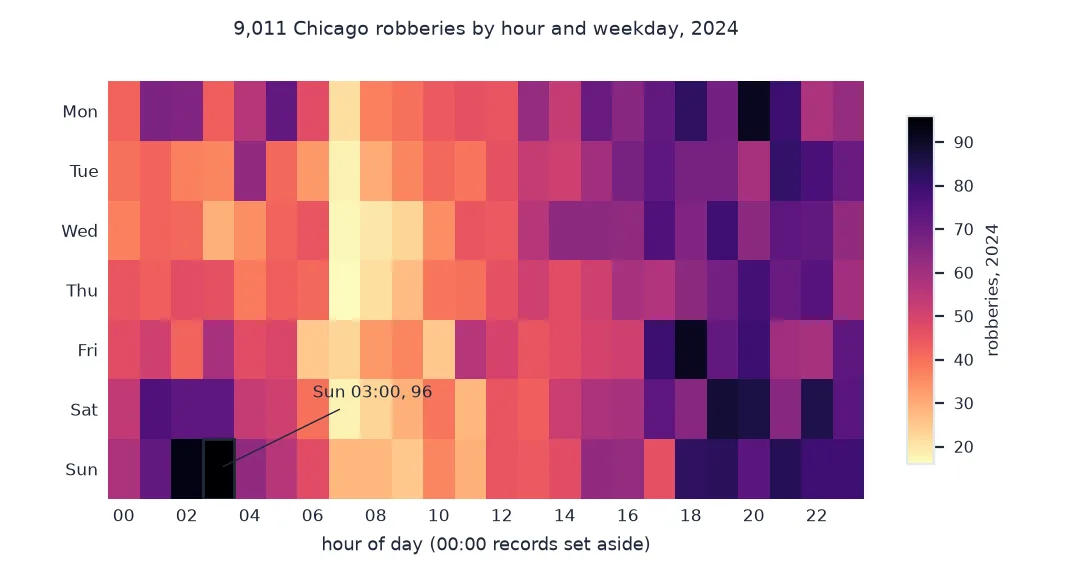
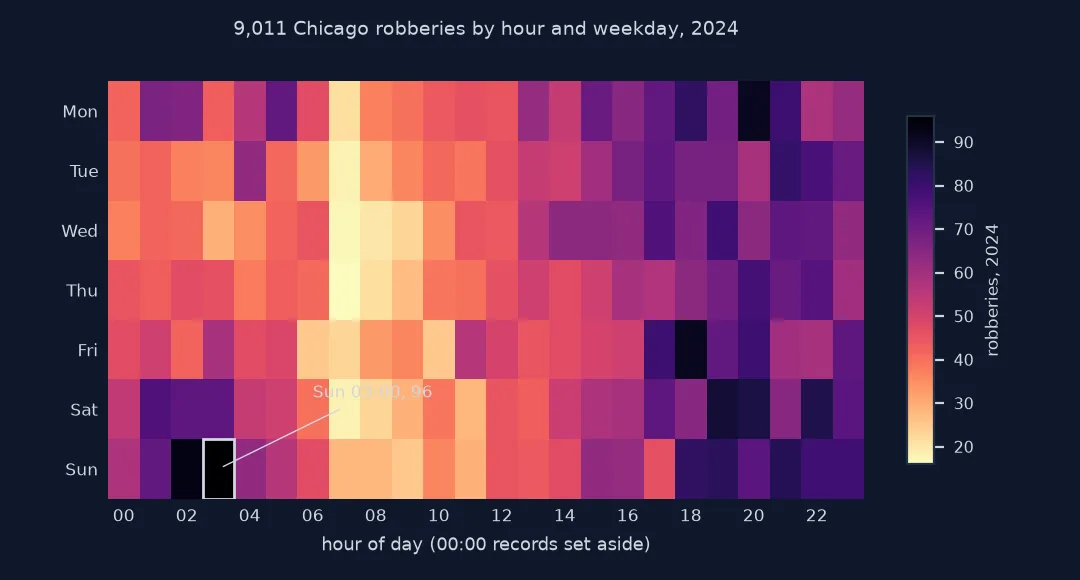
9,011 robberies; busiest hour-day cell: Sun 03:00 with 96
quietest cell: Thu 07:00 with 16
time Mon Tue Wed Thu Fri Sat Sun
time
4 56 63 35 38 47 53 63
8 37 30 20 21 33 23 28
12 45 46 44 46 50 45 45
16 65 68 63 59 51 59 62
20 91 59 64 78 80 86 74
The busiest single cell is Sunday 03:00, the end of Saturday night, with 96 robberies over the year; the quietest is Thursday 07:00, with 16. On weekdays the evening hours lead; at weekends the small hours do.
How times were recorded, daily rhythms, placeholder times
1. Check how times were recorded
Before counting by hour, look at the minutes. Real times spread evenly across them; recorded times pile up on round values:
minute = C.time.dt.minute
print(f"records at minute :00 {(minute == 0).mean():.1%}, at :30 {(minute == 30).mean():.1%}; an even spread gives 1.7%")
print(f"timed exactly 00:00: {C.midnight.mean():.1%} of all records")
print((C[C.midnight].primary_type.value_counts() / C.primary_type.value_counts()).dropna().sort_values(ascending=False).head(4).map("{:.1%}".format).to_string())
records at minute :00 33.2%, at :30 12.4%; an even spread gives 1.7%
timed exactly 00:00: 3.6% of all records
primary_type
HUMAN TRAFFICKING 65.2%
OTHER NARCOTIC VIOLATION 20.0%
OFFENSE INVOLVING CHILDREN 19.5%
CRIMINAL SEXUAL ASSAULT 16.8%
A third of all records sit on the hour and one in eight on the half hour, against 1.7% each for an even spread. Exact midnight holds 3.6% of all records, and far more for offences that are often reported long after they happen: 65.2% of human trafficking records and 16.8% of criminal sexual assaults.
Rounding to the hour does not move a record to a different hour, so it is harmless for hourly counts. Placeholder times are not: they put a crime in an hour when it may have happened at any time.
2. Compare the daily rhythm of offence types
night = [22, 23, 0, 1, 2, 3, 4]
rows = []
for t in ("THEFT", "DECEPTIVE PRACTICE", "BATTERY", "ROBBERY", "MOTOR VEHICLE THEFT", "BURGLARY"):
    d = C[(C.primary_type == t) & ~C.midnight]
    share = d.time.dt.hour.value_counts(normalize=True)
    rows.append({"type": t.lower(), "peak hour": share.idxmax(), "peak share": f"{share.max():.1%}",
                 "22:00-04:59": f"{d.time.dt.hour.isin(night).mean():.1%}", "Sat-Sun": f"{(d.time.dt.dayofweek >= 5).mean():.1%}"})
print(pd.DataFrame(rows).to_string(index=False))
type peak hour peak share 22:00-04:59 Sat-Sun
theft 12 7.3% 16.4% 27.3%
deceptive practice 12 13.9% 10.9% 22.9%
battery 15 5.6% 28.6% 31.8%
robbery 20 5.9% 31.5% 30.7%
motor vehicle theft 22 7.0% 29.7% 31.0%
burglary 4 8.0% 36.0% 26.4%
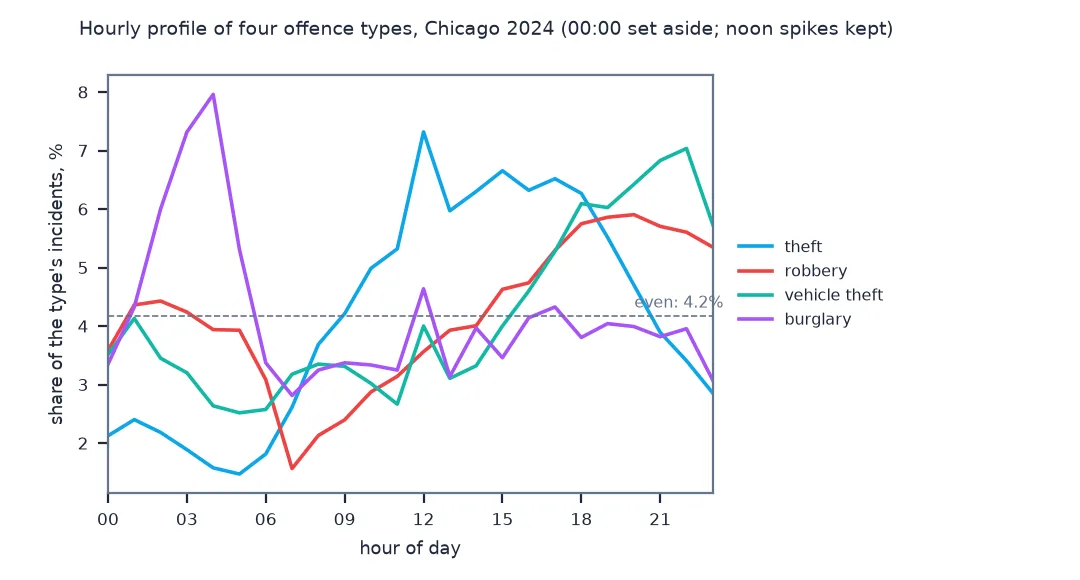
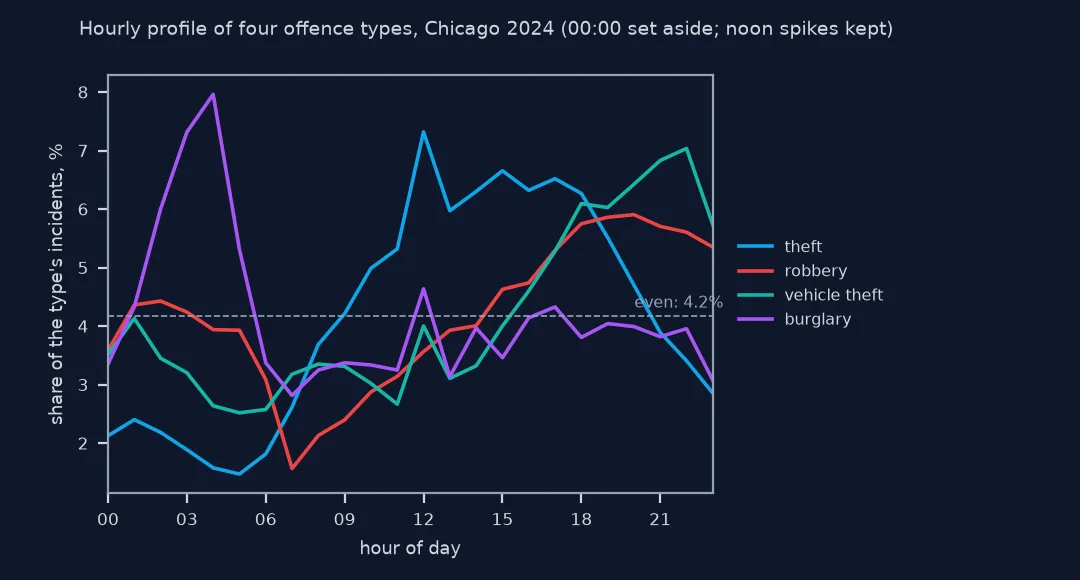
Theft and fraud peak at noon, a peak the next step takes apart, and are rare at night; robbery and motor vehicle theft peak at 20:00 and 22:00; burglary peaks at 04:00, with 36.0% of burglaries between 22:00 and 04:59. Weekend shares sit between 22.9% and 31.8%, against 28.6% for two days in seven, so most types lean only slightly towards or away from the weekend.
3. Look for a second placeholder
Theft and deceptive practice, mostly frauds, both peak at noon. Check how much of that peak sits on the exact minute, and where the peak goes without it:
for t in ("DECEPTIVE PRACTICE", "THEFT"):
    d = C[(C.primary_type == t) & ~C.midnight]
    exact_noon = (d.time.dt.hour == 12) & (d.time.dt.minute == 0)
    print(f"{t.lower()}: 12:00 hour {(d.time.dt.hour == 12).mean():.1%}, exactly 12:00 {exact_noon.mean():.1%}; "
          f"peak hour without exact noon {d[~exact_noon].time.dt.hour.value_counts().idxmax():02d}:00")
dp = C[C.primary_type == "DECEPTIVE PRACTICE"]
on_default = dp.midnight | ((dp.time.dt.hour == 12) & (dp.time.dt.minute == 0))
print(f"deceptive practice records on exact midnight or noon: {on_default.mean():.1%}")
deceptive practice: 12:00 hour 13.9%, exactly 12:00 10.0%; peak hour without exact noon 09:00
theft: 12:00 hour 7.3%, exactly 12:00 3.0%; peak hour without exact noon 15:00
deceptive practice records on exact midnight or noon: 21.2%
Most of the noon peak is records on the exact minute: 10.0 of deceptive practice's 13.9 points, and 3.0 of theft's 7.3. Without them, fraud peaks at 09:00 and theft at 15:00. With midnight, 21.2% of deceptive practice records carry one of the two default-looking times, so its hourly profile is largely a profile of how it is recorded.
Where robberies happen at night
The data used on this page
The City of Chicago's Crimes - 2001 to Present dataset (ijzp-q8t2), incidents dated 2024; times are local Chicago time as recorded, and the community area boundaries.
from pathlib import Path

import geopandas as gpd
import pandas as pd
import requests

Path("data").mkdir(exist_ok=True)
URL = "https://data.cityofchicago.org/resource/ijzp-q8t2.json"
F = Path("data/chicago_crimes_2024.parquet")
if not F.exists():
    rows, offset = [], 0
    while True:
        part = requests.get(URL, timeout=300, params={
            "$where": "year=2024", "$limit": 50_000, "$offset": offset, "$order": "id",
            "$select": "id,date,primary_type,arrest,domestic,community_area,latitude,longitude,location_description,block,updated_on"}).json()
        rows += part; offset += len(part)
        if len(part) < 50_000:
            break
    pd.DataFrame(rows).to_parquet(F)
G = Path("data/chicago_community_areas.geojson")
if not G.exists():
    G.write_bytes(requests.get("https://data.cityofchicago.org/resource/igwz-8jzy.geojson?$limit=100", timeout=120).content)
C = pd.read_parquet(F)
C["time"] = pd.to_datetime(C.date)
C["midnight"] = (C.time.dt.hour == 0) & (C.time.dt.minute == 0)
CA = gpd.read_file(G)
print(f"{len(C):,} incidents, {C.time.min():%d %b %Y} to {C.time.max():%d %b %Y}")
259,638 incidents, 01 Jan 2024 to 31 Dec 2024
Example 1: where robberies happen at night
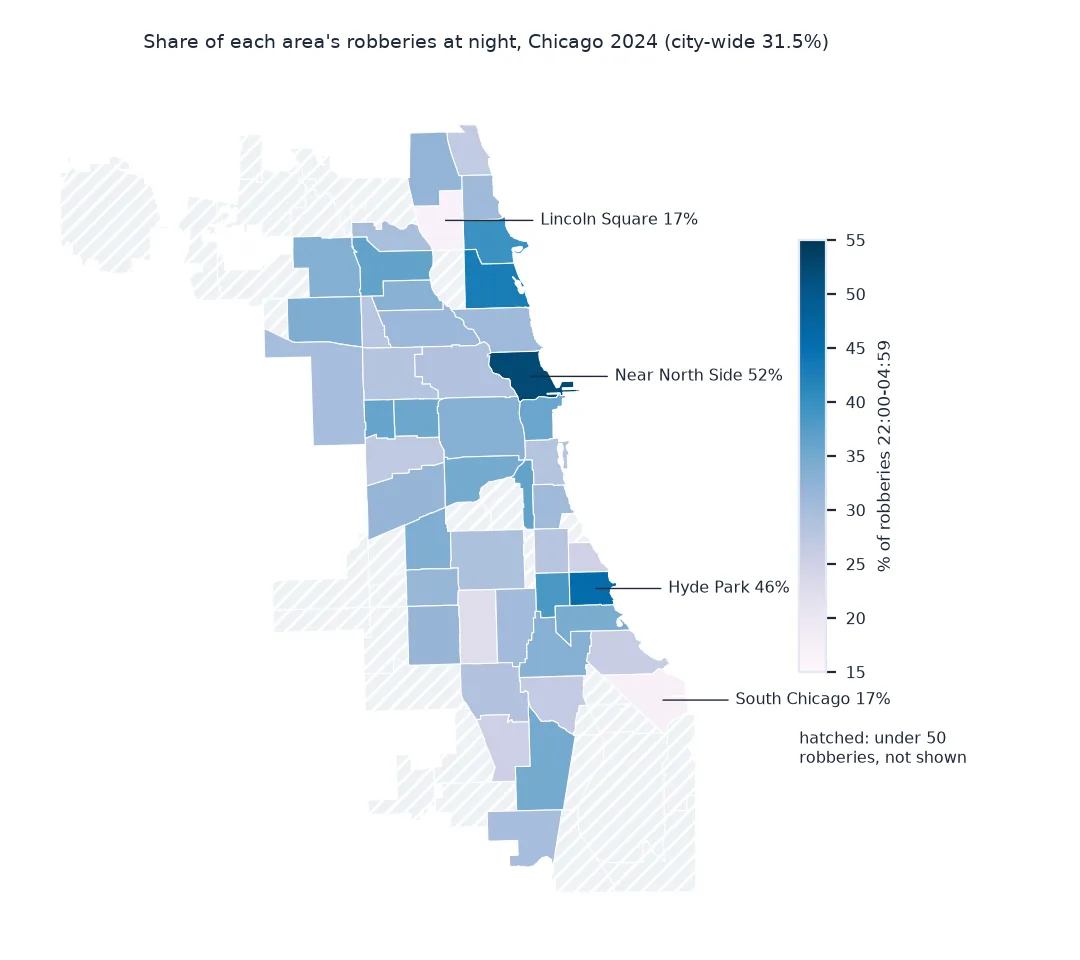
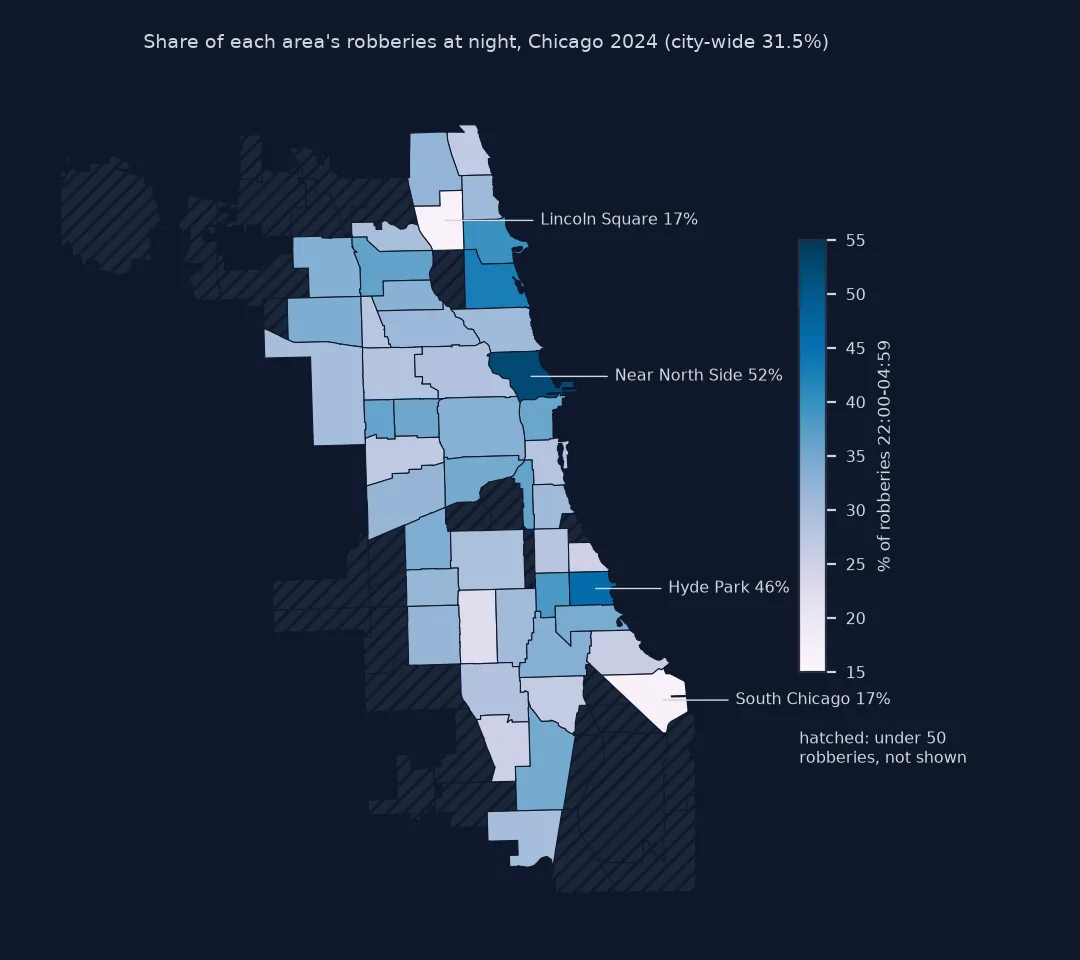
The clock differs by place. The share of each community area's robberies between 22:00 and 04:59, for areas with at least 50:
r = C[(C.primary_type == "ROBBERY") & ~C.midnight].dropna(subset=["latitude", "longitude"])
r = gpd.GeoDataFrame(r, geometry=gpd.points_from_xy(r.longitude.astype(float), r.latitude.astype(float)), crs=4326)
j = gpd.sjoin(r, CA[["community", "geometry"]], predicate="within")
NIGHT = j.assign(night=j.time.dt.hour.isin(night)).groupby("community").night.agg(share="mean", robberies="size")
NIGHT = NIGHT[NIGHT.robberies >= 50].sort_values("share")
print(f"{len(NIGHT)} areas; city-wide night share {j.time.dt.hour.isin(night).mean():.1%}")
print(pd.concat([NIGHT.head(3), NIGHT.tail(3)]).round(3).to_string())
47 areas; city-wide night share 31.5%
share robberies
community
LINCOLN SQUARE 0.167 54
SOUTH CHICAGO 0.172 134
WEST ENGLEWOOD 0.223 211
LAKE VIEW 0.429 196
HYDE PARK 0.459 85
NEAR NORTH SIDE 0.522 356
On the Near North Side, with its River North and Streeterville nightlife, 52.2% of robberies happen between 22:00 and 04:59; in Lincoln Square it is 16.7% and in South Chicago 17.2%. A city-wide clock, 31.5% at night, describes few of the areas it averages.
Routine activities set the timing
Time patterns in crime follow routine activities: offences need a target and an opportunity, and both move through the day. Shoplifting and pickpocketing need open shops and crowds, so theft is a daytime offence, highest through the afternoon. Robbery needs people on foot and fewer witnesses, and peaks in the evening. Burglary of homes and businesses happens when they are empty or their occupants asleep. The weekday and weekend split adds the nightlife pattern, strongest in districts with bars and clubs.
The records add their own pattern on top. When a victim discovers a theft or a fraud later, the time of the offence is unknown, and the record carries a range or a default. Chicago's data gives one timestamp per incident, and midnight and noon are the two values that collect the defaults. An hourly analysis should set exact midnight aside, check noon for offences such as fraud, and say how many records were excluded. Rounding to the hour or half hour is common and does not matter at hourly resolution.
Daylight saving, holidays and discovery times
- Daylight saving: local times skip an hour in March and repeat one in November; hourly totals for those days are off by one hour's worth.
- Months and holidays: seasonal and holiday effects mix into weekday counts over a year; compare like with like.
- Discovery time versus occurrence time: some datasets carry both; Chicago's carries one.
- Small counts: an hour-by-weekday table has 168 cells; for rarer offences, use broader bands, such as four-hour blocks.
- Time zones: the timestamps carry no zone; localise to
America/Chicagobefore combining with UTC data such as weather.
Internal links
- How to download and map city crime data in Python — the incidents
- How to map crime hotspots with kernel density in Python — the where
- How to calculate crime rates per resident in Python — rates by area
FAQ
How do I analyse crime by time of day in Python?
Parse the incident timestamps with pd.to_datetime, take .dt.hour and .dt.dayofweek, and use pd.crosstab to build an hour-by-weekday table.
Why are so many crimes recorded at midnight?
Midnight is a default time when the real time is unknown, often for offences discovered later; in Chicago's 2024 data 3.6% of incidents are timed exactly 00:00.
When do robberies happen?
In Chicago in 2024, robberies peaked in the evening, around 20:00, and were least common in the early morning.
Should I remove crimes recorded at exactly midnight?
From an hourly analysis, yes, and report how many; keep them for daily or yearly counts, where the time does not matter.