
How to classify crop types from a satellite time series
Problem statement
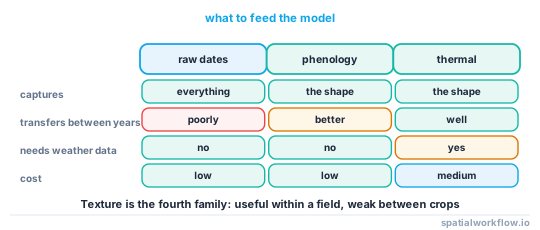
Crop classification from one image is land-cover classification with extra steps: at peak canopy, wheat, barley and grass all look like dense green vegetation. What distinguishes them is the shape of the season — when they green up, how long they stay green, how fast they senesce — so the features have to come from a time series.
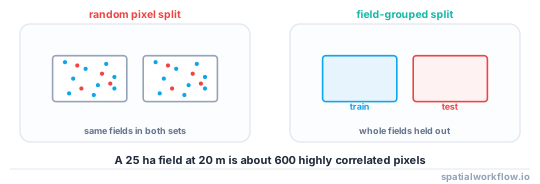
Two things then decide the accuracy, and neither is the classifier. The first is whether the features capture the season rather than the weather, which is why irregular cloud-driven sampling has to be resampled onto a common calendar. The second is whether the validation respects space, because fields are large and a random pixel split puts pixels from the same field in both training and test, which inflates the accuracy by a wide margin.
Quick answer
Interpolate onto a fixed calendar, extract features per field, and split by field:
import numpy as np, pandas as pd
from sklearn.ensemble import RandomForestClassifier
from sklearn.model_selection import GroupKFold, cross_val_score

# one row per field, columns = index value on each of a fixed set of dates
X = features.drop(columns=["field_id", "crop"]).values
y = features["crop"].values
groups = features["field_id"].values

clf = RandomForestClassifier(n_estimators=500, min_samples_leaf=2, random_state=0)
scores = cross_val_score(clf, X, y, groups=groups, cv=GroupKFold(5), n_jobs=-1)
print(f"field-grouped accuracy: {scores.mean():.3f} ± {scores.std():.3f}")
GroupKFold on the field identifier is the difference between a defensible number and a meaningless one. A plain KFold on pixels typically reports several points higher, and all of that difference is leakage.
Step-by-step solution
1. Build a cloud-screened time series per field
Field medians rather than pixel values: they are far less noisy, the field is the management unit, and the resulting table is small enough to model comfortably.
2. Resample onto a fixed calendar
Observations arrive when the sky allows — on the reference series, 21 dates across eight months with gaps of 20 and 43 days. Interpolating onto, say, ten-day steps from 1 March to 31 October gives every field the same feature vector, which a classifier requires.
3. Use several indices, not just one
NDVI for cover, a red-edge index for biomass at closure, and optionally a shortwave index for senescence and residue. NDVI alone is flat for weeks at the peak — 55.9% of vegetation pixels above 0.8 on the reference scene — which removes exactly the period when crops diverge most in biomass.
4. Add phenology metrics as features
Start of season, peak date, peak value, length and integral summarise the curve in a handful of numbers that transfer between years better than raw dates do.
5. Add thermal time if you have it
Expressing the phenology metrics in accumulated degree days rather than calendar days removes most of the between-year weather variation, which is what makes a model trained in one year work in the next.
6. Split by field, and preferably by region
GroupKFold on the field is the minimum. If the model is to be applied to a different area, a spatial block split is the honest test — Spatial cross-validation explained.
7. Report the confusion matrix, not the accuracy
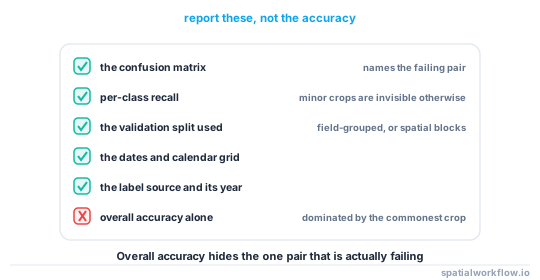
Overall accuracy hides the pair that matters. Two cereals confused with each other is a different problem from a cereal confused with grassland, and only the matrix shows which.
Code examples
Example 1 — per-field series onto a fixed calendar
import numpy as np, pandas as pd, geopandas as gpd, rasterio
from rasterio.features import rasterize

def field_series(index_stack, dates, transform, shape, fields, min_pixels=25):
    """index_stack: rows × cols × dates. Returns one row per field per date."""
    ids = rasterize(((g, i + 1) for i, g in enumerate(fields.geometry)),
                    out_shape=shape, transform=transform, fill=0, dtype="int32")
    rows = []
    for i in np.unique(ids):
        if i == 0:
            continue
        sel = ids == i
        if sel.sum() < min_pixels:
            continue
        for d, layer in zip(dates, np.moveaxis(index_stack, 2, 0)):
            v = layer[sel]
            v = v[np.isfinite(v)]
            if v.size < min_pixels // 2:
                continue
            rows.append({"field_id": int(i), "date": pd.Timestamp(d),
                         "value": float(np.median(v)), "n": int(v.size)})
    return pd.DataFrame(rows)

def to_calendar(series, start, end, freq="10D"):
    grid = pd.date_range(start, end, freq=freq)
    out = {}
    for fid, g in series.groupby("field_id"):
        s = (g.set_index("date")["value"]
             .reindex(g["date"].union(grid)).sort_index()
             .interpolate("time").reindex(grid))
        out[fid] = s.values
    return pd.DataFrame(out, index=grid).T
Building the union index before reindexing is what makes the interpolation use the real observation dates rather than only the grid.
Example 2 — features from the curve
import numpy as np, pandas as pd

def curve_features(row, dates, prefix="ndre"):
    v = np.asarray(row, dtype="float32")
    ok = np.isfinite(v)
    if ok.sum() < 4:
        return {}
    base, peak = float(np.nanmin(v)), float(np.nanmax(v))
    amp = peak - base
    peak_i = int(np.nanargmax(v))
    level = base + 0.2 * amp
    rising = np.flatnonzero(ok & (v >= level) & (np.arange(len(v)) <= peak_i))
    falling = np.flatnonzero(ok & (v >= level) & (np.arange(len(v)) >= peak_i))
    return {
        f"{prefix}_base": base, f"{prefix}_peak": peak, f"{prefix}_amp": amp,
        f"{prefix}_peak_doy": dates[peak_i].dayofyear,
        f"{prefix}_sos_doy": dates[rising[0]].dayofyear if len(rising) else np.nan,
        f"{prefix}_eos_doy": dates[falling[-1]].dayofyear if len(falling) else np.nan,
        f"{prefix}_integral": float(np.nansum(np.clip(v - base, 0, None))),
        f"{prefix}_slope_up": float(np.nanmax(np.diff(v[:peak_i + 1]))) if peak_i > 0 else np.nan,
        f"{prefix}_slope_down": float(np.nanmin(np.diff(v[peak_i:]))) if peak_i < len(v) - 1 else np.nan,
    }
The two slope features are worth their place: a cereal senesces sharply and a grass does not, and that difference survives between years better than an absolute date.
Example 3 — evaluate honestly
import numpy as np, pandas as pd
from sklearn.ensemble import RandomForestClassifier
from sklearn.model_selection import GroupKFold, cross_val_predict
from sklearn.metrics import confusion_matrix, classification_report

def evaluate(X, y, groups, n_splits=5):
    clf = RandomForestClassifier(n_estimators=500, min_samples_leaf=2,
                                 class_weight="balanced_subsample", random_state=0)
    pred = cross_val_predict(clf, X, y, groups=groups,
                             cv=GroupKFold(n_splits), n_jobs=-1)
    labels = sorted(np.unique(y))
    cm = pd.DataFrame(confusion_matrix(y, pred, labels=labels),
                      index=labels, columns=labels)
    print(cm.to_string())
    print()
    print(classification_report(y, pred, labels=labels, zero_division=0))

    off = cm.values.copy()
    np.fill_diagonal(off, 0)
    i, j = np.unravel_index(off.argmax(), off.shape)
    print(f"largest confusion: {labels[i]} predicted as {labels[j]} "
          f"({off[i, j]} of {cm.values[i].sum()})")
    return cm
Printing the largest off-diagonal cell by name is a small thing that focuses the next iteration far better than an accuracy figure does.
Explanation
Why the calendar has to be fixed
A classifier needs the same feature in the same column for every sample. Raw observations arrive on different dates for different fields — different orbits, different cloud — so a raw stack has a column that means "the fourth clear date", which is not a variable. Interpolating onto a fixed grid makes column four mean "1 April" for everybody.
Why field-grouped validation matters so much
A 25-hectare field at 20 m resolution is about 600 pixels, all of the same crop, all highly correlated. A random pixel split puts most fields in both sets, so the model is tested on pixels it has effectively seen. The reported accuracy then measures memorisation, and the gap between a pixel split and a field split is routinely several percentage points.
Why thermal time transfers between years
A model trained on calendar features learns "wheat peaks in early June". In a cold year wheat peaks in late June, and the model fails. A model trained on thermal features learns "wheat peaks at 1,400 degree days", which is a property of the crop. Expressing the phenology metrics in degree days is the cheapest way to make a model portable across seasons.
Why the confusion matrix names the fix
Two winter cereals confused with each other need a feature that separates them — often a single early-spring or late-senescence date, or a red-edge index at booting. A cereal confused with grassland needs a better mask or a longer series. The overall accuracy cannot tell you which problem you have, and the matrix can.
Edge cases or notes
- Class imbalance is severe. A minor crop with thirty fields needs weighting or resampling.
- The training labels come from a declaration, which is the intended crop, not always the grown one.
- Mixed fields exist. A field-median feature for a field with two crops is neither.
- Cover crops confuse everything in the shoulder seasons.
- Grassland is a continuum, not a class.
- Different years need different models unless the features are thermal.
- Report per-class recall. Overall accuracy is dominated by the commonest crop.
- Record the dates and the calendar grid with the model.
Internal links
- Crop phenology and growing seasons explained — the curve the features summarise
- Vegetation indices explained: NDVI, EVI, NDRE and when each fails — which index to stack
- A crop classifier confuses two crops every year — reading the confusion matrix
- Growing degree days explained — making features transfer between years
- Spatial leakage explained — why a random split inflates the score
- How to do spatial cross-validation in Python — the block split
- How to handle class imbalance in a spatial classifier — minor crops
- How to build an NDVI time series for a polygon in Python — assembling the series
FAQ
Can I classify crops from a single image?
No. At peak canopy most crops look alike. What separates them is the shape of the season, which needs a time series.
How do I handle irregular observation dates?
Interpolate each field's series onto a fixed calendar — ten-day steps through the season — so every field has the same feature vector.
Why is my accuracy so high in testing and poor in practice?
Almost certainly a random pixel split. Fields are large and internally correlated; use GroupKFold on the field identifier.
Which classifier should I use?
A random forest or gradient boosting is fine. The classifier is rarely the limiting factor; the features and the validation are.
How do I make a model work in a different year?
Express the phenology features in accumulated degree days rather than calendar days.
What should I report?
The confusion matrix and per-class recall. Overall accuracy is dominated by the commonest crop and hides the pair that is actually failing.