
Field boundary data explained: where it comes from
Problem statement
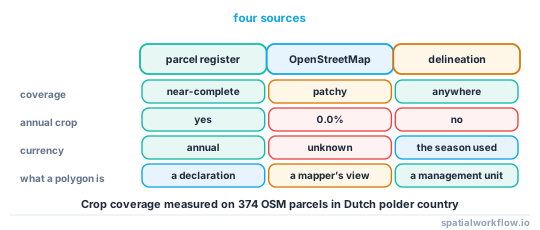
Almost every agricultural analysis is per field, and the field boundary is the one layer you are least likely to have. There are four sources — a national agricultural parcel register, OpenStreetMap, a commercial product, or delineation from imagery — and they differ in coverage, in currency, and in what a polygon means.
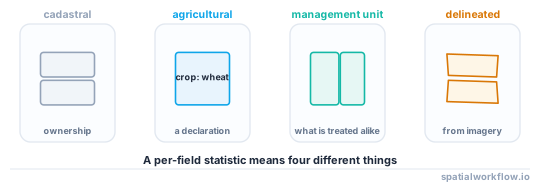
The last of those is the trap. A cadastral parcel is a legal object, an agricultural parcel is a subsidy declaration, an OpenStreetMap landuse=farmland polygon is whatever a mapper drew, and a delineated field is a management unit. They overlap and they are not the same thing, and a yield figure per "field" means four different things depending on which you used.
Quick answer
Check what you actually have before using it:
import numpy as np, geopandas as gpd

f = gpd.read_file("fields.gpkg").to_crs(28992)
f["area_ha"] = f.area / 1e4
f["compactness"] = 4 * np.pi * f.area / (f.length ** 2)

print(f"{len(f):,} parcels; median {f.area_ha.median():.2f} ha, "
      f"max {f.area_ha.max():.1f} ha, total {f.area_ha.sum():,.0f} ha")
print(f"under 0.5 ha: {(f.area_ha < 0.5).sum()} ({(f.area_ha < 0.5).mean():.1%})")
print(f"compactness below 0.3: {(f.compactness < 0.3).sum()} "
      f"({(f.compactness < 0.3).mean():.1%})")
print(f"with a crop attribute: {f['crop'].notna().mean():.1%}")
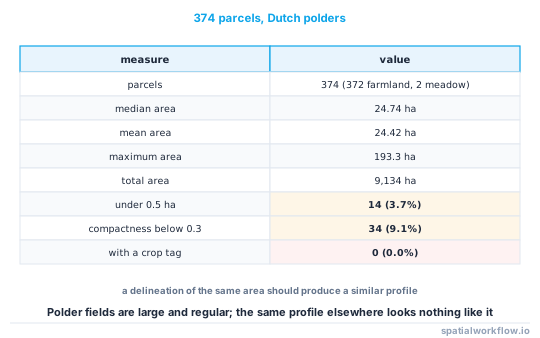
On 374 OpenStreetMap farmland and meadow parcels in Dutch polder country: a median of 24.74 ha, a maximum of 193.3 ha, 3.7% under half a hectare, 9.1% with a compactness below 0.3, and 0.0% carrying a crop tag.
Step-by-step solution
1. Try the national agricultural parcel register first
Most European countries publish the parcels declared for subsidy under the Integrated Administration and Control System — the Netherlands' BRP, Germany's InVeKoS, France's RPG, Denmark's Markkort. They are annual, they carry a crop code, and they cover essentially all commercial agriculture. Where one exists, nothing else comes close.
2. Know what OpenStreetMap gives you
Good geometry where somebody has mapped it, no crop attribute in practice, no currency guarantee, and polygons drawn to whatever definition the mapper used. In the reference extract not one of 374 parcels had a crop tag. It is a usable geometry source and not an agricultural dataset.
3. Understand the difference between the parcel types
| type | defined by | changes when | carries a crop |
|---|---|---|---|
| cadastral parcel | land ownership | ownership changes | no |
| agricultural parcel | a subsidy declaration | the declaration changes | yes, annually |
| management unit | what the farmer treats alike | the farmer decides | implicitly |
| delineated field | image segmentation | the imagery changes | no |
4. Expect a year in the attribute, not in the geometry
Agricultural parcels are declared annually. The geometry is often stable and the crop is not, so a boundary layer without a year is a boundary layer whose crop attribute belongs to an unknown season.
5. Screen for the artefacts before using the layer
Slivers, ribbons along roads, duplicated polygons and multipart records with parts kilometres apart are all common. Area and compactness catch most of them in two lines.
6. Decide about internal features
Tracks, ditches, headlands, pylons and ponds may be inside the polygon or cut out of it. That decision changes every per-hectare figure, and it differs between sources.
7. Delineate from imagery only when you must
Segmentation from a time series works and produces management units rather than legal parcels, which is often what you want. It also merges adjacent fields with the same crop and splits fields with within-field variation — see Delineated field boundaries merge fields or swallow roads.
Code examples
Example 1 — profile a boundary layer
import numpy as np, geopandas as gpd, pandas as pd

def profile_fields(path, crs=28992, crop_col=None):
    f = gpd.read_file(path).to_crs(crs)
    f = f[~f.geometry.is_empty & f.geometry.notna()]
    f["area_ha"] = f.area / 1e4
    f["perimeter_m"] = f.length
    f["compactness"] = 4 * np.pi * f.area / (f.length ** 2)
    parts = f.explode(index_parts=False)

    out = {
        "features": len(f), "parts": len(parts),
        "multipart": int((parts.groupby(level=0).size() > 1).sum()),
        "area_ha_median": round(float(f.area_ha.median()), 2),
        "area_ha_mean": round(float(f.area_ha.mean()), 2),
        "area_ha_max": round(float(f.area_ha.max()), 1),
        "area_ha_total": round(float(f.area_ha.sum())),
        "under_0.5_ha": int((f.area_ha < 0.5).sum()),
        "compactness_median": round(float(f.compactness.median()), 3),
        "compactness_below_0.3": int((f.compactness < 0.3).sum()),
        "invalid": int((~f.geometry.is_valid).sum()),
        "overlapping_pairs": int(len(gpd.sjoin(f, f, predicate="overlaps")) // 2),
    }
    if crop_col:
        out["crop_present"] = round(float(f[crop_col].notna().mean()), 3)
        out["crop_classes"] = int(f[crop_col].nunique())
    return out

print(profile_fields("fields.gpkg", crop_col="crop"))
{'features': 374, 'parts': 374, 'multipart': 0, 'area_ha_median': 24.74,
'area_ha_mean': 24.42, 'area_ha_max': 193.3, 'area_ha_total': 9134,
'under_0.5_ha': 14, 'compactness_median': 0.561, 'compactness_below_0.3': 34,
'crop_present': 0.0, 'crop_classes': 0}
A median of 24.74 ha and a maximum of 193.3 ha is characteristic of reclaimed polder land; the same profile on English or Italian farmland looks nothing like it, which is why the screening thresholds have to be local.
Example 2 — flag the artefacts explicitly
import numpy as np, geopandas as gpd

def flag_artefacts(f, min_area_ha=0.5, min_compactness=0.3, max_area_ha=500):
    f = f.copy()
    f["area_ha"] = f.area / 1e4
    f["compactness"] = 4 * np.pi * f.area / (f.length ** 2)
    f["flag_sliver"] = f.area_ha < min_area_ha
    f["flag_ribbon"] = f.compactness < min_compactness
    f["flag_huge"] = f.area_ha > max_area_ha
    f["flag_invalid"] = ~f.geometry.is_valid
    f["flag_multipart"] = f.geometry.geom_type == "MultiPolygon"
    flags = [c for c in f.columns if c.startswith("flag_")]
    f["n_flags"] = f[flags].sum(axis=1)
    print(f[flags].sum().to_string())
    return f
Flagging rather than dropping keeps the decision visible. A ribbon polygon along a road is usually an artefact and occasionally a genuine strip field.
Example 3 — reconcile two sources
import geopandas as gpd

def compare_sources(a, b, crs=28992, min_overlap=0.5):
    a, b = a.to_crs(crs), b.to_crs(crs)
    j = gpd.overlay(a[["geometry"]].assign(aid=range(len(a))),
                    b[["geometry"]].assign(bid=range(len(b))), how="intersection")
    j["frac_a"] = j.area / j["aid"].map(a.area)
    matched = j[j.frac_a >= min_overlap]
    print(f"A: {len(a):,} parcels, B: {len(b):,}")
    print(f"A parcels matching one B parcel by >{min_overlap:.0%}: "
          f"{matched.aid.nunique():,} ({matched.aid.nunique()/len(a):.1%})")
    print(f"A parcels split across several B parcels: "
          f"{(j.groupby('aid').size() > 1).sum():,}")
    return j
Running this between a subsidy register and a delineation is the fastest way to see the difference between a declared parcel and a management unit: a large declared parcel routinely splits into two or three management units and vice versa.
Explanation
Why a subsidy register is the best source where it exists
It is compulsory, annual, geometrically maintained, and it carries the crop the farmer declared. Nothing assembled from imagery or volunteers matches that combination. Its weaknesses are that it only covers claimed land, that the declared crop is the intended crop rather than the grown one, and that the parcel is an administrative unit that may bundle two management units together.
Why OpenStreetMap has geometry but no crop
landuse=farmland is a land-cover tag, drawn by people mapping what a field looks like from imagery. The crop tag exists and is almost never used, because a crop changes every year and nobody maintains it — zero of 374 parcels in the reference extract carried one. Treat OSM as a geometry source for regions with no register, and expect to attach the crop yourself.
Why compactness catches so much
A real field is a reasonably convex shape enclosing area efficiently. The ratio 4πA/P² is 1 for a circle and around 0.6–0.8 for a rectangular field; a ribbon along a road, a sliver between two polygons and a mis-digitised boundary all fall far below. The reference layer's median of 0.561 with 9.1% below 0.3 is a typical signature of a hand-mapped layer.
Why the year matters more than the geometry
Field geometry changes slowly — boundaries move when hedges are removed or fields amalgamated. The crop changes every year, and in many systems twice. A boundary layer used with a crop attribute from the wrong year gives a classification accuracy assessment that measures the rotation rather than the classifier.
Edge cases or notes
- Headlands may be inside or outside. It changes every per-hectare number.
- Tracks and ditches are cut out of some registers and not others.
- Grassland is often absent from arable-focused datasets.
- Rented land crosses ownership boundaries. Cadastral parcels do not follow management.
- Sub-field strips are common in trials and in strip cropping.
- Greenhouses and orchards are agricultural and behave nothing like arable.
- Check for overlaps. Two registers of the same year should not overlap and sometimes do.
- Record the source, the year and the parcel definition with the layer.
Internal links
- How to delineate field boundaries from imagery in Python — when there is no register
- Delineated field boundaries merge fields or swallow roads — what delineation gets wrong
- How to classify crop types from a satellite time series — what the crop attribute trains
- Management zones explained — subdividing the field
- How to download OpenStreetMap data in Python — fetching the geometry
- Polygon coverage and topology explained — overlaps and gaps between parcels
- How to fix gaps and overlaps in a polygon coverage — cleaning the layer
- Spatial data quality dimensions — currency, completeness and consistency
FAQ
Where do field boundaries come from?
A national agricultural parcel register where one exists, otherwise OpenStreetMap, a commercial product, or delineation from imagery. Only the first two carry a crop attribute, and in practice only the first.
Does OpenStreetMap have crop information?
Almost never. In a 374-parcel Dutch extract, not one carried a crop tag.
What is the difference between a cadastral and an agricultural parcel?
A cadastral parcel is defined by ownership; an agricultural parcel by a subsidy declaration. They frequently do not coincide, and only the second carries a crop.
How do I spot bad polygons in a boundary layer?
Area and compactness. In the reference layer, 3.7% were under half a hectare and 9.1% had a compactness below 0.3.
Does the year of the boundary layer matter?
The geometry changes slowly; the crop changes annually. Using a crop attribute from the wrong year measures the rotation rather than whatever you were testing.
Can I delineate fields from imagery instead?
Yes, and the result is management units rather than legal parcels — often what you want, but it merges adjacent fields with the same crop.