
A yield map has impossible values and stripes
Problem statement
The map shows 60 t/ha of wheat in one corner, a negative value in another, a stripe down every third pass and a bright halo around the entire headland. None of it is plausible and all of it has a specific mechanical cause.
The distinction that matters is between values that are impossible and values that are merely wrong. An impossible value — negative, or several times the crop's physical maximum — is a broken record. A stripe is a systematic error in a term of the yield calculation, and removing the points does not fix the underlying bias in the rest of the pass.
Quick answer
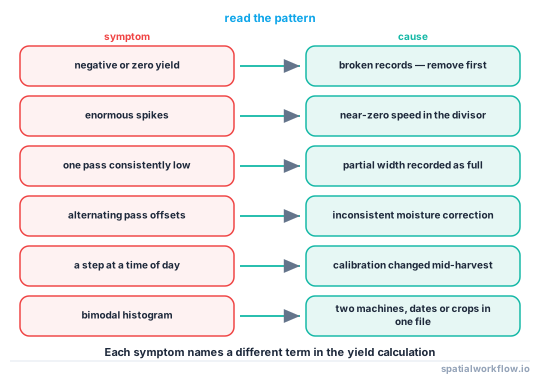
Diagnose before cleaning, because the pattern names the cause:
import numpy as np, pandas as pd

print(y["yield_t_ha"].describe(percentiles=[.001, .01, .5, .99, .999]).round(2))
print(f"negative or zero: {(y.yield_t_ha <= 0).sum():,}")
print(f"above 3x the median: {(y.yield_t_ha > 3 * y.yield_t_ha.median()).sum():,}")
print(f"speed below 1 km/h: {(y.speed_kmh < 1).sum():,}")
print(f"partial swath: {(y.swath_m < y.swath_m.max()).mean():.1%}")

# is the variation between passes or within them?
between = y.groupby("pass_id")["yield_t_ha"].mean().var()
within = y.groupby("pass_id")["yield_t_ha"].var().mean()
print(f"between-pass variance {between:.3f}, within-pass {within:.3f}, "
      f"ratio {between / within:.2f}")
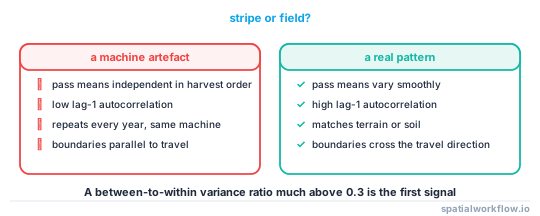
A between-to-within variance ratio much above about 0.3 means the passes differ from each other more than the field varies along them, which is the definition of a stripe.
Step-by-step solution
1. Impossible values first
Negative yield, zero yield with a non-zero flow, and anything above about three times the crop's realistic maximum. These are broken records and they distort every statistic used to find the subtler problems.
2. Very low or very high speed
Yield is mass flow divided by speed times width. At 0.2 km/h the divisor is almost zero and the yield is enormous; above about 12 km/h the machine is in transport and not harvesting.
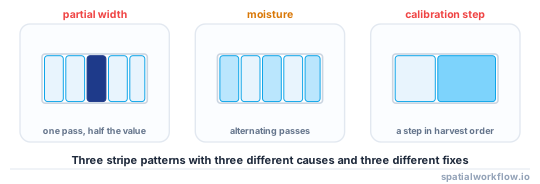
3. Stripes aligned with the passes
Three causes, distinguishable by their pattern:
| pattern | cause |
|---|---|
| one pass consistently low, others normal | partial header width recorded as full |
| alternating passes offset by a few percent | moisture correction differing between passes |
| a step at a time of day | calibration changed mid-harvest |
4. A halo around the headland
Start and stop transients, turning, and partial width all concentrate at the ends of passes. Reconstruct the passes and trim the first and last few points of each.
5. Smearing along the direction of travel
The sensor lag of ten to twenty seconds displaces every value by 14–44 m at normal speeds. It shows as a boundary that is blurred in the direction of travel and sharp across it.
6. Two populations in the histogram
A bimodal distribution usually means two combines, two harvest dates, or two crops in one file. Split before cleaning.
7. Check the total against the weighbridge
The one external check. A map total that differs from the delivered tonnage by more than about 10% means the calibration, the swath assumption or the moisture basis is wrong — a bias that cleaning will not remove.
Code examples
Example 1 — the diagnostic report
import numpy as np, pandas as pd

def diagnose_yield(y, crop_max=20.0):
    n = len(y)
    r = {"points": n}
    v = y["yield_t_ha"]

    r["negative_or_zero"] = int((v <= 0).sum())
    r["above_crop_max"] = int((v > crop_max).sum())
    r["p999"] = round(float(v.quantile(0.999)), 2)
    r["median"] = round(float(v.median()), 2)

    if "speed_kmh" in y:
        r["speed_under_1"] = int((y.speed_kmh < 1).sum())
        r["speed_over_12"] = int((y.speed_kmh > 12).sum())
    if "swath_m" in y:
        full = y.swath_m.max()
        r["partial_swath_share"] = round(float((y.swath_m < 0.95 * full).mean()), 3)
    if "pass_id" in y:
        between = float(y.groupby("pass_id")[v.name].mean().var())
        within = float(y.groupby("pass_id")[v.name].var().mean())
        r["between_within_ratio"] = round(between / within, 3) if within else None
    if "moisture_pct" in y and "pass_id" in y:
        m = y.groupby("pass_id")["moisture_pct"].mean()
        r["moisture_range_between_passes"] = round(float(m.max() - m.min()), 2)
    if "timestamp" in y:
        hourly = y.set_index("timestamp")[v.name].resample("1h").mean()
        r["largest_hourly_step"] = round(float(hourly.diff().abs().max()), 2)

    for k, val in r.items():
        print(f"{k:32} {val}")
    return r
Example 2 — separate a stripe from a real pattern
import numpy as np, pandas as pd

def stripe_test(y, value="yield_t_ha", pass_col="pass_id"):
    """A stripe is between-pass variation that does not follow the field."""
    g = y.groupby(pass_col)
    means = g[value].mean()
    order = g["timestamp"].min().sort_values().index      # harvest order

    lag1 = means.loc[order].autocorr(lag=1)
    print(f"{len(means)} passes; between-pass sd {means.std():.3f} t/ha")
    print(f"autocorrelation of pass means in harvest order: {lag1:+.3f}")
    if lag1 < 0.2:
        print("! pass means are nearly independent in harvest order — "
              "this looks like a machine artefact, not a field pattern")
    else:
        print("pass means vary smoothly across the field — probably real")
    return {"between_pass_sd": float(means.std()), "lag1_autocorr": float(lag1)}
A real field pattern varies smoothly across adjacent passes, so the pass means are autocorrelated in spatial order. A machine artefact is independent from pass to pass, which is what the test detects.
Example 3 — the weighbridge check
def weighbridge_check(y, delivered_t, area_ha, value="yield_t_ha"):
    mapped = float(y[value].mean() * area_ha)
    factor = delivered_t / mapped
    verdict = ("good" if 0.95 <= factor <= 1.05
               else "acceptable" if 0.90 <= factor <= 1.10
               else "the calibration, swath or moisture basis is wrong")
    print(f"map {mapped:.1f} t, delivered {delivered_t:.1f} t, "
          f"factor {factor:.3f} — {verdict}")
    return factor
A factor of 1.28 is not a scaling problem to be divided away; it means the machine was measuring something other than what was delivered, and the same error will recur next year unless the calibration is fixed.
Explanation
Why partial width produces a one-sided stripe
The monitor divides measured mass by an assumed area. On a half-width pass the true area is half the assumed one, so the recorded yield is half the true value. That is a 50% error on one pass — far larger than any sensor error — and it appears as a single consistently low stripe rather than as scattered noise, because it affects the whole pass.
Why moisture produces alternating stripes
Yield is reported at a standard moisture. If the correction differs between passes — a drifting sensor, or a manual entry changed part way through the day — each pass carries a different multiplicative offset. Since passes are harvested in order and moisture usually falls through the day, the pattern often alternates or trends with the harvest sequence rather than with the field.
Why the headland halo is unavoidable without trimming
At the end of every pass the machine slows, stops, turns and restarts. Flow decays and rebuilds over several seconds, the swath is partial on the turn, and the position is changing quickly. All of the affected points are at the ends of passes, so they form a ring. No statistical filter can distinguish them from real headland variation; only the pass geometry can.
Why the weighbridge check cannot be skipped
Calibration error, a wrong swath setting and a wrong moisture basis all scale the entire map. Nothing internal to the map reveals them, because every internal statistic is affected equally. The delivered tonnage is the only independent measurement in the whole system.
Edge cases or notes
- Split by date and machine first. A bimodal histogram is usually two of something.
- Crop maximum is crop-specific. 20 t/ha is absurd for wheat and low for sugar beet.
- Zero yield with zero flow is correct — the machine was not harvesting.
- Real headland effects exist. Trimming removes the artefact and the signal together.
- Moisture basis must be stated. Dry-matter and standard-moisture yields differ by 15%.
- A stripe that repeats every year is the machine, not the field.
- Keep the removed points as evidence.
- Fix the calibration rather than scaling the map, or it recurs.
Internal links
- How to clean yield monitor data in Python — the cleaning pipeline
- Yield monitor data explained: what the numbers really are — where each artefact comes from
- How to remove spatial outliers in Python — the local rule
- Management zones explained — why uncleaned yield makes bad zones
- How to clean a GPS track in Python — reconstructing the passes
- Track has impossible speeds — the speed filter
- Repair, reject or flag — deciding what to do with bad rows
- How to build a data cleaning report in GeoPandas — reporting what was removed
FAQ
Why does my yield map have negative values?
Broken records — a sensor fault, a zero-speed division, or a calibration with a negative intercept. Remove them before computing anything.
What causes stripes down a yield map?
Partial header width recorded as full (one low stripe), an inconsistent moisture correction (alternating stripes), or a calibration change mid-harvest (a step).
How do I tell a stripe from a real field pattern?
Check whether the pass means are autocorrelated in spatial order. A real pattern varies smoothly between adjacent passes; an artefact does not.
Why is the headland always brighter or darker?
Start and stop transients, turning and partial width all concentrate there. Trim the first and last few points of each pass.
My map total is 25% above the weighbridge. Should I scale it?
No. That size of error means the calibration, the swath setting or the moisture basis is wrong, and scaling hides a problem that will recur.
Why is my histogram bimodal?
Usually two combines, two harvest dates or two crops in one file. Split before cleaning.