
A crop classifier confuses two crops every year
Problem statement
The overall accuracy is 88% and a single pair of classes accounts for most of the errors. Winter wheat is predicted as winter barley, or spring barley as spring oats, or a cover crop as grassland — and adding more trees, more features or a different classifier changes nothing.
That is the signature of a problem the model cannot solve: the two classes are genuinely similar in the features provided. Either the feature that separates them is missing, or the dates that would show it were cloudy, or the labels themselves are unreliable for one of the pair.
Quick answer
Read the confusion matrix, then look at the two classes' mean profiles:
import numpy as np, pandas as pd
from sklearn.metrics import confusion_matrix

labels = sorted(np.unique(y))
cm = pd.DataFrame(confusion_matrix(y, pred, labels=labels), index=labels, columns=labels)

off = cm.values.copy()
np.fill_diagonal(off, 0)
i, j = np.unravel_index(off.argmax(), off.shape)
print(f"largest confusion: {labels[i]} → {labels[j]} "
      f"({off[i, j]} of {cm.values[i].sum()}, {off[i, j] / cm.values[i].sum():.1%})")

for a, b in [(labels[i], labels[j])]:
    pa = X[y == a].mean(axis=0)
    pb = X[y == b].mean(axis=0)
    sep = np.abs(pa - pb) / np.sqrt((X[y == a].var(axis=0) + X[y == b].var(axis=0)) / 2)
    print("best separating feature:", feature_names[int(np.nanargmax(sep))],
          f"(effect size {np.nanmax(sep):.2f})")
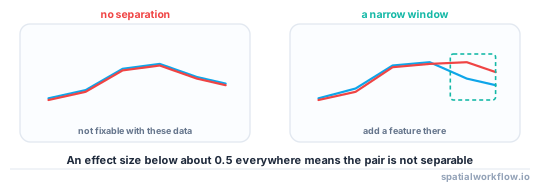
An effect size below about 0.5 on every feature means the pair is not separable with what you have. Above 1.5 on one date means the information is there and the model is not using it, which is a different problem with a different fix.
Step-by-step solution
1. Confirm it is one pair, not general noise
A confusion matrix with one large off-diagonal cell is a different problem from one with errors spread everywhere. The first is a feature problem; the second is usually a labelling or a validation problem.
2. Plot the two classes' mean temporal profiles
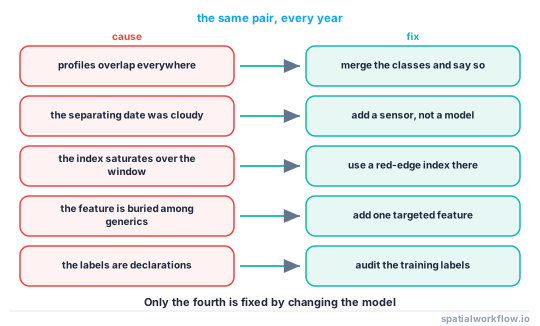
If they overlap everywhere, no classifier can separate them. If they diverge on two dates in April, the model has the information and the features are burying it.
3. Check whether the separating date was cloudy
Two cereals differ most at heading and at senescence, which are narrow windows. If the nearest clear observation is three weeks away, the interpolated value at the critical date is an average of the two sides of the gap. Count the clear observations near each class's divergence.
4. Check the index for saturation over the critical window
Two cereals at heading are both at full canopy, where NDVI is flat — on a real scene, 55.9% of vegetation pixels were above 0.8 and the field-median sat between 0.770 and 0.776 for eighteen days. NDRE varied over 0.264 across fields in the same period.
5. Add a feature that targets the difference
A red-edge index at heading, a shortwave index at senescence, the slope of the falling limb, or the date each class reached a thermal threshold. One targeted feature usually beats a hundred generic ones.
6. Check the labels
Declared crop is the intended crop. A field declared as barley and sown with wheat is a permanently mislabelled training sample, and a pair of similar crops is exactly where declaration errors concentrate.
7. If it still cannot be separated, merge the classes
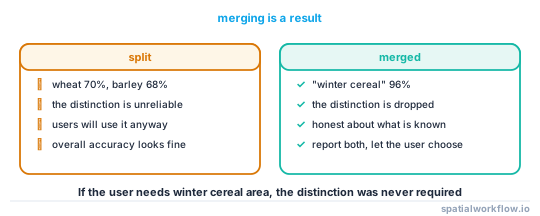
A "winter cereal" class that is 96% accurate is more useful than wheat and barley classes that are each 70% accurate. Merging is a legitimate result, and it should be reported as one.
Code examples
Example 1 — the separability report for a pair
import numpy as np, pandas as pd

def separability(X, y, a, b, feature_names, dates=None):
    A, B = X[y == a], X[y == b]
    mu_a, mu_b = A.mean(axis=0), B.mean(axis=0)
    pooled = np.sqrt((A.var(axis=0) + B.var(axis=0)) / 2)
    effect = np.abs(mu_a - mu_b) / np.where(pooled == 0, np.nan, pooled)

    df = pd.DataFrame({"feature": feature_names,
                       f"mean_{a}": mu_a.round(3), f"mean_{b}": mu_b.round(3),
                       "effect_size": effect.round(3)})
    if dates is not None:
        df["date"] = dates
    df = df.sort_values("effect_size", ascending=False)
    print(df.head(8).to_string(index=False))
    print(f"\nn({a}) = {len(A)}, n({b}) = {len(B)}; "
          f"max effect size {np.nanmax(effect):.2f}")
    if np.nanmax(effect) < 0.5:
        print("! these classes are not separable with these features")
    return df
Example 2 — is the critical date observed?
import numpy as np, pandas as pd

def observation_support(sep_df, observed_dates, window_days=7, top_n=3):
    obs = pd.DatetimeIndex(observed_dates)
    rows = []
    for _, r in sep_df.head(top_n).iterrows():
        d = pd.Timestamp(r["date"])
        near = np.abs((obs - d).days) <= window_days
        gaps = np.diff(np.sort(obs)).astype("timedelta64[D]").astype(int)
        rows.append({"date": str(d.date()), "effect_size": r["effect_size"],
                     "clear_obs_within_7d": int(near.sum()),
                     "days_to_nearest": int(np.abs((obs - d).days).min()),
                     "largest_season_gap": int(gaps.max())})
    df = pd.DataFrame(rows)
    print(df.to_string(index=False))
    if (df["clear_obs_within_7d"] == 0).any():
        print("! the most separating date has no nearby clear observation")
    return df
A separating date with no clear observation within a week is an argument for adding a sensor — Landsat, or a radar series — rather than for tuning the model.
Example 3 — targeted features, and merging as a fallback
import numpy as np, pandas as pd
from sklearn.metrics import classification_report

def add_targeted_features(series, dates, window, index="ndre"):
    """Mean, slope and range of one index within a specific window."""
    d = pd.DatetimeIndex(dates)
    sel = (d >= pd.Timestamp(window[0])) & (d <= pd.Timestamp(window[1]))
    sub = series[:, sel]
    return {
        f"{index}_mean_{window[0]}": np.nanmean(sub, axis=1),
        f"{index}_slope_{window[0]}": np.nanmean(np.diff(sub, axis=1), axis=1),
        f"{index}_range_{window[0]}": np.nanmax(sub, axis=1) - np.nanmin(sub, axis=1),
    }

def merge_classes(y, pred, groups):
    """groups: {'winter cereal': ['winter wheat', 'winter barley'], ...}"""
    remap = {old: new for new, olds in groups.items() for old in olds}
    ym = np.array([remap.get(v, v) for v in y])
    pm = np.array([remap.get(v, v) for v in pred])
    print(classification_report(ym, pm, zero_division=0))
    return ym, pm
Reporting both the split and the merged result is the honest way to present it: the reader can see what was gained by merging and decide whether the distinction mattered to them.
Explanation
Why more model capacity does not help
A classifier can only separate classes that are separated in the feature space. If two crops' feature distributions overlap almost completely, the Bayes-optimal error rate is high, and a random forest, a gradient booster and a neural network will all converge on roughly the same accuracy. The flat response to model changes is itself the diagnosis.
Why two cereals are the hardest pair
Winter wheat and winter barley are sown within weeks of each other, reach full canopy at the same time and senesce within a fortnight of each other. The differences that exist — barley heads earlier and senesces earlier — are expressed in narrow windows, which optical satellites may or may not observe, and both crops are at full canopy for the period when observations are most reliable.
Why declared labels concentrate errors on similar pairs
A farmer who intended barley and sowed wheat rarely amends the declaration, and a declaration covering a parcel with two crops carries only one. Both errors fall disproportionately on similar crops, because those are the ones substituted for each other. A model trained on such labels learns the confusion.
Why merging is a result rather than a retreat
A classification is used for something: an area statistic, a rotation analysis, an input-demand estimate. If the user needs "winter cereal area" and the model gives it at 96%, the wheat-barley distinction was never required. Reporting the merged accuracy alongside the split one lets the user make that call rather than the modeller.
Edge cases or notes
- One large off-diagonal cell is a feature problem; scattered errors are usually labels.
- Check both directions. Wheat → barley and barley → wheat can differ a lot.
- Class imbalance inflates one direction. Use balanced weights before concluding.
- Radar is unaffected by cloud and separates cereals reasonably well.
- Sub-field mixtures cannot be resolved by a field-level classifier.
- Cover crops confuse everything in the shoulder seasons.
- Report per-class recall, not overall accuracy.
- Publish the merged result too when merging is the recommendation.
Internal links
- How to classify crop types from a satellite time series — the pipeline
- Crop phenology and growing seasons explained — where the classes diverge
- Vegetation indices explained: NDVI, EVI, NDRE and when each fails — the index over the critical window
- How to extract phenology metrics from an NDVI time series — targeted features
- How to handle class imbalance in a spatial classifier — the other reason one direction dominates
- How to evaluate a spatial model in Python — reading the metrics
- Field boundary data explained: where it comes from — where the labels come from
- Spatial leakage explained — if the accuracy is high and the field performance is not
FAQ
Why does my classifier always confuse the same two crops?
Because they are genuinely similar in the features provided. Check the effect size between their mean profiles: below about 0.5 everywhere, no model can separate them.
Will a better model fix it?
No. A flat response to model changes is the diagnosis, not a tuning problem.
What feature would separate two cereals?
A red-edge index at heading or the slope of the senescence limb — the narrow windows where they differ. One targeted feature beats a hundred generic ones.
What if the separating date was cloudy?
Then the information is not in the data. Add another sensor — Landsat, or a radar series — rather than tuning the model.
Could the labels be wrong?
Often. Declared crop is the intended crop, and substitution errors concentrate exactly on similar pairs.
Is merging the two classes acceptable?
Yes, and it is often the right answer. A 96% accurate "winter cereal" class is more useful than two 70% classes. Report both.