
Growing degree days explained
Problem statement
Crops develop on a thermal clock, not a calendar one, which is why the same variety flowers three weeks apart in two consecutive years. Growing degree days are the standard accumulator for that clock — and there are at least four different ways to compute them, with no convention about which is meant.
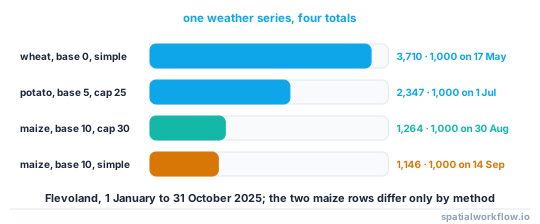
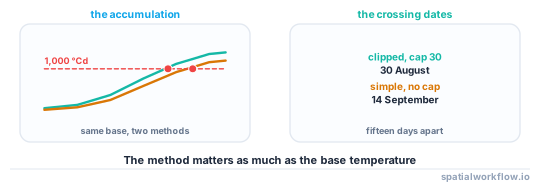
The differences are not small. On a real 2025 daily series for the Dutch polders, the same base temperature of 10 °C gave 1,264 °Cd with a 30 °C cap and clipped minima and 1,146 °Cd with the simple average and no cap — a 10% difference from the method alone. More sharply, the date on which 1,000 °Cd was reached differed by 15 days: 30 August against 14 September.
Quick answer
State the base, the cap and the method, every time:
import numpy as np

def gdd(tmax, tmin, base=10.0, upper=30.0, method="average"):
    if method == "average":                       # clip both ends, then average
        return np.maximum((np.minimum(tmax, upper) + np.maximum(tmin, base)) / 2 - base, 0)
    return np.maximum((tmax + tmin) / 2 - base, 0)   # simple, no cap

cumulative = np.cumsum(gdd(tmax, tmin, base=10, upper=30, method="average"))
The "average" method clips the daily maximum at the upper threshold and raises the daily minimum to the base before averaging, which is the standard for maize. The "simple" method averages first and subtracts the base, which is the standard for small grains. Both are correct; they are not interchangeable.
Step-by-step solution
1. Choose the base temperature for the crop
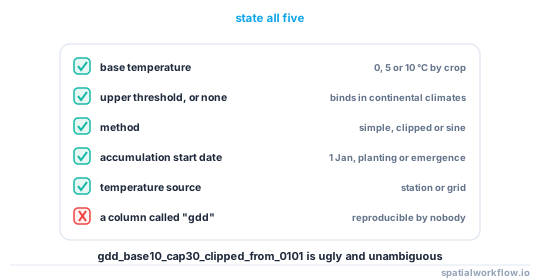
The base is the temperature below which development effectively stops. Common values: 0 °C for winter wheat and barley, 5 °C for potato and sugar beet, 10 °C for maize, soybean and sunflower. It is a crop property, not a regional one.
2. Choose the upper threshold, or decide not to have one
Above about 30 °C, development in most temperate crops stops accelerating and eventually slows. A cap models that crudely. In a cool maritime climate the cap rarely binds; in a continental one it changes the total substantially.
3. Choose the method
- Simple average —
(Tmax + Tmin)/2 − base, floored at zero. Used for small grains. - Clipped average (Method 1) — clip Tmax at the upper threshold and raise Tmin to the base, then average. The US maize standard.
- Single or double sine — fit a sine through the daily extremes and integrate above the base. More faithful, needs more code, and is what entomological models usually use.
4. Pick the start date deliberately
Accumulation from 1 January, from planting, from emergence and from a fixed calendar date all appear in the literature. A total quoted without its start date cannot be compared with anything.
5. Get the temperature from a defensible source
A station within a few kilometres, a gridded reanalysis, or an interpolated national product. Daily extremes from a reanalysis are smoothed and typically underestimate the daily range, which biases every GDD method that uses the extremes separately.
6. Accumulate and report the thresholds, not just the total
The useful output is the date each development stage's requirement was met, not the season sum. On the reference series, base 10 with a cap reached 1,000 °Cd on 30 August; the same base with the simple method reached it on 14 September.
7. Write the parameters into the column name
gdd_base10_cap30_clipped_from_0101 is ugly and unambiguous. gdd is neither.
Code examples
Example 1 — fetch a real daily series and accumulate
import json, urllib.request, numpy as np, pandas as pd

def daily_weather(lat, lon, start, end):
    url = ("https://archive-api.open-meteo.com/v1/archive"
           f"?latitude={lat}&longitude={lon}&start_date={start}&end_date={end}"
           "&daily=temperature_2m_max,temperature_2m_min&timezone=UTC")
    with urllib.request.urlopen(url, timeout=120) as r:
        d = json.loads(r.read())["daily"]
    t = pd.DataFrame(d).rename(columns={"temperature_2m_max": "tmax",
                                        "temperature_2m_min": "tmin"})
    t["time"] = pd.to_datetime(t["time"])
    return t

t = daily_weather(52.49, 5.60, "2025-01-01", "2025-10-31")
print(f"{len(t)} days, {t.time.min().date()} → {t.time.max().date()}")

for base, upper, method, label in [
        (10, 30, "average", "maize, base 10, cap 30, clipped"),
        (10, 99, "simple",  "maize, base 10, no cap, simple"),
        (0,  99, "simple",  "wheat, base 0, simple"),
        (5,  25, "average", "potato, base 5, cap 25, clipped")]:
    g = gdd(t.tmax.values, t.tmin.values, base, upper, method)
    cum = np.cumsum(g)
    reached = (t.time[np.searchsorted(cum, 1000)].date()
               if cum[-1] >= 1000 else "not reached")
    print(f"{label:34} total {cum[-1]:7.0f} °Cd; 1000 °Cd on {reached}")
304 days, 2025-01-01 → 2025-10-31
maize, base 10, cap 30, clipped total 1264 °Cd; 1000 °Cd on 2025-08-30
maize, base 10, no cap, simple total 1146 °Cd; 1000 °Cd on 2025-09-14
wheat, base 0, simple total 3710 °Cd; 1000 °Cd on 2025-05-17
potato, base 5, cap 25, clipped total 2347 °Cd; 1000 °Cd on 2025-07-01
The two maize rows are the same crop and the same base; only the method differs, and it is worth 118 °Cd and fifteen days.
Example 2 — the single sine method
import numpy as np

def gdd_sine(tmax, tmin, base=10.0, upper=None):
    """Integrate a half-sine fitted through the daily extremes, above the base."""
    tmax, tmin = np.asarray(tmax, float), np.asarray(tmin, float)
    if upper is not None:
        tmax = np.minimum(tmax, upper)
    amp = (tmax - tmin) / 2
    avg = (tmax + tmin) / 2
    out = np.zeros_like(avg)

    below = tmax <= base
    above = tmin >= base
    out[above] = (avg - base)[above]

    mid = ~below & ~above
    a, m = amp[mid], avg[mid]
    theta = np.arcsin(np.clip((base - m) / np.where(a == 0, 1e-9, a), -1, 1))
    out[mid] = ((m - base) * (np.pi / 2 - theta) + a * np.cos(theta)) / np.pi
    return out
The sine method matters most in shoulder seasons, where the daily mean is below the base but the afternoon is above it — the simple methods score those days as zero and the sine method does not.
Example 3 — gridded degree days from a reanalysis
import xarray as xr, numpy as np

def gdd_grid(ds, base=10.0, upper=30.0, tmax="tasmax", tmin="tasmin"):
    tx = ds[tmax] - 273.15 if float(ds[tmax].max()) > 200 else ds[tmax]
    tn = ds[tmin] - 273.15 if float(ds[tmin].max()) > 200 else ds[tmin]
    daily = (np.minimum(tx, upper) + np.maximum(tn, base)) / 2 - base
    daily = daily.clip(min=0)
    out = daily.cumsum("time")
    out.attrs = {"long_name": "cumulative growing degree days",
                 "units": "degree_Celsius day", "base_c": base, "upper_c": upper,
                 "method": "clipped average", "accumulation_start": str(ds.time.values[0])}
    return out
The Kelvin check is worth having: reanalysis temperatures are usually in Kelvin, and a GDD computed from Kelvin with a base of 10 accumulates about 263 degree days per day.
Explanation
Why the method changes the total so much
The simple average scores a day with Tmax 26 and Tmin 6 as (26+6)/2 − 10 = 6. The clipped average raises the minimum to the base first: (26+10)/2 − 10 = 8. On cool nights — which is most of a temperate spring and autumn — the clipped method scores substantially more, which is exactly the 118 °Cd difference measured above. Neither is wrong; they model different assumptions about whether development stops at night.
Why the base is a crop constant and the cap is a climate decision
The base reflects the temperature at which a species' development rate becomes negligible, which is physiology. The cap reflects where the rate stops increasing, which is also physiology, but whether it ever binds depends on the climate — in a maritime summer a 30 °C cap affects a handful of days, and in a continental one it affects most of July.
Why reanalysis extremes are biased
A gridded product averages over a cell, and the daily maximum of a spatial average is lower than the average of the daily maxima. The daily range is therefore compressed, which affects every method that uses the extremes separately — the clipped average most, since it depends on where the minimum sits relative to the base.
Why to report dates rather than totals
A season total is a summary of the weather. What an agronomist uses is the date each stage's thermal requirement was met, because that is what determines when to scout, spray or harvest. Reporting the crossing dates also makes the method dependence visible, which a single total hides.
Edge cases or notes
- Kelvin. Convert before accumulating, or the numbers are absurd.
- Missing days break a cumulative sum. Interpolate or gap-report, do not skip.
- Frost resets nothing. GDD never decreases; a damaging frost is a separate event.
- The start date is part of the definition. Quote it.
- Photothermal models exist for crops where day length matters as much as temperature.
- Soil temperature drives emergence better than air temperature does.
- Station versus grid can differ by several percent over a season.
- Put the parameters in the column name.
gddalone is not reproducible.
Internal links
- How to calculate growing degree days from gridded weather — the gridded implementation
- Crop phenology and growing seasons explained — what the thermal clock predicts
- How to extract phenology metrics from an NDVI time series — the observed counterpart
- How to classify crop types from a satellite time series — where thermal time improves the features
- Gridded and climate data explained — the reanalysis container
- How to resample a time series in xarray — daily aggregation from hourly data
- How to compute climatologies and anomalies with xarray — comparing a season with normal
- How to standardise dates in spatial data with Python — the accumulation start date
FAQ
What are growing degree days?
An accumulator of temperature above a crop-specific base, used as a thermal clock for crop development instead of the calendar.
What base temperature should I use?
0 °C for winter cereals, 5 °C for potato and sugar beet, 10 °C for maize, soybean and sunflower. It is a crop property.
Does the calculation method matter?
Yes. On a real 2025 series, base 10 gave 1,264 °Cd with a cap and clipping and 1,146 °Cd with the simple average — and the 1,000 °Cd threshold was crossed fifteen days apart.
Should I use an upper threshold?
If the climate reaches it. In a maritime summer a 30 °C cap affects a few days; in a continental one it changes the season total substantially.
Where do I get daily temperatures?
A nearby station, a gridded reanalysis or a national interpolated product. Reanalysis daily ranges are compressed, which biases the clipped methods.
What should I publish?
The dates thresholds were crossed, along with the base, the cap, the method and the accumulation start date — not just a season total.