
How to calculate growing degree days from gridded weather
Problem statement
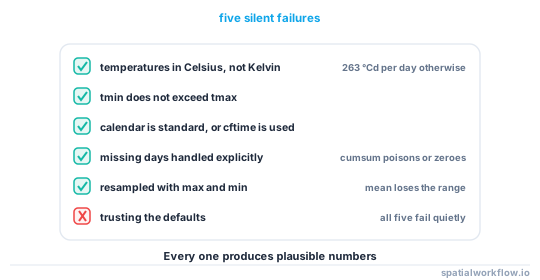
Growing degree days from a point are a few lines of arithmetic. From a grid they are the same arithmetic plus four things that go wrong quietly: temperatures in Kelvin, a calendar that pandas cannot index, an accumulation that must not skip missing days, and an output that nobody can reproduce because the base, the cap and the method were not recorded.
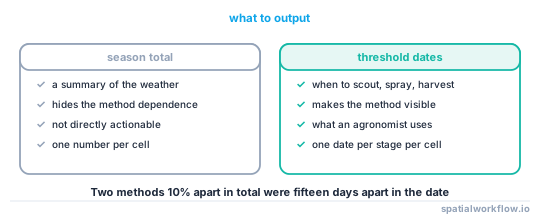
The parameters matter as much as the data. On a real 2025 daily series for the Dutch polders, base 10 with a 30 °C cap and clipped minima gave 1,264 °Cd while base 10 with the simple average and no cap gave 1,146 — and the date on which 1,000 °Cd was reached differed by fifteen days.
Quick answer
import xarray as xr, numpy as np

def gdd_grid(ds, tmax="tasmax", tmin="tasmin", base=10.0, upper=30.0,
             method="clipped"):
    tx, tn = ds[tmax], ds[tmin]
    if float(tx.max()) > 200:                        # Kelvin
        tx, tn = tx - 273.15, tn - 273.15

    if method == "clipped":
        daily = (np.minimum(tx, upper) + np.maximum(tn, base)) / 2 - base
    else:
        daily = (tx + tn) / 2 - base
    daily = daily.clip(min=0)

    out = daily.cumsum("time")
    out.attrs = {"long_name": "cumulative growing degree days",
                 "units": "degree_Celsius day", "base_c": base, "upper_c": upper,
                 "method": method,
                 "accumulation_start": str(np.datetime_as_string(ds.time.values[0], "D"))}
    return out
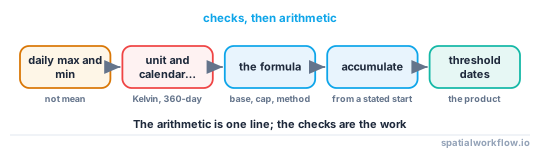
The Kelvin check is not defensive programming. A GDD computed from Kelvin with a base of 10 accumulates roughly 263 degree days per day and reaches every threshold on the first date.
Step-by-step solution
1. Get daily extremes, not hourly means
GDD needs the daily maximum and minimum. From hourly data, resample with max and min — not mean, which loses the range the formula depends on.
2. Check the units
Reanalysis temperatures are usually Kelvin. Convert once, at the top, and assert the range afterwards.
3. Check the calendar
Climate model output often uses a 360-day or a no-leap calendar, which pandas cannot index. xr.decode_cf(use_cftime=True) gives cftime objects that xarray can group and accumulate; converting to a standard calendar loses or invents days.
4. Handle missing days explicitly
cumsum treats NaN as NaN and poisons everything after it, or, with skipna=True, silently treats a missing day as zero. Neither is right without a decision — interpolate short gaps, and flag long ones.
5. Accumulate from a stated start
1 January, the planting date, or emergence. Whichever it is, it belongs in the attributes, because a total without it is not comparable.
6. Extract the threshold dates, not just the total
The useful product is the date each stage's requirement was met, per grid cell. That is a searchsorted along the time axis.
7. Write the parameters into the output
Base, cap, method and start date, in the variable attributes and in the file name. gdd.nc is not a reproducible artefact.
Code examples
Example 1 — from a point series, with the method comparison
import json, urllib.request, numpy as np, pandas as pd

def daily_weather(lat, lon, start, end):
    url = ("https://archive-api.open-meteo.com/v1/archive"
           f"?latitude={lat}&longitude={lon}&start_date={start}&end_date={end}"
           "&daily=temperature_2m_max,temperature_2m_min&timezone=UTC")
    with urllib.request.urlopen(url, timeout=120) as r:
        d = json.loads(r.read())["daily"]
    t = pd.DataFrame(d).rename(columns={"temperature_2m_max": "tmax",
                                        "temperature_2m_min": "tmin"})
    t["time"] = pd.to_datetime(t["time"])
    return t

def gdd(tmax, tmin, base=10.0, upper=30.0, method="clipped"):
    if method == "clipped":
        return np.maximum((np.minimum(tmax, upper) + np.maximum(tmin, base)) / 2 - base, 0)
    return np.maximum((tmax + tmin) / 2 - base, 0)

t = daily_weather(52.49, 5.60, "2025-01-01", "2025-10-31")
for base, upper, method, label in [
        (10, 30, "clipped", "maize, base 10, cap 30, clipped"),
        (10, 99, "simple",  "maize, base 10, no cap, simple"),
        (0,  99, "simple",  "wheat, base 0, simple"),
        (5,  25, "clipped", "potato, base 5, cap 25, clipped")]:
    cum = np.cumsum(gdd(t.tmax.values, t.tmin.values, base, upper, method))
    reached = (t.time[np.searchsorted(cum, 1000)].date()
               if cum[-1] >= 1000 else "not reached")
    print(f"{label:34} total {cum[-1]:7.0f} °Cd; 1000 °Cd on {reached}")
maize, base 10, cap 30, clipped total 1264 °Cd; 1000 °Cd on 2025-08-30
maize, base 10, no cap, simple total 1146 °Cd; 1000 °Cd on 2025-09-14
wheat, base 0, simple total 3710 °Cd; 1000 °Cd on 2025-05-17
potato, base 5, cap 25, clipped total 2347 °Cd; 1000 °Cd on 2025-07-01
Example 2 — the gridded version, with the checks
import xarray as xr, numpy as np

def prepare(ds, tmax="tasmax", tmin="tasmin"):
    problems = []
    tx, tn = ds[tmax], ds[tmin]

    if float(tx.max()) > 200:
        tx, tn = tx - 273.15, tn - 273.15
        problems.append("converted from Kelvin")
    if float(tx.min()) < -90 or float(tx.max()) > 60:
        problems.append(f"implausible range {float(tx.min()):.1f} to {float(tx.max()):.1f} °C")
    if bool((tn > tx).any()):
        problems.append(f"{int((tn > tx).sum())} cells where tmin exceeds tmax")

    cal = ds.time.encoding.get("calendar", "standard")
    if cal not in ("standard", "gregorian", "proleptic_gregorian"):
        problems.append(f"non-standard calendar: {cal}")

    expected = int((ds.time.values[-1] - ds.time.values[0]) /
                   np.timedelta64(1, "D")) + 1 if cal in ("standard", "gregorian") else None
    if expected and len(ds.time) != expected:
        problems.append(f"{expected - len(ds.time)} missing days")

    return tx, tn, problems

tx, tn, problems = prepare(ds)
for p in problems:
    print("!", p)
Example 3 — threshold dates per grid cell
import xarray as xr, numpy as np

def threshold_date(cum, threshold):
    """First date at which the cumulative GDD reaches a threshold, per cell."""
    reached = cum >= threshold
    idx = reached.argmax("time")
    ever = reached.any("time")
    times = cum["time"].values
    out = xr.DataArray(
        np.where(ever, times[np.clip(idx.values, 0, len(times) - 1)],
                 np.datetime64("NaT")),
        dims=idx.dims, coords=idx.coords, name=f"date_at_{threshold:g}_gdd")
    out.attrs = {"threshold_gdd": threshold, **{k: v for k, v in cum.attrs.items()
                                                if k in ("base_c", "upper_c", "method",
                                                         "accumulation_start")}}
    return out

cum = gdd_grid(ds, base=10, upper=30, method="clipped")
for thr in (500, 1000, 1500):
    d = threshold_date(cum, thr)
    frac = float((~np.isnat(d)).mean())
    print(f"{thr} °Cd reached in {frac:.1%} of cells; "
          f"median date {np.datetime_as_string(np.nanmedian(d.values.astype('datetime64[D]').astype(float)).astype('datetime64[D]'), 'D') if frac else 'n/a'}")
Carrying the base, cap, method and start date into the threshold-date variable's attributes is what makes the output usable by somebody who did not run the code.
Explanation
Why mean is the wrong resampler
The GDD formulae use the daily maximum and minimum separately, because the clipped method raises the minimum to the base before averaging. Resampling hourly data with mean gives the daily mean, from which the clipped method cannot be computed at all and the simple method gives a different answer from one computed on the true extremes.
Why reanalysis grids compress the daily range
A grid cell is a spatial average, and the maximum of an average is smaller than the average of the maxima. A reanalysis therefore reports a lower daily maximum and a higher daily minimum than a station in the same cell. That matters most for the clipped method, where the minimum's position relative to the base determines the result.
Why cumsum needs a decision about missing days
cumsum with skipna=False propagates a single NaN to every later day; with skipna=True it treats the missing day as contributing zero, which silently under-accumulates. Neither is a default anyone should accept. Interpolating gaps of one or two days and flagging longer ones makes the choice explicit and recorded.
Why the threshold date is the product
A season total is a summary of the weather. What is acted on is the date a stage was reached — when to scout, when to apply, when to expect harvest. Producing a grid of dates rather than a grid of totals also makes the method dependence visible, because two methods that differ by 10% in total differ by fifteen days in the date.
Edge cases or notes
- Kelvin. Check and convert before anything else.
tmin > tmaxhappens in some products and indicates a bad cell.- 360-day calendars need cftime; do not convert them away.
- Leap years shift day-of-year comparisons by one after February.
- Soil temperature predicts emergence better than air temperature.
- Chunk along time for a cumulative sum; chunking along space makes it slow.
- Accumulation start is part of the definition. Put it in the attributes.
- Name the file with the parameters.
gdd_base10_cap30_clipped_2025.nc.
Internal links
- Growing degree days explained — the methods and why they differ
- Crop phenology and growing seasons explained — what the thermal clock predicts
- How to extract phenology metrics from an NDVI time series — the observed counterpart
- How to classify crop types from a satellite time series — thermal features that transfer between years
- How to open NetCDF files with xarray in Python — reading the reanalysis
- cftime and datetime errors in xarray — non-standard calendars
- How to resample a time series in xarray — hourly to daily extremes
- NetCDF values look wrong — units and scaling
FAQ
How do I compute growing degree days from a gridded dataset?
Get daily maxima and minima, convert from Kelvin if needed, apply the chosen formula, clip at zero and accumulate along time — recording the base, cap, method and start date in the attributes.
Can I resample hourly data with mean?
No. The formulae use the daily maximum and minimum separately; resample with max and min.
Why are my degree days enormous?
Almost certainly Kelvin. With a base of 10, Kelvin temperatures accumulate about 263 degree days per day.
How do I handle missing days?
Decide explicitly: interpolate short gaps and flag long ones. cumsum either poisons everything after a NaN or silently treats it as zero.
Does the method really change the answer?
Yes. Base 10 with a cap and clipping gave 1,264 °Cd on a real series against 1,146 with the simple average — and the 1,000 °Cd date differed by fifteen days.
What should I output?
A grid of threshold dates rather than a grid of totals, with the base, cap, method and accumulation start in the attributes.