
How to Estimate the Probability of an Earthquake from a Catalogue in Python
On this page
Problem statement
"What is the chance of a magnitude 7 here in the next 30 years?" is the question behind building codes, insurance and emergency plans, and the simplest honest answer comes from a catalogue: count how often such earthquakes have happened, treat them as a Poisson process, and convert the rate into a probability for the period of interest. Each step has a trap. Large earthquakes are rare, so their own rate is uncertain and is often extrapolated from smaller ones with the Gutenberg-Richter law; earthquakes cluster, so the Poisson assumption holds only after aftershocks are set aside; and a probability over 30 years is not the rate times 30.
This page uses the USGS catalogue of every magnitude 7 or larger earthquake since 1900 to test the Poisson model on the world's largest events, then estimates the probability of a magnitude 7 or larger in a box around Japan both from its own record and from the rate of magnitude 5 earthquakes, and converts return periods into probabilities.
Quick answer
Count events to get a yearly rate λ for each magnitude threshold, then the probability of at least one event in T years is 1 − exp(−λT):
for mag in (7.0, 7.5, 8.0):
    n = int((jp.mag >= mag).sum())
    lam = n / YEARS_JP
    print(f"M{mag}+: {n:>2} in {YEARS_JP} years, rate {lam:.3f} a year; P(at least one) in 1 year {1 - np.exp(-lam):.1%}, "
          f"in 30 years {1 - np.exp(-lam * 30):.1%} (rate x 30 = {lam * 30:.1f})")
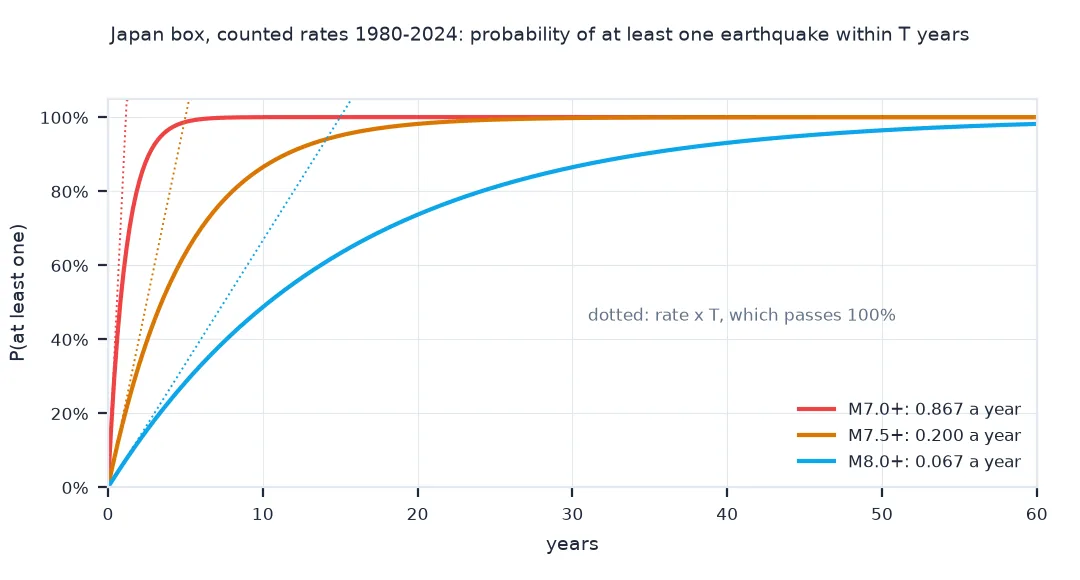
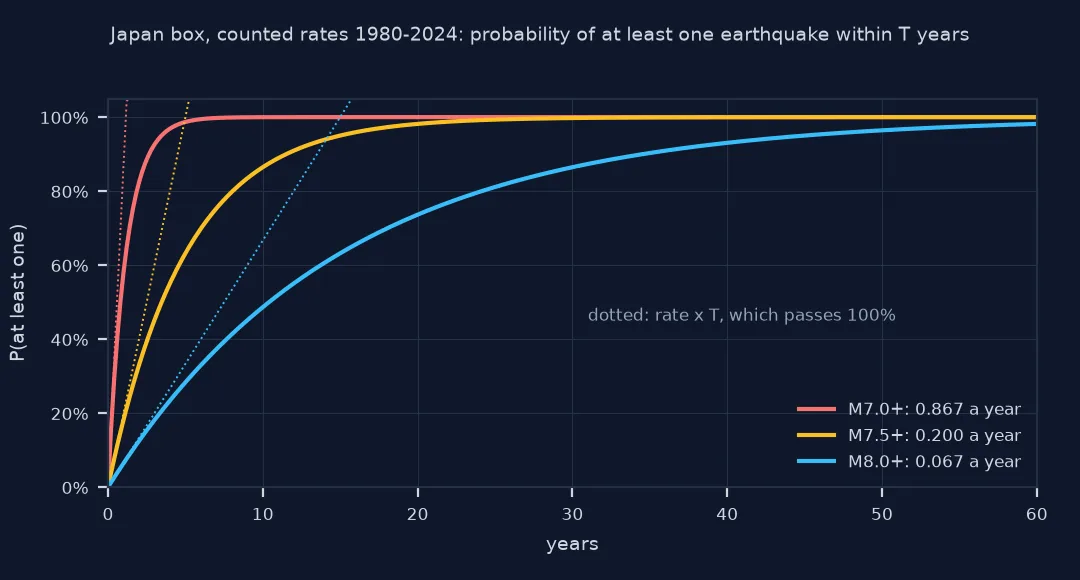
M7.0+: 39 in 45 years, rate 0.867 a year; P(at least one) in 1 year 58.0%, in 30 years 100.0% (rate x 30 = 26.0)
M7.5+: 9 in 45 years, rate 0.200 a year; P(at least one) in 1 year 18.1%, in 30 years 99.8% (rate x 30 = 6.0)
M8.0+: 3 in 45 years, rate 0.067 a year; P(at least one) in 1 year 6.4%, in 30 years 86.5% (rate x 30 = 2.0)
With 39 M7+ earthquakes in 45 years, the Japan box has one in an average year: a 58% chance in any one year, and a certainty in practice over 30 years. Three M8+ earthquakes in 45 years give a rate of 0.067 a year, a 6.4% chance in a year and 86.5% in 30 years. The rate times 30 is 2.0, which would be a meaningless "200%"; the exponential turns it into a probability.
Are yearly counts Poisson, clustering, extrapolation
1. Are yearly counts Poisson?
For a Poisson process the variance of the yearly counts equals their mean. Test it on the global record of magnitude 7 or larger since 1900:
per_year = g7.groupby(g7.time.dt.year).size().reindex(range(1900, 2025), fill_value=0)
print(f"global M7+, 1900-2024: {per_year.sum():,} events; mean {per_year.mean():.2f} a year, variance {per_year.var():.2f}, ratio {per_year.var() / per_year.mean():.2f}")
print(f"fewest {per_year.min()} ({per_year.idxmin()}), most {per_year.max()} ({per_year.idxmax()})")
for a, b in ((1900, 1949), (1950, 1999), (2000, 2024)):
    print(f"{a}-{b}: mean {per_year.loc[a:b].mean():.2f} a year")
global M7+, 1900-2024: 1,591 events; mean 12.73 a year, variance 17.41, ratio 1.37
fewest 4 (1930), most 24 (2010)
1900-1949: mean 12.42 a year
1950-1999: mean 11.98 a year
2000-2024: mean 14.84 a year
The world averages 12.73 M7+ earthquakes a year, from 4 in 1930 to 24 in 2010. The variance, 17.41, is 1.37 times the mean, more variable than a Poisson process, because large earthquakes come with large aftershocks. The rate since 2000, 14.84 a year, is higher than in either half of the twentieth century; with yearly counts this variable, 25 years is short for telling a change in rate from chance.
2. Clustering in time
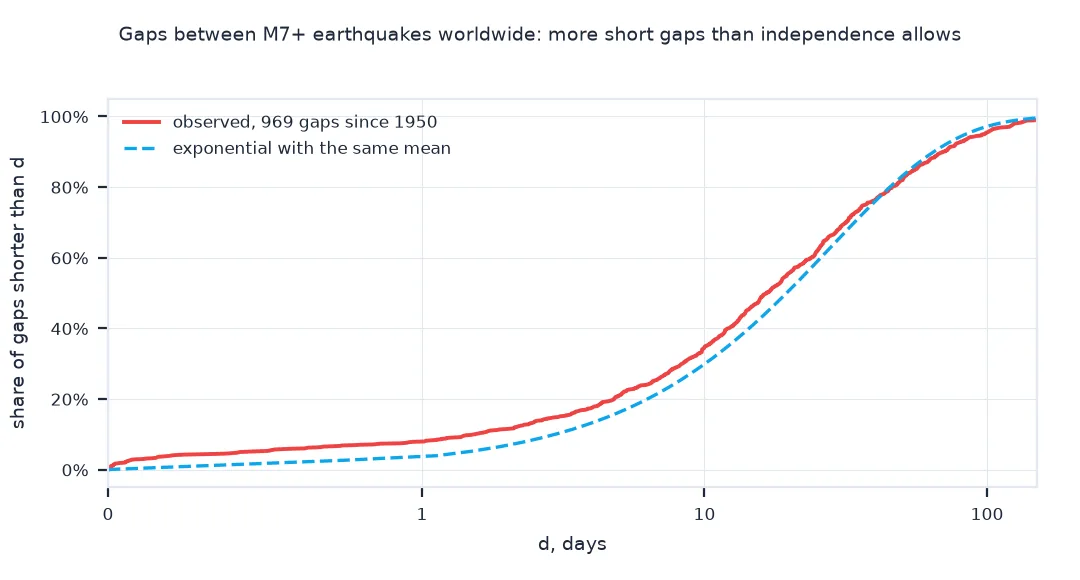
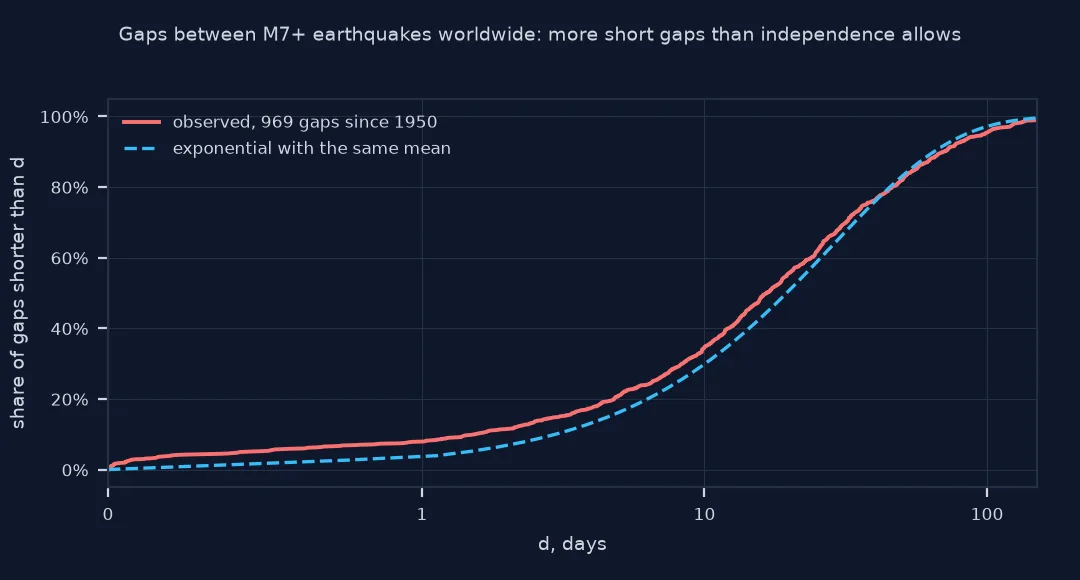
If events were independent, the gaps between them would follow an exponential distribution. Compare short gaps with what the exponential predicts:
gaps = g7.time.sort_values().diff().dropna().dt.total_seconds() / 86400
recent = g7[g7.time.dt.year >= 1950].time.sort_values().diff().dropna().dt.total_seconds() / 86400
rate = 1 / recent.mean()
for d in (1, 7, 30):
    print(f"gaps under {d:>2} days since 1950: observed {(recent < d).mean():.1%}, exponential {1 - np.exp(-rate * d):.1%}")
print(f"mean gap since 1950 {recent.mean():.1f} days; median {recent.median():.1f} days")
gaps under 1 days since 1950: observed 7.8%, exponential 3.5%
gaps under 7 days since 1950: observed 26.1%, exponential 22.0%
gaps under 30 days since 1950: observed 68.0%, exponential 65.5%
mean gap since 1950 28.2 days; median 16.6 days
If M7+ earthquakes were independent, 3.5% of the gaps between them would be shorter than a day; 7.8% are, more than twice as many. At a week and a month the excess shrinks, 26.1% against 22.0% and 68.0% against 65.5%: the clustering is mostly in the first days after a large event. The mean gap since 1950 is 28.2 days.
3. Extrapolating from smaller earthquakes
The Japan box has a few dozen M7+ earthquakes since 1980 and only a handful of M8+. Its M5+ record is a hundred times larger; fit b to it and extrapolate:
m5 = jp.mag.round(1)
b = np.log10(np.e) / (m5.mean() - 4.95)
rate5 = len(m5) / YEARS_JP
print(f"M5+: {len(m5):,} events, {rate5:.1f} a year; b = {b:.3f}")
for mag in (7.0, 7.5, 8.0):
    gr = rate5 * 10 ** (-b * (mag - 5))
    counted = (jp.mag >= mag).sum() / YEARS_JP
    print(f"M{mag}+: Gutenberg-Richter {gr:.3f} a year (P in 30 years {1 - np.exp(-gr * 30):.0%}), counted {counted:.3f} ({1 - np.exp(-counted * 30):.0%})")
M5+: 4,290 events, 95.3 a year; b = 1.035
M7.0+: Gutenberg-Richter 0.812 a year (P in 30 years 100%), counted 0.867 (100%)
M7.5+: Gutenberg-Richter 0.247 a year (P in 30 years 100%), counted 0.200 (100%)
M8.0+: Gutenberg-Richter 0.075 a year (P in 30 years 89%), counted 0.067 (86%)
The M5+ record gives b = 1.035. Extrapolated two magnitude units, it predicts 0.812 M7+ earthquakes a year against 0.867 counted, and three units, 0.075 M8+ a year against 0.067 counted: the Gutenberg-Richter line from M5 matches the box's own record of large earthquakes to within about 20% at each threshold, and gives a 30-year probability for M8+ of 89% against 86% from three events.
Return periods and design probabilities
The data used on this page
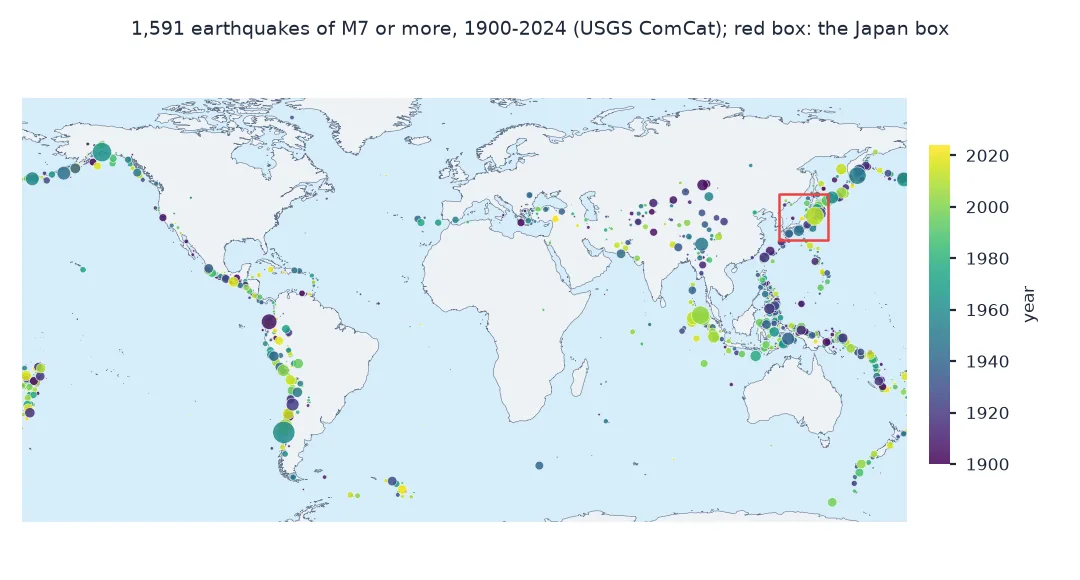
Two queries to the USGS FDSN event service: every earthquake of magnitude 7 or more worldwide from 1900 to 2024, and every earthquake of magnitude 5 or more from 1980 to 2024 between 30° and 46°N and 128° and 148°E, a box around Japan. ComCat's record of the largest earthquakes before 1973 comes mostly from the ISC-GEM catalogue.
from pathlib import Path

import numpy as np
import pandas as pd
import requests

Path("data").mkdir(exist_ok=True)
Q = "https://earthquake.usgs.gov/fdsnws/event/1/query"
def get(name, **params):
    p = Path(f"data/{name}.csv")
    if not p.exists():
        r = requests.get(Q, params=dict(format="csv", orderby="time-asc", **params), timeout=600)
        r.raise_for_status()
        p.write_text(r.text)
    d = pd.read_csv(p)
    assert len(d) < 20000
    d["time"] = pd.to_datetime(d.time).dt.tz_localize(None)
    return d[d["type"] == "earthquake"].reset_index(drop=True)
g7 = get("global_m7_1900_2024", starttime="1900-01-01", endtime="2025-01-01", minmagnitude=7)
jp = get("japan_m5_1980_2024", starttime="1980-01-01", endtime="2025-01-01", minmagnitude=5,
         minlatitude=30, maxlatitude=46, minlongitude=128, maxlongitude=148)
YEARS_JP = 45
jp7 = jp[jp.mag >= 7]
print(f"global M7+ since 1900: {len(g7):,}; Japan box M5+ since 1980: {len(jp):,}, of which M7+: {len(jp7)}, M8+: {(jp.mag >= 8).sum()}")
early = g7[g7.time.dt.year < 1973]
print(f"before 1973: {len(early)} events, {early.net.str.startswith('iscgem').mean():.0%} from ISC-GEM")
global M7+ since 1900: 1,591; Japan box M5+ since 1980: 4,290, of which M7+: 39, M8+: 3
before 1973: 878 events, 92% from ISC-GEM
The world has 1,591 earthquakes of M7 or more in the catalogue since 1900. The Japan box has 4,290 of M5 or more since 1980, 39 of M7 or more and only 3 of M8 or more: the 1994 Kuril (Shikotan) earthquake, M8.3, the 2003 Tokachi-oki earthquake, M8.16, and the 2011 Tohoku earthquake, M9.1. Of the 878 global events before 1973, 92% come from the ISC-GEM catalogue, whose magnitudes were recomputed consistently.
Example 1: return periods and design probabilities
Building codes describe ground motion by its probability of being exceeded in 50 years. Convert between that and the return period, the mean time between exceedances:
for p50 in (0.10, 0.05, 0.02):
    lam50 = -np.log(1 - p50) / 50
    print(f"{p50:.0%} in 50 years = annual rate {lam50:.5f} = return period {1 / lam50:,.0f} years")
print(f"chance a 475-year event happens within 475 years: {1 - np.exp(-1):.1%}")
10% in 50 years = annual rate 0.00211 = return period 475 years
5% in 50 years = annual rate 0.00103 = return period 975 years
2% in 50 years = annual rate 0.00040 = return period 2,475 years
chance a 475-year event happens within 475 years: 63.2%
The familiar design levels follow directly: 10% in 50 years is a 475-year return period, 5% is 975 years and 2% is 2,475 years. And an event with a 475-year return period has a 63.2% chance, not a certainty, of happening within any 475 years.
One parameter, two convenient properties
A Poisson process has one parameter, the rate, and two properties that make it convenient: events are independent, and the number in any period depends only on its length. Under it, the probability of at least one event in T years is 1 − exp(−λT). For small λT this is close to λT, but not for large: an event with a 30-year mean recurrence has a 63% chance, not 100%, of occurring within 30 years. Probabilistic seismic hazard analysis uses exactly this conversion, which is why "2% in 50 years" and "a return period of 2,475 years" describe the same ground motion.
The model fits mainshocks better than catalogues. Large earthquakes trigger others, so raw catalogues contain more short gaps and more variable yearly counts than a Poisson process would produce; hazard models remove aftershocks before computing rates for that reason. And extrapolation with the Gutenberg-Richter law assumes that the same b-value holds up to the largest magnitudes, which fails where the largest earthquakes are characteristic of particular faults or limited by fault size. Both rates on this page come from 45 years of data, so the counted rate of M7 earthquakes rests on a few dozen events and carries a wide uncertainty.
Aftershocks, time-dependent models and area
- Aftershocks: the counted M7+ rate here includes aftershocks: the 2011 Tohoku mainshock was followed by an M7.9 and an M7.7 within 40 minutes and two more M7s by July, and preceded by an M7.3 two days before. A declustered rate is lower.
- Time-dependent models: for individual faults with known last ruptures, renewal models give probabilities that rise with time since the last event; a Poisson model has no memory.
- Magnitude types: old magnitudes in global catalogues are not all moment magnitudes; ISC-GEM recomputed them, which is one reason to use it for the period before 1973.
- Area: the probability belongs to the area counted; a smaller area has a lower rate and a much less certain one.
Internal links
- How to estimate b-value and completeness in Python
- Seismic hazard explained — rates turned into ground motion
- Earthquake catalogues explained: magnitudes, completeness and declustering — aftershocks and completeness
FAQ
How do I calculate the probability of an earthquake in Python?
Estimate the annual rate λ of earthquakes above the magnitude of interest from a catalogue, then compute 1 − exp(−λT) for a period of T years.
What does a 475-year return period mean?
That the event has an annual probability of 1/475, equivalent to a 10% chance of happening at least once in 50 years.
Are earthquakes random in time?
Mainshocks are approximately Poisson; catalogues including aftershocks are clustered, with more short gaps than a Poisson process.
How many magnitude 7 earthquakes happen each year?
In the USGS catalogue, 12.73 a year on average from 1900 to 2024, ranging from 4 in 1930 to 24 in 2010.