
How to Draw an Earthquake Depth Cross-Section in Python
On this page
Problem statement
A map of epicentres flattens the third dimension, and at a subduction zone the third dimension is the point: earthquakes outline the slab of ocean floor sinking under the overriding plate, shallow near the trench and deeper and deeper inland, a band known as the Wadati-Benioff zone. A cross-section shows it. Drawing one means choosing a profile line across the trench, keeping the earthquakes within a set distance of it, projecting each onto the line in a metric coordinate system, and plotting depth against distance with true scale or a stated exaggeration.
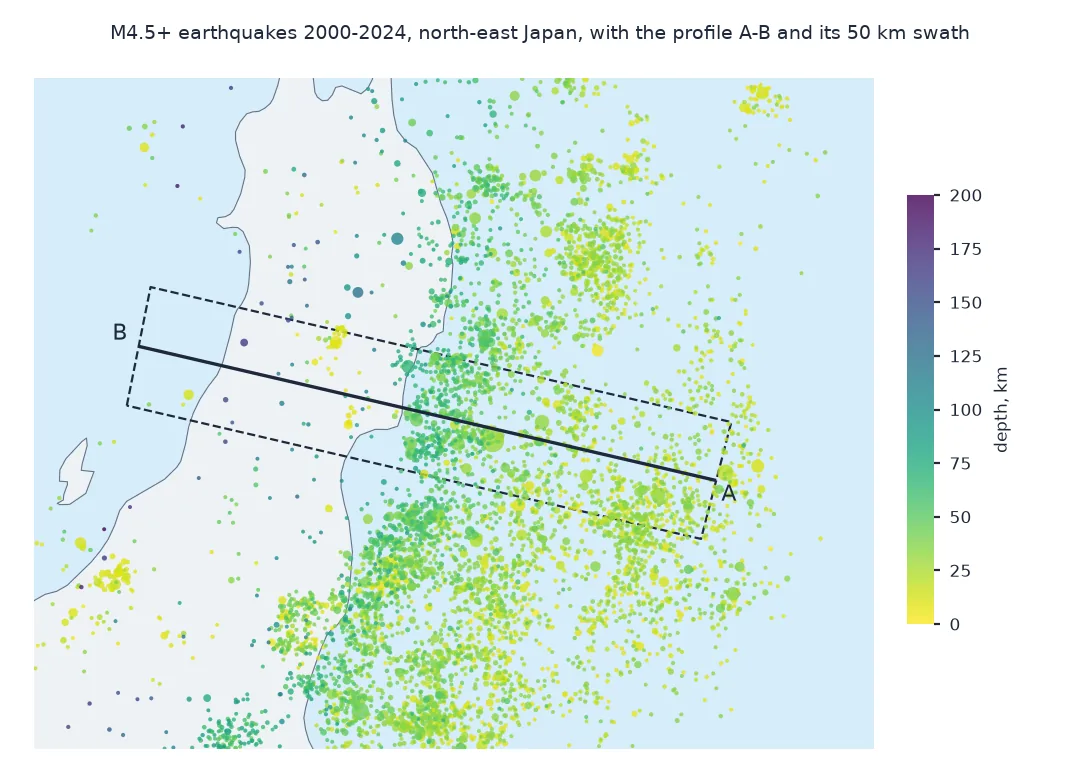
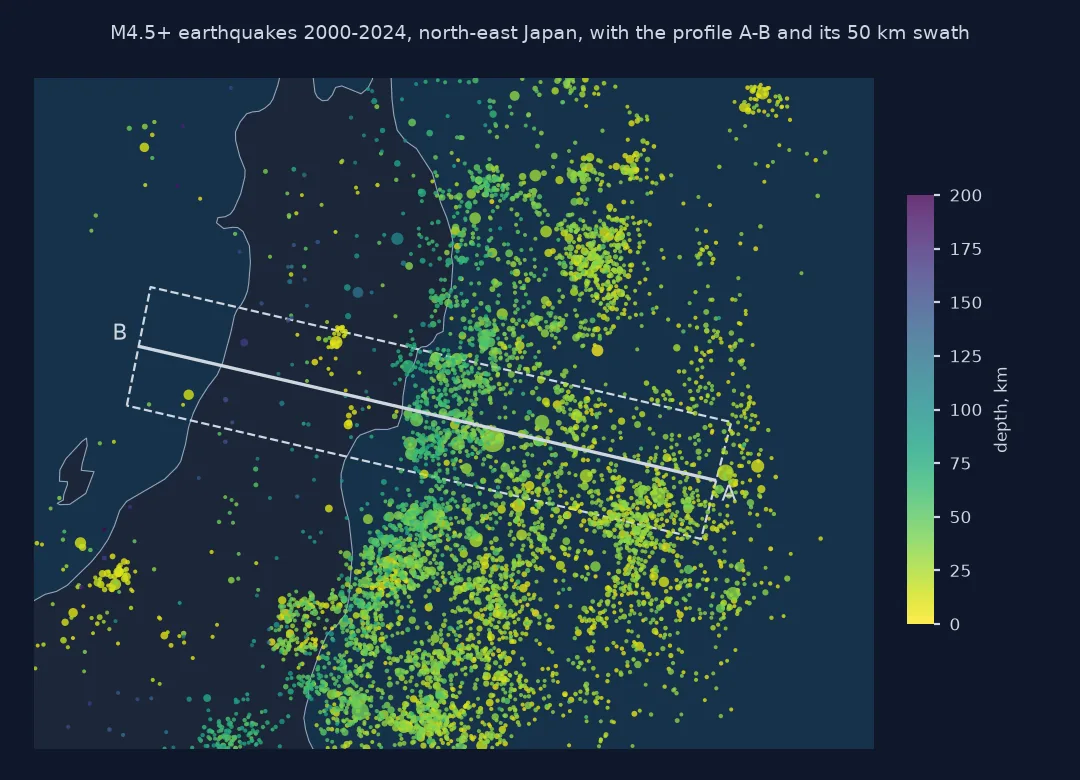
This page takes 25 years of the USGS catalogue for north-east Japan, builds a profile across the Japan Trench at about 38.5°N, projects the hypocentres onto it, estimates the dip of the subducting Pacific plate, and checks how many depths in the catalogue are fixed defaults rather than measurements.
Quick answer
Project the hypocentres onto the profile line in a UTM CRS, keep those within 50 km of it, and plot depth against distance along the line:
P = ev.to_crs(UTM)
P["along_km"] = P.geometry.apply(line.project) / 1000
P["off_km"] = P.distance(line) / 1000
sec = P[(P.off_km <= 50) & (P.along_km > 0) & (P.along_km < line.length / 1000)]
print(f"{len(ev):,} earthquakes M4.5+; {len(sec):,} within 50 km of the {line.length / 1000:.0f} km profile")
print(sec.groupby(pd.cut(sec.along_km, [0, 100, 200, 300, 400, 500])).depth.agg(["size", "median", "max"]).round(0).to_string())
5,819 earthquakes M4.5+; 1,126 within 50 km of the 492 km profile
size median max
along_km
(0, 100] 326 28.0 52.0
(100, 200] 287 34.0 84.0
(200, 300] 456 51.0 100.0
(300, 400] 51 11.0 151.0
(400, 500] 6 92.0 166.0
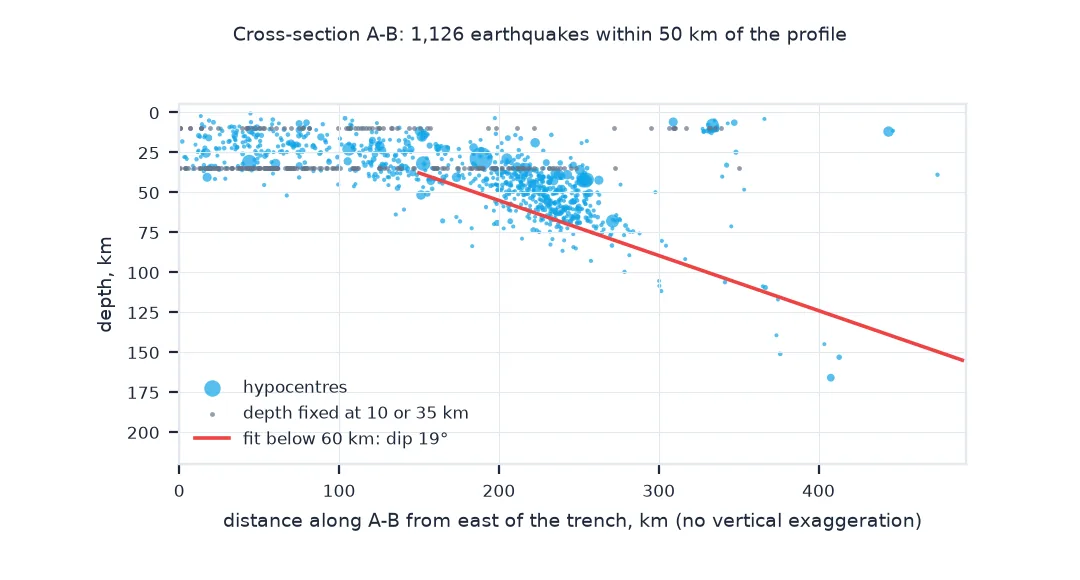
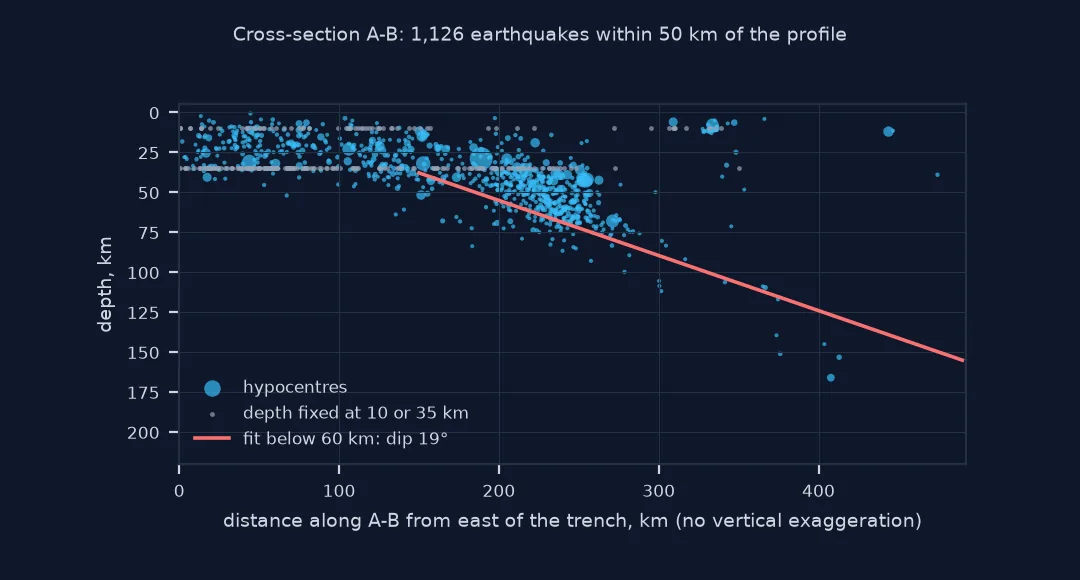
1,126 earthquakes fall within 50 km of the profile. Near the trench, in the first 100 km, the median depth is 28 km and none is deeper than 52 km. Under the coast and the volcanic arc, 200 to 300 km along, the median is 51 km and the deepest reach 100 km; farther west the deepest events reach 151 and 166 km, while most of the events there are shallow crustal earthquakes, with a median of 11 km between 300 and 400 km.
Depth classes, the slab's dip, fixed depths
1. Depth classes
Seismologists divide earthquakes into shallow (to 70 km), intermediate (70 to 300 km) and deep (below 300 km). Count them for the whole box:
cls = pd.cut(ev.depth, [-5, 70, 300, 800], labels=["shallow", "intermediate", "deep"])
print(cls.value_counts().to_dict())
print(f"deepest: {ev.depth.max():.0f} km at {ev.loc[ev.depth.idxmax(), 'latitude']:.2f}N, {ev.loc[ev.depth.idxmax(), 'longitude']:.2f}E")
{'shallow': 5551, 'intermediate': 268, 'deep': 0}
deepest: 202 km at 37.64N, 138.67E
95% of the box's earthquakes, 5,551, are shallow, 268 are intermediate and none is deep. The deepest, at 202 km, is at the western edge of the box, 37.64°N, 138.67°E: the Pacific slab reaches deep-focus depths only farther west.
2. The dip of the slab
West of the coast, earthquakes deeper than about 60 km occur inside the sinking plate. Fit a line to their depth against distance; its slope is the tangent of the dip:
deep = sec[(sec.depth >= 60) & (sec.along_km >= 150)]
slope, icpt = np.polyfit(deep.along_km, deep.depth, 1)
print(f"{len(deep)} events deeper than 60 km; depth = {icpt:.0f} {slope:+.3f} x distance")
print(f"dip of the Wadati-Benioff zone: {np.degrees(np.arctan(slope)):.1f} degrees")
print(f"fit residual: median {np.median(np.abs(deep.depth - (icpt + slope * deep.along_km))):.0f} km")
161 events deeper than 60 km; depth = -14 +0.345 x distance
dip of the Wadati-Benioff zone: 19.0 degrees
fit residual: median 6 km
The 161 events deeper than 60 km and more than 150 km along the profile fall on a line with a slope of 0.345 km per km, a dip of 19.0°, with a median misfit of 6 km. That is an average over 150 to 490 km along the profile; a curved fit or a regional catalogue with more events would show the slab's shape in more detail.
3. Fixed depths
When a depth cannot be resolved, a location is often computed with the depth held at a default value. Those events line up at one depth and are not measurements:
counts = ev.depth.round(1).value_counts()
print("most common depths:", ", ".join(f"{d:g} km ({n})" for d, n in counts.head(5).items()))
print(f"events at exactly 10 km or 35 km: {ev.depth.round(2).isin([10.0, 35.0]).sum()} of {len(ev):,}")
print(f"depth error reported for {ev.depthError.notna().mean():.0%} of events; median {ev.depthError.median():.1f} km")
most common depths: 35 km (800), 10 km (508), 33 km (89), 32 km (19), 11 km (18)
events at exactly 10 km or 35 km: 1295 of 5,819
depth error reported for 76% of events; median 6.5 km
The most common depth in the box is 35 km, held by 800 events, and the second is 10 km, held by 508: 1,295 of the 5,819 earthquakes, 22%, sit at one of these two fixed values, and they make the horizontal stripes on any section of this catalogue. 76% of events report a depth error, with a median of 6.5 km.
The 2011 Tohoku sequence on the section
The data used on this page
Every earthquake of magnitude 4.5 or more from 2000 to 2024 between 36° and 41°N and 138° and 146°E in the USGS ComCat catalogue, from the FDSN event service. The profile runs from 144.5°E, 38.0°N, east of the Japan Trench, west-north-west to 139.0°E, 39.0°N, across Honshu to the Sea of Japan coast; UTM zone 54N (EPSG:32654) is used for distances.
from pathlib import Path

import geopandas as gpd
import numpy as np
import pandas as pd
import requests
from shapely.geometry import LineString

Path("data").mkdir(exist_ok=True)
p = Path("data/ne_japan_m45_2000_2024.csv")
if not p.exists():
    r = requests.get("https://earthquake.usgs.gov/fdsnws/event/1/query", timeout=600,
                     params=dict(format="csv", starttime="2000-01-01", endtime="2025-01-01", minmagnitude=4.5, orderby="time-asc",
                                 minlatitude=36, maxlatitude=41, minlongitude=138, maxlongitude=146))
    r.raise_for_status()
    p.write_text(r.text)
df = pd.read_csv(p)
df = df[df["type"] == "earthquake"].reset_index(drop=True)
ev = gpd.GeoDataFrame(df, geometry=gpd.points_from_xy(df.longitude, df.latitude), crs=4326)
UTM = 32654
line = gpd.GeoSeries([LineString([(144.5, 38.0), (139.0, 39.0)])], crs=4326).to_crs(UTM).iloc[0]
print(f"{len(ev):,} earthquakes; depth {ev.depth.min():.1f} to {ev.depth.max():.0f} km; profile {line.length / 1000:.0f} km")
5,819 earthquakes; depth 0.7 to 202 km; profile 492 km
The box holds 5,819 earthquakes of M4.5 or more, from 0.7 to 202 km deep. The profile is 492 km long.
Example 1: the 2011 Tohoku sequence on the section
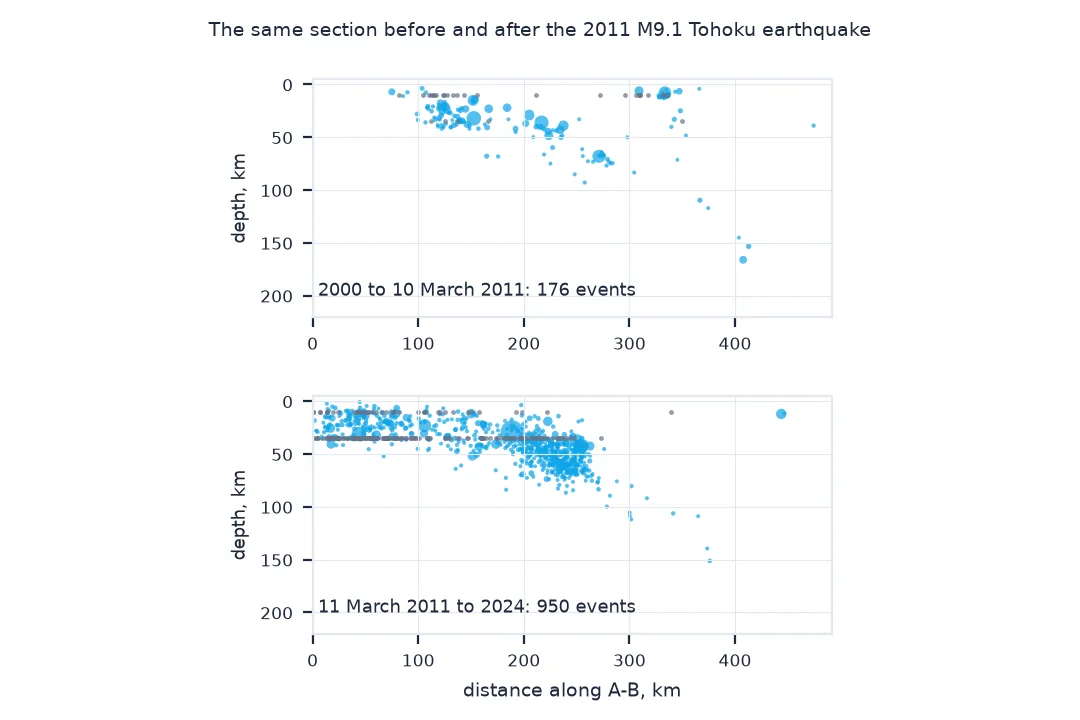
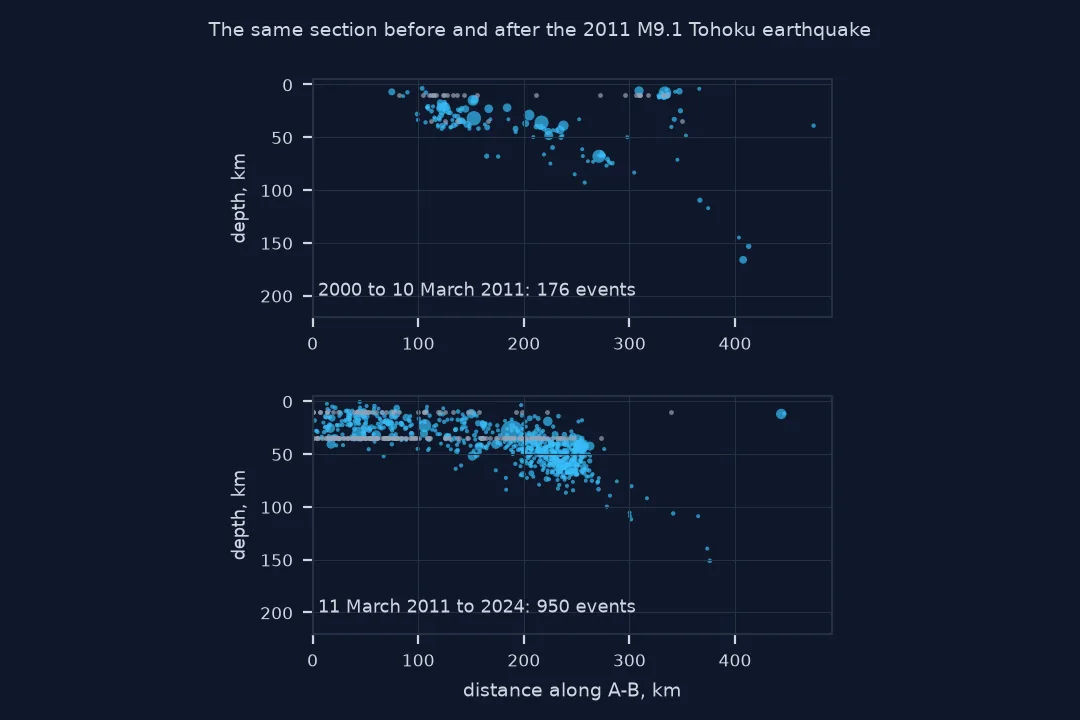
The M9.1 earthquake of 11 March 2011 and its aftershocks dominate the catalogue. Compare the section before and after it:
sec = sec.assign(t=pd.to_datetime(sec.time))
cut = pd.Timestamp("2011-03-11 05:46", tz="UTC")
for name, part in (("2000 to 10 March 2011", sec[sec.t < cut]), ("11 March 2011 to 2024", sec[sec.t >= cut])):
    print(f"{name}: {len(part)} events; within 75 km of A, near the trench: {(part.along_km < 75).sum()} ({(part.along_km < 75).mean():.0%}); median depth {part.depth.median():.0f} km")
2000 to 10 March 2011: 176 events; within 75 km of A, near the trench: 1 (1%); median depth 31 km
11 March 2011 to 2024: 950 events; within 75 km of A, near the trench: 265 (28%); median depth 35 km
The 2011 sequence multiplied the number of M4.5+ events on the section by more than five, from 176 in eleven years to 950 in fourteen, and it changed where they are. Before the earthquake only one event on the section was within 75 km of A, the end east of the trench; since then 265 have been, 28% of the total. The area near and seaward of the trench, quiet at this magnitude on this section for eleven years, has been active ever since, while the median depth hardly changed, 31 against 35 km.
A subducting plate at the Japan Trench
At the Japan Trench the Pacific plate moves west-north-west at about 8 cm a year relative to north-east Japan and bends down beneath it. Shallow earthquakes near the trench and under the coast are on the boundary between the plates, the megathrust that broke in 2011; deeper ones occur within the descending plate as it is heated, dehydrated and bent. Plotted on a section perpendicular to the trench, they form a sloping band whose angle is the dip of the slab.
A section is only as good as its projection. Distances must be measured in a metric CRS such as the local UTM zone, not in degrees; the profile must be roughly perpendicular to the trench, or the slab looks shallower than it is; and the half-width of the swath trades the number of events against blurring, because a slab whose geometry changes along strike smears into a thicker band. Depth uncertainty is the other limit: global catalogues locate intermediate-depth earthquakes to within ten kilometres or so, and some depths are fixed defaults rather than measurements.
Vertical exaggeration and swath width
- Vertical exaggeration: plot with equal axes, or say what the exaggeration is; a 5:1 section makes a 30° slab look like 70°.
- Swath width: 50 km either side is a common choice; narrower is sharper but sparser.
- Regional catalogues: the Japan Meteorological Agency's catalogue has many more, smaller events with better depths; ComCat's M4.5+ global coverage is coarser.
- Slab models: the USGS Slab2 model gives a gridded slab surface to compare a section against.
Internal links
- How to download and map an earthquake catalogue in Python — getting the events
- How to map earthquakes against plate boundaries in Python — where subduction zones are
- How to map focal mechanisms in Python — what kind of faulting each event was
FAQ
How do I make an earthquake cross-section in Python?
Define a profile line, project the hypocentres and the line into a metric CRS, use line.project(point) for the distance along the line and distance for the offset, keep events within a swath, and plot depth against distance.
What is a Wadati-Benioff zone?
The dipping band of earthquakes that traces a subducting plate into the mantle, named after Kiyoo Wadati and Hugo Benioff.
Why do many earthquakes have a depth of exactly 10 km?
When the data cannot constrain depth, locations are computed with the depth fixed at a default, often 10 km; those depths are not measurements.
How deep do earthquakes go?
To about 700 km, in subducting slabs. In this box the deepest M4.5+ earthquake since 2000 is at 202 km; the slab goes deeper farther west, under the Sea of Japan.