
How to Make an Interactive Arc Map of Flows with pydeck
On this page
Problem statement
A static flow map has to settle every overlap before it is printed. An interactive arc map lets the reader do some of that work: tilt the view so arcs rise out of the map, hover to see the number on each one, zoom into the knot around the origin. pydeck wraps deck.gl's ArcLayer for this. It turns a DataFrame of origins, destinations and counts into a self-contained HTML page. The layer is easy to set up. Making it honest takes the same choices as on paper: which flows, what width, what colour for direction. Like any web page, it should also be checked in a browser.
This page builds an arc map of moves into and out of Los Angeles County from the Census county-to-county flows, saves it as HTML, and tests it in headless Chromium.
Quick answer
Put origin and destination coordinates in columns, add an ArcLayer with a width expression and two colours for the ends, and save:
layer = pdk.Layer("ArcLayer", arcs, get_source_position=["o_lon", "o_lat"], get_target_position=["d_lon", "d_lat"],
                  get_width="width", get_source_color="src_rgb", get_target_color=[239, 68, 68], pickable=True)
deck = pdk.Deck(layers=[layer], map_style=pdk.map_styles.CARTO_LIGHT, tooltip={"text": "{label}"},
                initial_view_state=pdk.ViewState(latitude=36.5, longitude=-104, zoom=3.2, pitch=35))
deck.to_html("data/la_arcs.html", notebook_display=False)
print(f"{len(arcs)} arcs ({(arcs.direction == 'out').sum()} out, {(arcs.direction == 'in').sum()} in), "
      f"{Path('data/la_arcs.html').stat().st_size / 1e3:.0f} kB of HTML")
80 arcs (40 out, 40 in), 36 kB of HTML
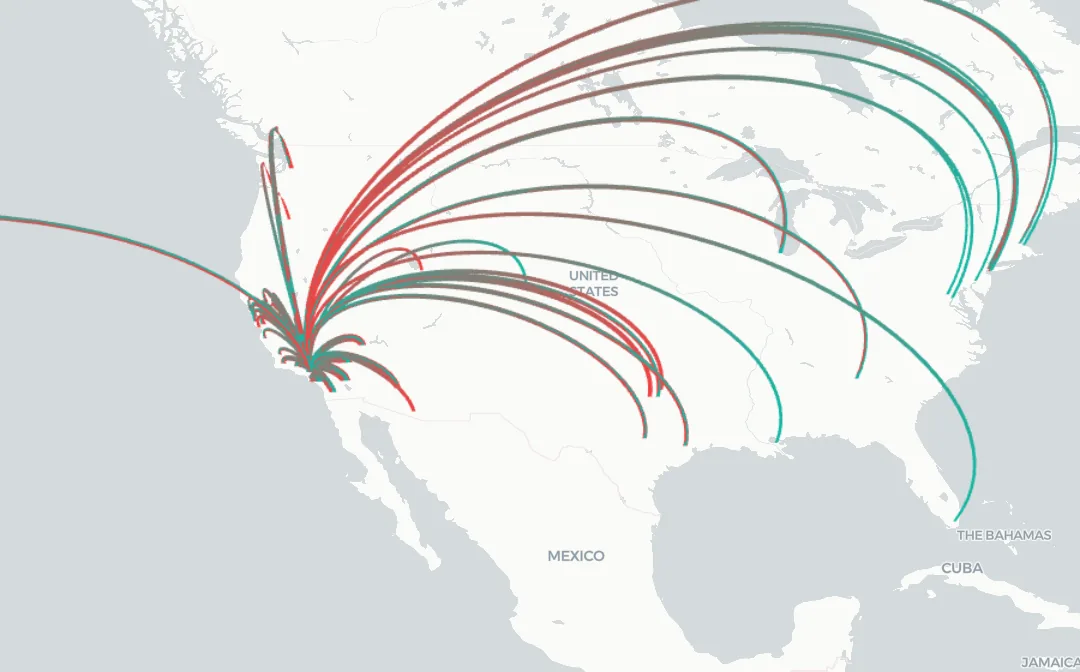
One row per arc, direction in colour, a browser test
1. Build one row per arc
Each arc needs a source and a target position. For outflows Los Angeles is the source; for inflows it is the target. Stack the two directions into one table with a column that says which is which:
print(arcs.groupby("direction").agg(arcs=("movers", "size"), movers=("movers", "sum")).to_string())
print(arcs.nlargest(3, "movers")[["label", "movers"]].to_string(index=False))
arcs movers
direction
in 40 137162
out 40 227916
label movers
LA → Orange County, California: 38,761 38761
LA → San Bernardino County, California: 34,920 34920
Orange County, California → LA: 23,839 23839
2. Encode direction in colour, not just width
An arc in deck.gl has two ends that can be different colours. Making the source end one colour and the target end another shows direction without arrowheads. Here every arc fades from teal at its origin to red at its destination, so outflows are teal at Los Angeles and inflows are red there:
print("source colours used:", arcs.src_rgb.apply(tuple).value_counts().to_dict())
print(f"width range {arcs.width.min():.1f}–{arcs.width.max():.1f} px (square root of movers)")
source colours used: {(20, 184, 166): 80}
width range 2.3–10.0 px (square root of movers)
3. Test the page in a browser
The HTML loads deck.gl and the basemap from CDNs and draws with WebGL. Open it in headless Chromium, read the layer back from the page, and pick at Los Angeles to see that the arcs respond:
from playwright.sync_api import sync_playwright

with sync_playwright() as p:
    browser = p.chromium.launch(args=["--use-angle=swiftshader", "--enable-unsafe-swiftshader"])
    page = browser.new_page(viewport={"width": 900, "height": 560})
    page.goto(Path("data/la_arcs.html").resolve().as_uri())
    page.wait_for_function("typeof deckInstance !== 'undefined'", timeout=60000)    # deck.gl loads from a CDN
    page.wait_for_timeout(3000)                                                       # let the basemap tiles draw
    n = page.evaluate("deckInstance.props.layers[0].props.data.length")
    x, y = page.evaluate("deckInstance.getViewports()[0].project([-118.23, 34.32])")
    hits = page.evaluate("deckInstance.pickMultipleObjects({x: %f, y: %f, radius: 6, depth: 200}).length" % (x, y))
    print(f"arcs in the page: {n}; objects picked at Los Angeles: {hits}")
    page.screenshot(path="data/la_arcs.png")
    browser.close()
arcs in the page: 80; objects picked at Los Angeles: 80
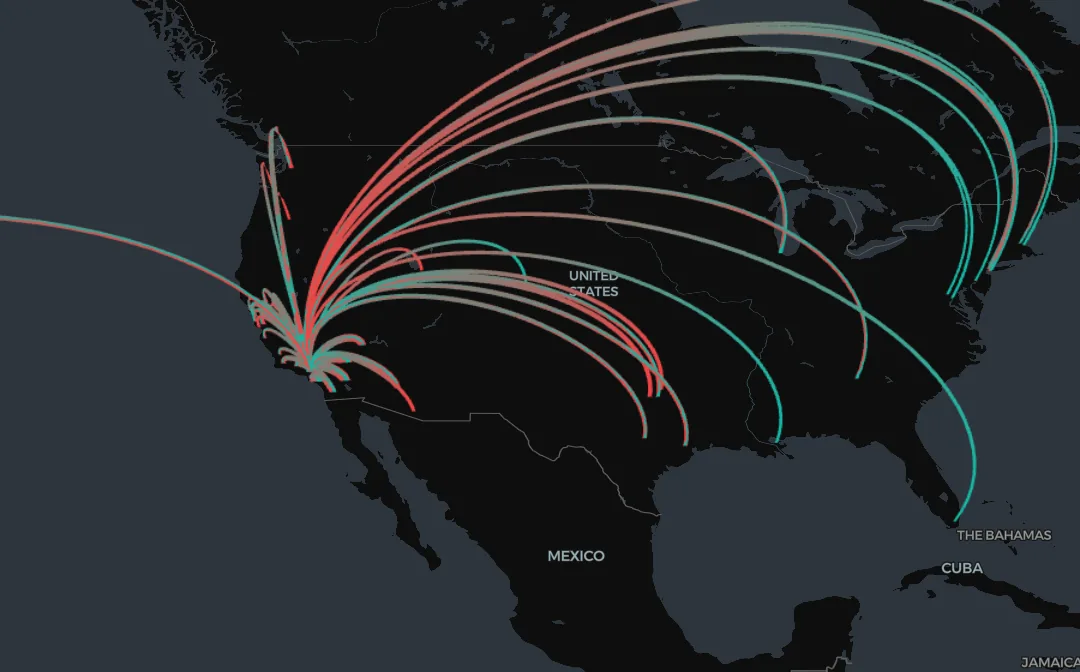
A dark version of the same arcs
The data used on this page
County-to-county migration flows, 2016–2020 ACS for Los Angeles County and 2023 county outlines from the cartographic boundary files; basemap tiles from CARTO with OpenStreetMap data.
from pathlib import Path

import geopandas as gpd
import numpy as np
import pandas as pd
import pydeck as pdk
import requests

Path("data").mkdir(exist_ok=True)
SRC = {"county-to-county-2016-2020-ins-outs-nets-gross.xlsx": "https://www2.census.gov/programs-surveys/demo/tables/geographic-mobility/2020/"
       "county-to-county-migration-2016-2020/county-to-county-migration-flows/county-to-county-2016-2020-ins-outs-nets-gross.xlsx",
       "cb_2023_us_county_20m.zip": "https://www2.census.gov/geo/tiger/GENZ2023/shp/cb_2023_us_county_20m.zip"}
for name, url in SRC.items():
    if not Path("data", name).exists():
        Path("data", name).write_bytes(requests.get(url, timeout=600).content)
COLS = ["a_st", "a_cty", "b_st", "b_cty", "a_state", "a_county", "b_state", "b_county",
        "flow", "flow_moe", "counter", "counter_moe", "net", "net_moe", "gross", "gross_moe"]
ca = pd.read_excel("data/county-to-county-2016-2020-ins-outs-nets-gross.xlsx", sheet_name="California",
                   header=None, skiprows=3, names=COLS, dtype=str)
la = ca[(ca.a_cty == "037") & ca.b_st.str.fullmatch(r"\d{3}", na=False)].copy()
la["geoid"] = la.b_st.str[1:] + la.b_cty
pts = gpd.read_file("data/cb_2023_us_county_20m.zip").set_index("GEOID").representative_point()
LL = {g: (p.x, p.y) for g, p in pts.items()}
o_lon, o_lat = LL["06037"]
rows = []
for direction, col in (("out", "counter"), ("in", "flow")):
    top = la.assign(movers=pd.to_numeric(la[col], errors="coerce")).dropna(subset=["movers"])
    for _, r in top[top.geoid.isin(LL)].nlargest(40, "movers").iterrows():
        (b_lon, b_lat) = LL[r.geoid]
        src, dst = ((o_lon, o_lat), (b_lon, b_lat)) if direction == "out" else ((b_lon, b_lat), (o_lon, o_lat))
        rows.append(dict(direction=direction, movers=r.movers, o_lon=src[0], o_lat=src[1], d_lon=dst[0], d_lat=dst[1],
                         label=f"{'LA → ' if direction == 'out' else ''}{r.b_county}, {r.b_state}{' → LA' if direction == 'in' else ''}: {r.movers:,.0f}"))
arcs = pd.DataFrame(rows)
arcs["width"] = 1 + 9 * np.sqrt(arcs.movers / arcs.movers.max())
arcs["src_rgb"] = [[20, 184, 166]] * len(arcs)
print(f"{len(arcs)} arcs prepared")
80 arcs prepared
Example 1: a dark version for the same data
dark = pdk.Deck(layers=[layer], map_style=pdk.map_styles.CARTO_DARK, tooltip={"text": "{label}"},
                initial_view_state=pdk.ViewState(latitude=36.5, longitude=-104, zoom=3.2, pitch=35))
dark.to_html("data/la_arcs_dark.html", notebook_display=False)
print("written:", sorted(f.name for f in Path("data").glob("la_arcs*.html")))
written: ['la_arcs.html', 'la_arcs_dark.html']
Interaction in place of planar clarity
An arc map trades the planar clarity of a static flow map for interaction. Arcs rise above the map, so long flows clear the clutter around the origin. A tilted view separates arcs that would overlap on a flat map, and hovering shows the exact number. In return the reader needs a WebGL-capable browser, and the picture changes with every pan and tilt. A screenshot is one view, not the map.
The design rules carry over unchanged. Show a selection of flows and say how it was made. Scale width with the square root. Encode direction, here by colouring the two ends of each arc. The browser test closes the loop: the number of arcs in the page matches the table, and picking at the origin returns arcs, so the layer is drawn where it should be.
Great circles, basemaps and file size
- Great circles:
ArcLayerdraws arcs in screen space; for long-distance flows useGreatCircleLayer, which follows the shortest path on the globe. - Basemaps: CARTO styles need no token; Mapbox styles do (
api_keys={"mapbox": ...}). - File size: pydeck embeds the data as JSON in the page; thousands of arcs are fine, millions are not.
- Offline use: the page loads deck.gl and the basemap from the internet; it will not render without a connection.
- Accessibility: provide the table of flows alongside, since hover-only labels exclude keyboard and screen-reader users.
Internal links
- How to make a flow map in Python — the static version of the same flows
- How to make a time-slider web map — testing another web map in Chromium
FAQ
How do I make an arc map in Python?
With pydeck's ArcLayer: give it source and target positions, a width and colours, add it to a Deck and save the page with to_html.
How do I show direction on an arc map?
Give the source and target ends different colours (get_source_color, get_target_color), and say in the legend which colour is which end.
Do pydeck maps need a Mapbox token?
Not with the CARTO basemap styles (pdk.map_styles.CARTO_LIGHT, CARTO_DARK); Mapbox styles need one.
How can I test a pydeck map automatically?
Open the HTML in headless Chromium with Playwright, read deckInstance from the page, and check the layer data and picking against your table.