
How to Save a Folium Map as a PNG Image in Python
On this page
Problem statement
Folium makes interactive HTML maps, but reports, slides and emails need a picture. Folium has no savefig: the map is a web page that only becomes an image when a browser draws it, tiles and all. The reliable way is to open the HTML in a headless browser and take a screenshot, which Playwright does from Python in a few lines; the details that decide whether the image is usable are waiting long enough for the tiles, the size and pixel density of the screenshot, and hiding the zoom buttons.
This page saves a Folium map of US airports as a PNG with Playwright and headless Chromium, checks that the tiles loaded by inspecting the image, renders at double pixel density for print, hides the map controls, and compares the result with a static matplotlib alternative.
Quick answer
Save the map to HTML, open it in headless Chromium, wait for the tiles, screenshot:
from playwright.sync_api import sync_playwright
def screenshot(html, png, width=1000, height=600, scale=1, wait_until="load", wait_ms=4000):
    with sync_playwright() as p:
        browser = p.chromium.launch()
        page = browser.new_page(viewport={"width": width, "height": height}, device_scale_factor=scale)
        page.goto(Path(html).resolve().as_uri(), wait_until=wait_until)
        page.wait_for_timeout(wait_ms)                                    # give the tiles time to arrive
        page.screenshot(path=png)
        browser.close()

screenshot("data/airports_map.html", "data/airports_map.png")
img = Image.open("data/airports_map.png")
print(f"PNG {img.size[0]} x {img.size[1]} px, {Path('data/airports_map.png').stat().st_size / 1e3:,.0f} kB")
PNG 1000 x 600 px, 231 kB
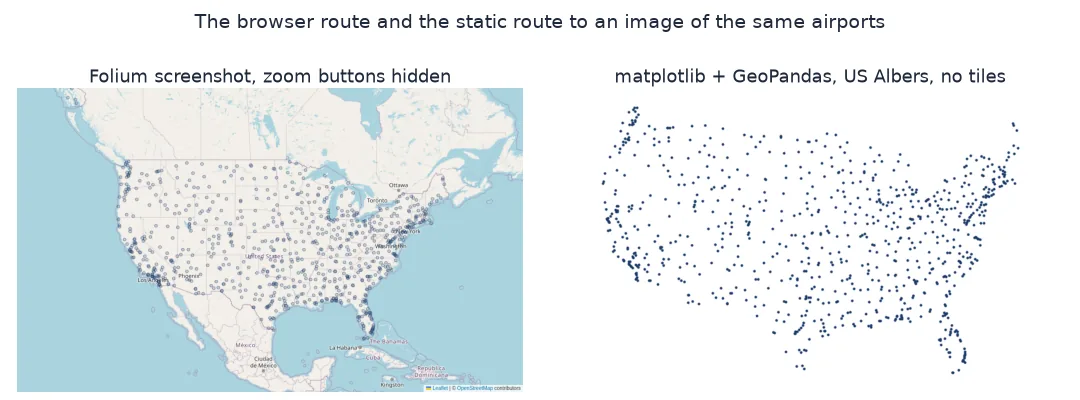
The screenshot is a 1000 × 600 pixel PNG of 231 kB, with the OpenStreetMap tiles and all 918 markers.
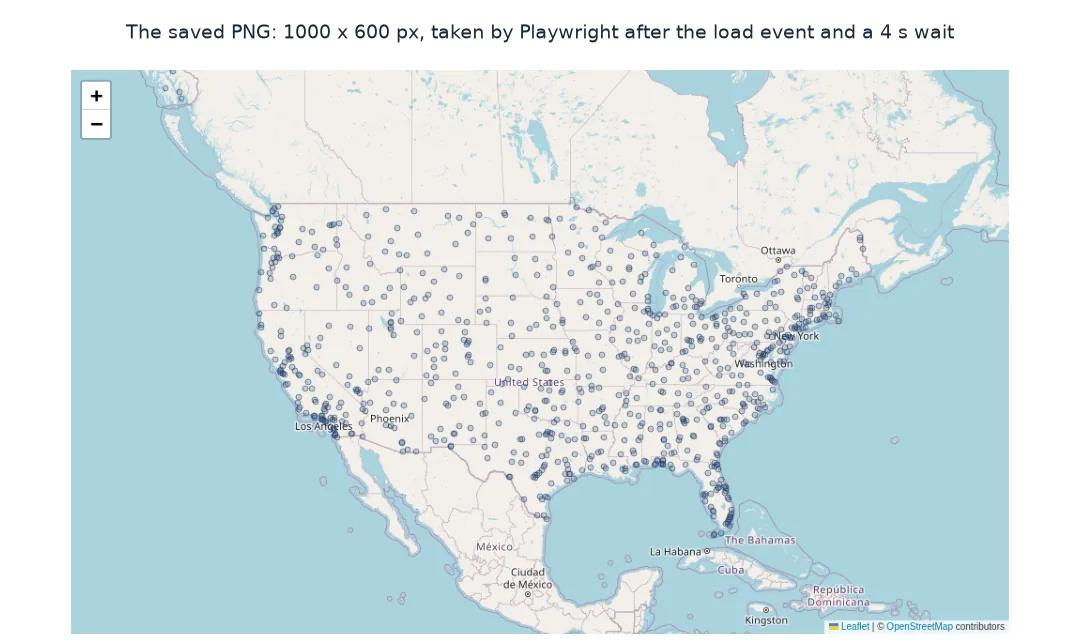
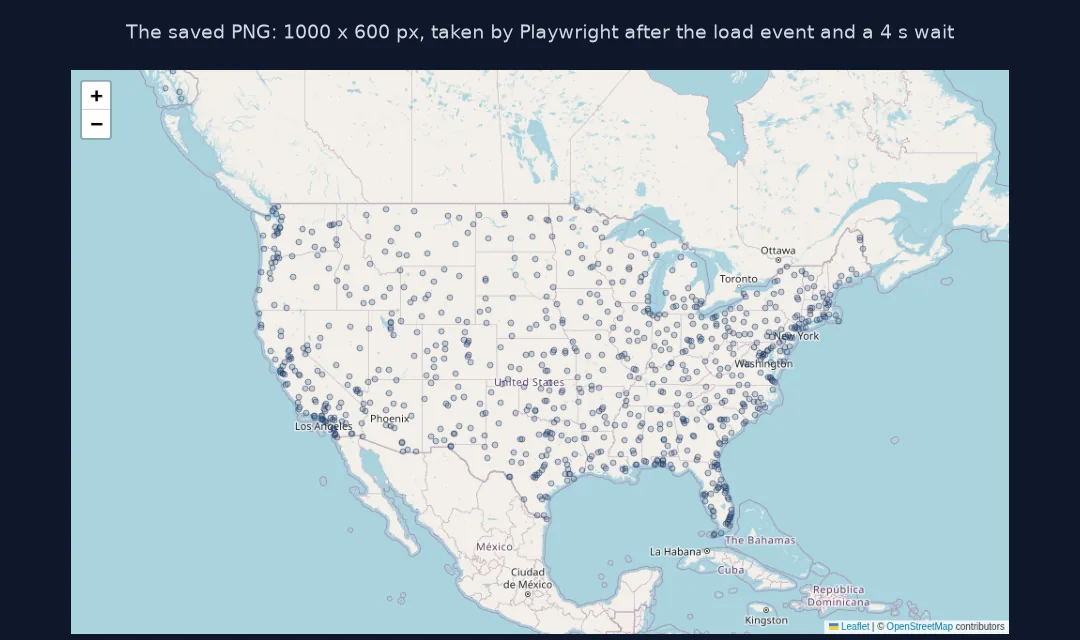
Wait for tiles, double the pixel density, hide controls
1. Check that the tiles loaded
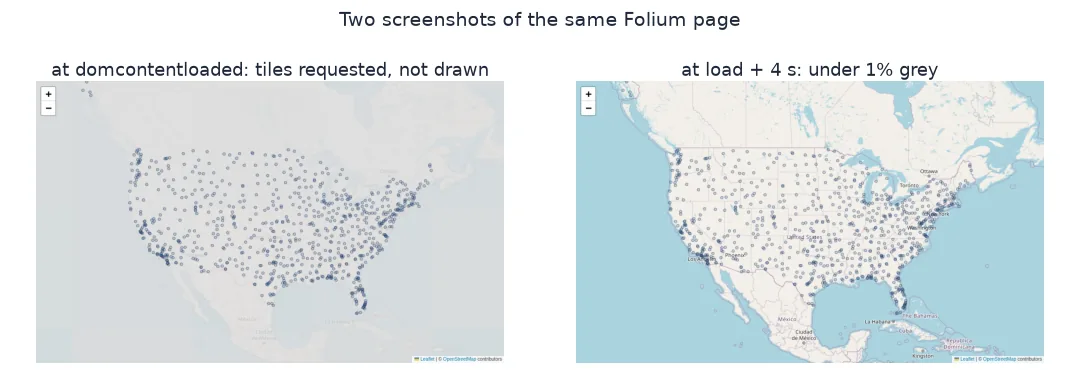
A screenshot taken too early shows markers on Leaflet's grey background. Take one as soon as the HTML is parsed (domcontentloaded), before the tiles arrive, and measure how much of each image is that background colour:
def grey_share(png):
    a = np.asarray(Image.open(png).convert("RGB")).astype(int)
    return float((np.abs(a - [221, 221, 221]).sum(axis=2) < 6).mean())        # Leaflet's empty background is #ddd
screenshot("data/airports_map.html", "data/early.png", wait_until="domcontentloaded", wait_ms=0)
early, done = grey_share("data/early.png"), grey_share("data/airports_map.png")
print(f"screenshot at domcontentloaded: over 5% background grey: {early > 0.05}")
print(f"screenshot at load + 4 s: under 1% background grey: {done < 0.01}")
screenshot at domcontentloaded: over 5% background grey: True
screenshot at load + 4 s: under 1% background grey: True
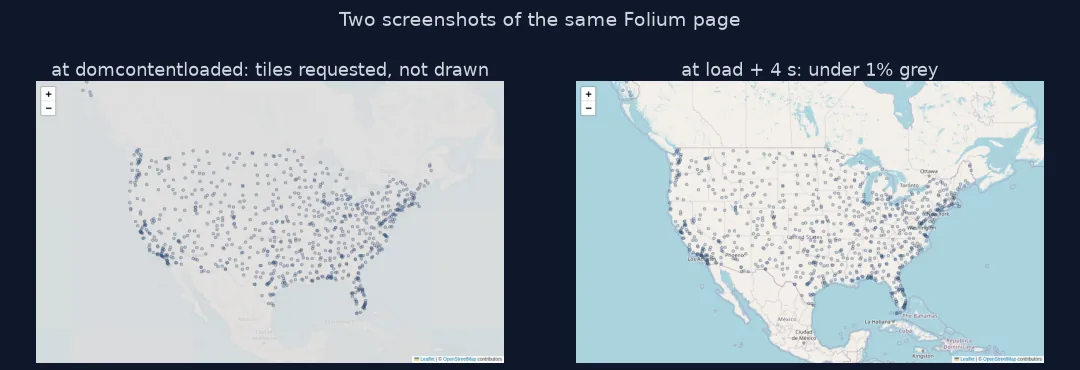
Taken at domcontentloaded, a sizeable part of the image is still Leaflet's grey background, because some tiles have been requested but not yet drawn. How much depends on how fast the tile server answers. With the default load and a 4-second wait, less than 1% is grey.
2. Double pixel density for print
device_scale_factor=2 renders the same view at twice the resolution, with sharper text and tiles from the higher zoom level:
screenshot("data/airports_map.html", "data/airports_map_2x.png", scale=2)
for f in ("airports_map.png", "airports_map_2x.png"):
    im = Image.open(f"data/{f}")
    print(f"{f:>21}: {im.size[0]} x {im.size[1]} px, {Path('data/' + f).stat().st_size / 1e3:,.0f} kB; at 300 dpi {im.size[0] / 300 * 2.54:.1f} cm wide")
airports_map.png: 1000 x 600 px, 231 kB; at 300 dpi 8.5 cm wide
airports_map_2x.png: 2000 x 1200 px, 767 kB; at 300 dpi 16.9 cm wide
At double density the image is 2000 × 1200 pixels and 767 kB: about 17 cm wide at 300 dpi, against 8.5 cm for the single-density image.
3. Hide the controls
For a figure, remove the zoom buttons, but keep the attribution, which the tile licences require:
m2 = folium.Map(location=[39, -98], zoom_start=4, zoom_control=False)
for _, r in LM.iterrows():
    folium.CircleMarker([r.latitude_deg, r.longitude_deg], radius=3, color="#1a3a6b", fill=True, weight=0.5).add_to(m2)
m2.save("data/airports_clean.html")
screenshot("data/airports_clean.html", "data/airports_clean.png")
html = Path("data/airports_clean.html").read_text()
print(f"zoom control in the page: {'zoomControl\": true' in html}; attribution kept: {'OpenStreetMap' in html}")
zoom control in the page: False; attribution kept: True
With zoom_control=False the page has no zoom buttons, and the tile attribution is still there.
The static alternative
The data used on this page
The large and medium airports of the United States from OurAirports, a public-domain database. Playwright's Chromium is installed once with playwright install chromium. CARTO's raster basemaps, which many Folium examples load with tiles="CartoDB positron", now return a grey tile stamped "API KEY REQUIRED" (checked on 2 October 2026), so this page uses Folium's default OpenStreetMap tiles, within the OpenStreetMap tile usage policy.
from pathlib import Path

import folium
import numpy as np
import pandas as pd
import requests
from PIL import Image

Path("data").mkdir(exist_ok=True)
p = Path("data/airports.csv")
if not p.exists():
    r = requests.get("https://davidmegginson.github.io/ourairports-data/airports.csv", timeout=300)
    r.raise_for_status()
    p.write_bytes(r.content)
A = pd.read_csv(p, keep_default_na=False, na_values=[""])
LM = A[(A.iso_country == "US") & A.type.isin(["large_airport", "medium_airport"])].reset_index(drop=True)
m = folium.Map(location=[39, -98], zoom_start=4)
for _, r in LM.iterrows():
    folium.CircleMarker([r.latitude_deg, r.longitude_deg], radius=3, color="#1a3a6b", fill=True, weight=0.5, tooltip=r.ident).add_to(m)
m.save("data/airports_map.html")
print(f"{len(LM):,} airports on the map")
918 airports on the map
The map shows 918 large and medium US airports as circle markers.
Example 1: the static alternative
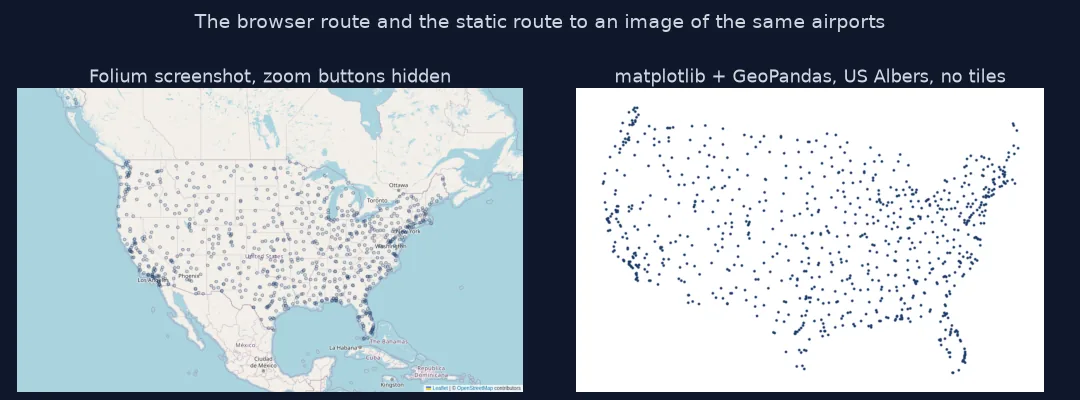
When the map does not need tiles, matplotlib and GeoPandas write an image directly, with no browser:
import geopandas as gpd
import matplotlib
matplotlib.use("Agg")
import matplotlib.pyplot as plt
g = gpd.GeoDataFrame(LM, geometry=gpd.points_from_xy(LM.longitude_deg, LM.latitude_deg), crs=4326)
fig, ax = plt.subplots(figsize=(10, 6), dpi=100)
g[g.longitude_deg.between(-130, -60)].to_crs(5070).plot(ax=ax, markersize=4, color="#1a3a6b")
ax.set_axis_off(); fig.savefig("data/airports_static.png", bbox_inches="tight"); plt.close(fig)
print(f"static PNG {Image.open('data/airports_static.png').size}, {Path('data/airports_static.png').stat().st_size / 1e3:,.0f} kB, no tiles, US Albers projection")
static PNG (743, 482), 21 kB, no tiles, US Albers projection
The matplotlib version is a 743 × 482 pixel PNG of 21 kB, drawn in the US Albers projection with no basemap and no browser. It keeps only the airports between 130° W and 60° W, the conterminous states, leaving out the 82 in Alaska and the 14 in Hawaii. A single far-off point stretches the frame: Eareckson Air Station, on Shemya in the Aleutians, is at 174° E, so a filter of longitude > -130 alone keeps it and squeezes the conterminous states into a corner.
A Folium map is HTML and JavaScript
A Folium map is HTML and JavaScript: Leaflet builds the map in the browser, requests the tiles for the current view from the tile server and draws the layers on top. Nothing exists as pixels until that has happened, which is why the only faithful image is a screenshot of a real browser. Playwright drives Chromium without a window, so the same code works on a server or in a scheduled job. The wait matters because tiles arrive over the network; a fixed wait is simple, and checking the image for background pixels confirms it.
Two other approaches exist. Older guides use Selenium with a browser driver, which works the same way with more setup. And for maps where the basemap is decoration, a static plot with GeoPandas or Cartopy is faster, needs no browser or network, and can use a proper projection instead of Web Mercator. Whichever is used, tile-based images must keep the attribution of the tile provider and of OpenStreetMap, which the licences require.
Tile terms, fonts and element screenshots
- Tile servers' terms: OpenStreetMap's tile servers allow light use only; batch-producing images needs a commercial provider or your own tiles. A tile that returns a watermark, such as CARTO's "API KEY REQUIRED", passes the background check, so look at the image.
- Fonts: headless Linux may lack fonts for some scripts; install them or labels render as boxes.
- Element screenshots:
page.locator(".folium-map").screenshot()captures only the map div. - WebGL maps: libraries that draw with WebGL (MapLibre, deck.gl) may need the page served over HTTP rather than opened as a file.
Internal links
- How to make interactive maps with Folium — the maps being saved
- How to save a map image with matplotlib — the static route
- Interactive vs static maps explained — when each fits
FAQ
How do I save a Folium map as an image?
Save it to HTML, open the file in a headless browser with Playwright or Selenium, wait for the tiles, and take a screenshot.
Does Folium have a save as PNG function?
No; m.save() writes HTML only. Older versions had _to_png(), which also relied on a browser.
Why is my Folium screenshot grey?
The screenshot was taken before the tiles loaded; wait longer or check the image for background pixels.
How do I get a high-resolution image of a Folium map?
Set device_scale_factor=2 or higher in the browser page.