
How to Convert Hourly Weather Data to Daily in Python
On this page
Problem statement
Hourly weather observations are timestamped in UTC, but people and official statistics count days in local time. Turning hours into daily values looks like one line of pandas, resample("D"), and that line quietly produces the wrong days if the time zone is not handled. It also hides other choices: whether the daily maximum is the highest hourly reading or a separately measured maximum, how precipitation accumulations are summed, and how many hours a day needs before its value means anything.
This page converts a year of hourly observations from Washington National Airport into daily maximum, minimum and mean temperature and daily precipitation. It does this in UTC and in local time, compares both with the station's official daily record, and shows the effect of daylight saving time and of missing hours.
Quick answer
Convert the UTC index to local time, then resample by calendar day:
local = H.tz_localize("UTC").tz_convert("America/New_York")
daily = local.resample("D").agg({"temp": ["max", "min", "mean", "count"], "prcp": "sum"})
daily.columns = ["tmax", "tmin", "tmean", "hours", "prcp"]
print(f"{len(daily)} local days; hours per day {daily.hours.min()} to {daily.hours.max()}; days with fewer than 20 hours: {(daily.hours < 20).sum()}")
369 local days; hours per day 5 to 25; days with fewer than 20 hours: 2
Converted to local time, the rows fall on 369 days. The two days with fewer than 20 hours, one with only 5, are the partial days at the ends of the download. The day with 25 hours is the autumn time change.
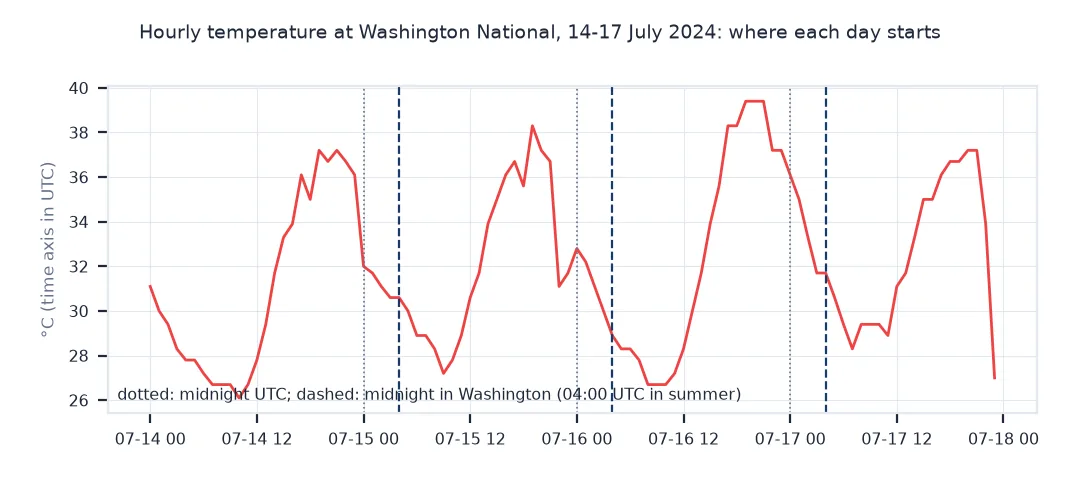
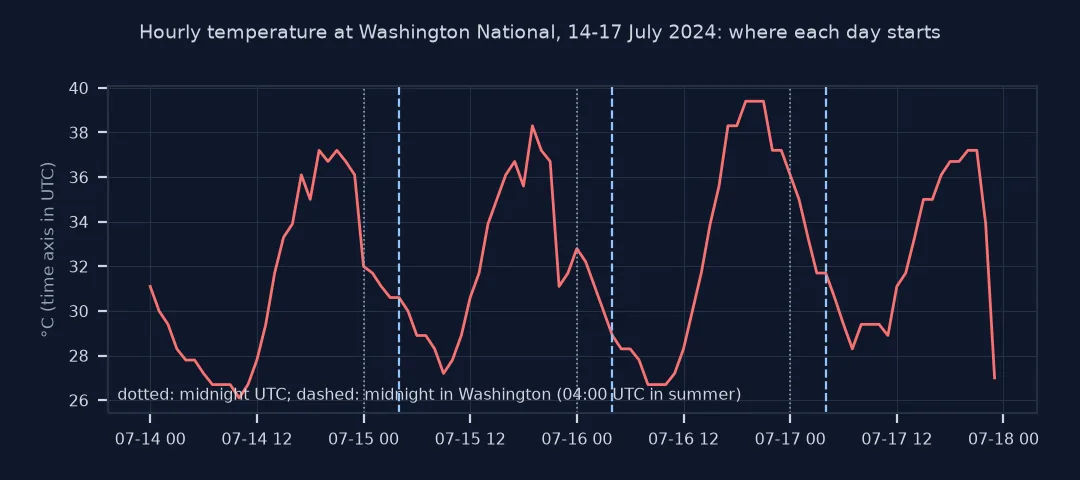
UTC against local days, hourly maxima, daylight saving
1. UTC days against local days
Resample the same hours in UTC and compare both with the station's official daily maximum and minimum from GHCN:
utc = H.resample("D").agg({"temp": ["max", "min"]}); utc.columns = ["tmax", "tmin"]
off = G.loc["2024"]
def mae(a, b):
    j = pd.concat([a, b], axis=1, join="inner").dropna()
    return (j.iloc[:, 0] - j.iloc[:, 1]).abs().mean()
loc = daily.copy(); loc.index = loc.index.tz_localize(None)
print(f"daily minimum vs official: UTC days off by {mae(utc.tmin, off.TMIN):.2f} °C on average, local days by {mae(loc.tmin, off.TMIN):.2f} °C")
print(f"daily maximum vs official: UTC days {mae(utc.tmax, off.TMAX):.2f} °C, local days {mae(loc.tmax, off.TMAX):.2f} °C")
daily minimum vs official: UTC days off by 0.70 °C on average, local days by 0.41 °C
daily maximum vs official: UTC days 0.70 °C, local days 0.44 °C
Against the official daily record, UTC days are off by 0.70 °C on average for both the minimum and the maximum, and local days by 0.41 and 0.44 °C. The time zone alone accounts for over a third of the error.
2. The hourly maximum is not the daily maximum
Official daily extremes come from continuous measurement; the highest of 24 hourly readings misses the peak between readings:
both = pd.concat([loc.tmax, off.TMAX], axis=1, join="inner").dropna()
gap = both.TMAX - both.tmax
print(f"official max minus hourly max: mean {gap.mean():+.2f} °C; official higher on {(gap > 0).mean():.0%} of days")
official max minus hourly max: mean +0.42 °C; official higher on 61% of days
The official maximum is 0.42 °C higher than the highest hourly reading on average, and higher on 61% of days, because the peak often falls between readings.
3. Daylight saving time
Local days have 23 hours in spring and 25 in autumn. Check the two transition days:
for d in ("2024-03-10", "2024-11-03"):
    print(f"{d}: {int(daily.loc[d:d, 'hours'].iloc[0])} hours of data")
2024-03-10: 23 hours of data
2024-11-03: 25 hours of data
10 March 2024 has 23 hours and 3 November has 25, because local days in a civil time zone follow the clock changes.
Precipitation days
The data used on this page
Hourly observations for 2024 from Meteostat station 72405, Washington National Airport (CC BY 4.0), timestamped in UTC; and the station's official daily values from GHCN-Daily (USW00013743), converted from tenths.
from datetime import datetime
from pathlib import Path

import meteostat as ms
import pandas as pd
import requests

Path("data").mkdir(exist_ok=True)
H = ms.hourly("72405", datetime(2023, 12, 31), datetime(2025, 1, 1, 23)).fetch()[["temp", "prcp"]]
CSV = Path("data/USW00013743.csv")
if not CSV.exists():
    r = requests.get("https://www.ncei.noaa.gov/data/global-historical-climatology-network-daily/access/USW00013743.csv", timeout=600)
    r.raise_for_status(); CSV.write_bytes(r.content)
G = pd.read_csv(CSV, usecols=["DATE", "TMAX", "TMIN", "PRCP"], parse_dates=["DATE"]).set_index("DATE") / 10
print(f"{len(H):,} hourly rows, {H.index.min()} to {H.index.max()} UTC")
8,832 hourly rows, 2023-12-31 00:00:00 to 2025-01-01 23:00:00 UTC
The download has 8,832 hourly rows from the last day of 2023 to the first of 2025, in UTC, so the local days at both ends of 2024 are complete.
Example 1: precipitation days
Daily precipitation is the sum of hourly accumulations; compare local days with the official totals:
pj = pd.concat([loc.prcp, off.PRCP], axis=1, join="inner").dropna()
print(f"annual total: hourly sum {pj.prcp.sum():.0f} mm, official {pj.PRCP.sum():.0f} mm; days within 1 mm of each other {((pj.prcp - pj.PRCP).abs() <= 1).mean():.0%}")
annual total: hourly sum 825 mm, official 955 mm; days within 1 mm of each other 90%
Hourly precipitation sums to 825 mm for the year against the official 955 mm, and only 90% of days agree within 1 mm. Hourly reports with missing precipitation lose rain, which is why official daily totals are the better source for rainfall.
Data in UTC, days in local time
Hourly weather data is almost always stored in UTC, because observations are exchanged internationally on a common clock. A daily value, though, belongs to a local calendar day, and in Washington midnight local time is 04:00 or 05:00 UTC, depending on daylight saving. Resampling UTC timestamps by day puts the evening hours of each local day into the next day, which matters most for the daily minimum, usually reached around dawn, and for rain that falls in the evening.
Two more details separate a careful conversion from a quick one. Official daily maxima and minima come from instruments that record the extremes continuously, so they are higher and lower than the extremes of hourly snapshots, by a few tenths of a degree on average. Days with missing hours should be flagged or dropped rather than averaged as if complete. A simple rule, such as requiring 20 or more hours, keeps a partial day from looking like a mild one. US first-order stations' official days are in local standard time all year, so a comparison during daylight saving time is offset by an hour even when time zones are handled.
Standard time, accumulations and gaps
- Standard time: to match US climatological days, convert to a fixed offset (
Etc/GMT+5for Eastern Standard Time) rather than a daylight-saving zone. - Accumulations: some datasets give precipitation as an accumulation since the last report, or over 6 hours; sum only true hourly amounts.
- Means: the mean of 24 hourly values differs from (max + min) / 2, the US convention for daily mean temperature.
- Gaps: count the hours behind each day and set a minimum.
Internal links
- Fixing weather data in the wrong time zone — the time-zone trap in detail
- How to get weather station data with Meteostat in Python — the hourly source
- How to get NOAA GHCN daily weather station data in Python — the official daily values
FAQ
How do I convert hourly weather data to daily in pandas?
Localise the index to UTC, convert it to the local time zone, then resample("D") with max, min, mean and sum as appropriate.
Why are my daily values different from the official ones?
Usually because the days were counted in UTC, and because official extremes come from continuous measurement rather than hourly readings.
How do I handle daylight saving time when resampling?
Convert to the local zone before resampling; pandas then gives 23- and 25-hour days at the transitions.
How many hours does a day need?
A common rule is at least 20 of 24; state whatever threshold you use.