
How to Get Weather Data for Many Locations in Python
On this page
Problem statement
Weather for one place is one request; weather for a hundred stores, farms or cities needs a plan. Looping over coordinates one call at a time is slow and soon hits the API's rate limit. Requesting all of them at once needs the right syntax and returns nested results that must be matched back to the input rows. The data also needs to come back in a shape that joins to the original table: one row per place and date, with the place's identifier.
This page gets the daily maximum temperature for July 2024 for all 50 US state capitals from the Open-Meteo archive in batched requests. It reshapes the result into a tidy table, ranks the capitals, and maps the month's heat.
Quick answer
Pass comma-separated latitudes and longitudes in one request; the response is a list in the same order:
def batch(rows, **params):
    p = {"latitude": ",".join(f"{v:.4f}" for v in rows.lat), "longitude": ",".join(f"{v:.4f}" for v in rows.lon), **params}
    js = cached_get("https://archive-api.open-meteo.com/v1/archive", p)
    js = js if isinstance(js, list) else [js]
    return pd.concat([pd.DataFrame(j["daily"]).assign(capital=name, cell_lat=j["latitude"], cell_lon=j["longitude"]) for j, name in zip(js, rows.name)])
W = pd.concat([batch(CAP.iloc[i:i + 10], start_date="2024-07-01", end_date="2024-07-31", daily="temperature_2m_max", timezone="auto")
               for i in range(0, len(CAP), 10)])
W["time"] = pd.to_datetime(W.time)
print(f"{W.capital.nunique()} capitals x {W.time.nunique()} days = {len(W):,} rows; {len(range(0, len(CAP), 10))} requests")
50 capitals x 31 days = 1,550 rows; 5 requests
Five requests of ten capitals each return 1,550 rows, one for each capital and day of July 2024.
Summaries per place, wide or long, joined back
1. Summarise per place
S = W.groupby("capital").temperature_2m_max.agg(["mean", "max"]).join(CAP.set_index("name")[["state"]])
S["days_35"] = W.assign(hot=W.temperature_2m_max >= 35).groupby("capital").hot.sum()
print("hottest July means:", S.nlargest(4, "mean")[["state", "mean"]].round(1).to_dict("index"))
print("coolest July means:", S.nsmallest(3, "mean")[["state", "mean"]].round(1).to_dict("index"))
hottest July means: {'Phoenix': {'state': 'Arizona', 'mean': 42.8}, 'Sacramento': {'state': 'California', 'mean': 39.4}, 'Boise': {'state': 'Idaho', 'mean': 36.0}, 'Salt Lake City': {'state': 'Utah', 'mean': 35.7}}
coolest July means: {'Juneau': {'state': 'Alaska', 'mean': 11.8}, 'Madison': {'state': 'Wisconsin', 'mean': 26.3}, 'St. Paul': {'state': 'Minnesota', 'mean': 27.4}}
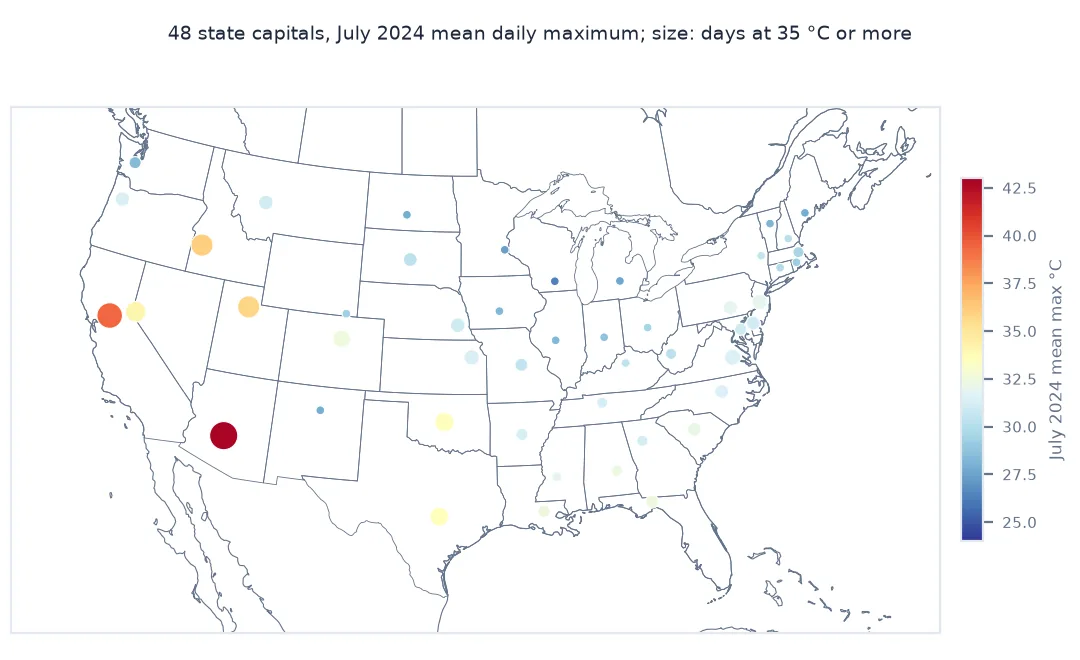
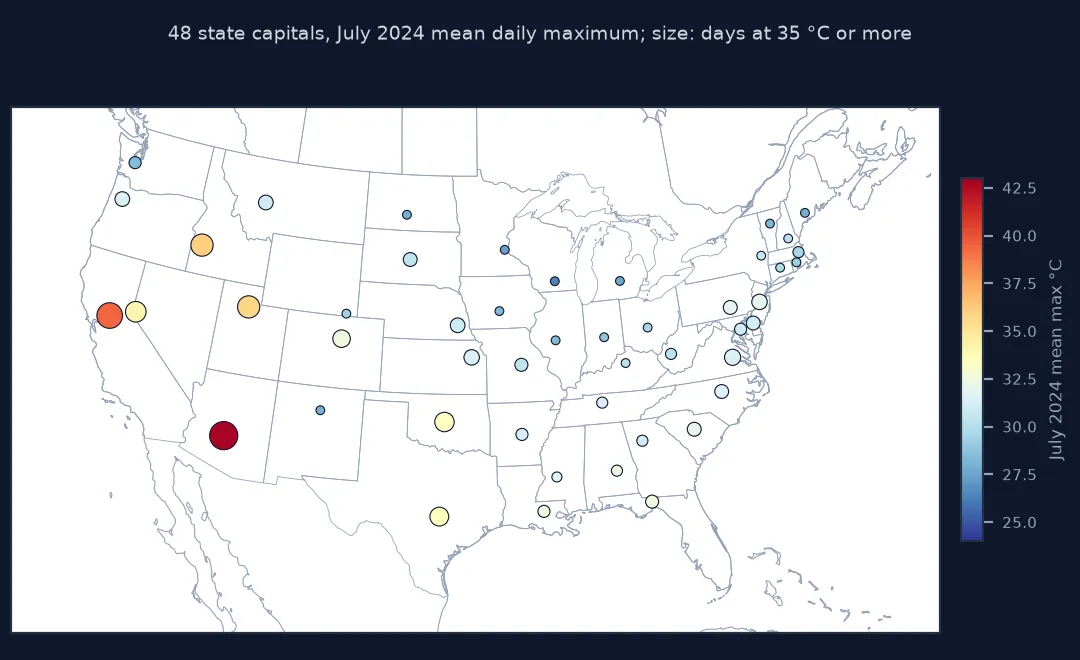
Phoenix had the hottest July, with a mean daily maximum of 42.8 °C, followed by Sacramento, Boise and Salt Lake City. Juneau was by far the coolest at 11.8 °C, then Madison and St. Paul.
2. Wide or long
A long table (one row per place and day) joins and groups easily; a wide table (one column per place) suits time-series plots:
wide = W.pivot(index="time", columns="capital", values="temperature_2m_max")
print(f"long: {W.shape}; wide: {wide.shape}; days with a missing value in wide: {wide.isna().any(axis=1).sum()}")
long: (1550, 5); wide: (31, 50); days with a missing value in wide: 0
The long table has 1,550 rows and the wide one 31 rows by 50 columns, with no missing values.
3. Join back to the places
G = gpd.GeoDataFrame(CAP.merge(S.reset_index().rename(columns={"capital": "name"}), on=["name", "state"]),
                     geometry=gpd.points_from_xy(CAP.lon, CAP.lat), crs=4326)
print(f"capitals with 10 or more days at 35 °C or above: {(G.days_35 >= 10).sum()}: {', '.join(G[G.days_35 >= 10].sort_values('days_35', ascending=False).name)}")
capitals with 10 or more days at 35 °C or above: 8: Phoenix, Sacramento, Boise, Salt Lake City, Carson City, Oklahoma City, Austin, Denver
Eight capitals had 10 or more days at 35 °C or above, from Phoenix and Sacramento in the West to Oklahoma City and Austin.
The grid cell behind each capital
The data used on this page
The 50 US state capitals from Natural Earth populated places (1:10m), and daily maximum temperature from the Open-Meteo historical weather API (ERA5-based reanalysis). Responses are cached and requests retry after a 429.
import hashlib
import json
import time
from pathlib import Path

import geopandas as gpd
import pandas as pd
import requests

Path("data").mkdir(exist_ok=True)
def cached_get(url, params):
    f = Path("data/om_" + hashlib.md5((url + json.dumps(params, sort_keys=True)).encode()).hexdigest() + ".json")
    if not f.exists():
        for attempt in range(6):
            r = requests.get(url, params=params, timeout=300)
            if r.status_code == 429:
                time.sleep(60 * (attempt + 1)); continue
            r.raise_for_status(); f.write_text(r.text); break
        time.sleep(5)
    return json.loads(f.read_text())

p = Path("data/ne_10m_populated_places.zip")
if not p.exists():
    r = requests.get("https://naciscdn.org/naturalearth/10m/cultural/ne_10m_populated_places.zip", timeout=600)
    r.raise_for_status(); p.write_bytes(r.content)
NE = gpd.read_file(p)
CAP = NE[(NE.ADM0NAME == "United States of America") & (NE.FEATURECLA == "Admin-1 capital")]
CAP = pd.DataFrame({"name": CAP.NAME, "state": CAP.ADM1NAME, "lat": CAP.LATITUDE, "lon": CAP.LONGITUDE}).sort_values("state").reset_index(drop=True)
print(f"{len(CAP)} state capitals")
50 state capitals
Natural Earth lists all 50 state capitals.
Example 1: the grid cell behind each capital
Each response reports the coordinates of the grid cell it used. Measure how far each capital is from its cell's centre, and whether any two share a cell:
cells = W.drop_duplicates("capital")[["capital", "cell_lat", "cell_lon"]].merge(CAP, left_on="capital", right_on="name")
d_km = gpd.GeoSeries(gpd.points_from_xy(cells.lon, cells.lat), crs=4326).to_crs(5070).distance(
       gpd.GeoSeries(gpd.points_from_xy(cells.cell_lon, cells.cell_lat), crs=4326).to_crs(5070)) / 1000
print(f"distance from capital to cell centre: median {d_km.median():.1f} km, largest {d_km.max():.1f} km ({cells.capital[d_km.idxmax()]})")
print(f"capitals sharing a cell with another: {cells.duplicated(['cell_lat', 'cell_lon'], keep=False).sum()}")
distance from capital to cell centre: median 3.3 km, largest 7.1 km (Juneau)
capitals sharing a cell with another: 0
The cell centres are a median 3.3 km from the capitals, and at most 7.1 km, for Juneau. No two capitals share a cell.
Responses come back in request order
Open-Meteo's APIs accept lists of coordinates, latitude=a,b,c with matching longitudes, and answer with a JSON list holding one object per location in the same order. The objects do not carry the caller's names or IDs, so matching relies on order, which is why the code zips the response with the input rows. Batching cuts the number of HTTP round trips and keeps the code simple. It does not cut the cost against the rate limit, because the free tier counts each location, and weighs long periods and many variables more heavily. Batches of around ten locations and a short pause between them keep a script well inside the limits. The same pattern works for the forecast and air-quality APIs.
The output shape decides how easily the weather joins to the rest of the work. A long table with a place identifier and a date is the natural form for joins to sales, crop yields or events, and for group-by summaries. A wide table suits plotting. A GeoDataFrame of places with their summary statistics is what a map needs. Each place's value comes from its nearest grid cell, so two places close together may share a cell and get identical weather.
Local days, many places and shared cells
timezone=auto: each location's days are counted in its own local time zone.- Very many places: for thousands of points on a regular grid, gridded data (ERA5 as Zarr or NetCDF) is far more efficient than point requests.
- Order, not names: never sort or deduplicate the inputs between building the request and reading the response.
- Shared cells: places within one 0.25° cell get the same values; aggregate by cell first if that matters.
Internal links
- How to get historical weather data in Python — the single-location request
- Fixing Open-Meteo 429 Too Many Requests — staying under the limit
- How to make a weather map in Python — mapping the results
FAQ
How do I get weather data for multiple locations in Python?
Send comma-separated latitudes and longitudes to the Open-Meteo API and match the returned list to your locations by order.
Is it faster to request many locations at once?
It saves round trips, but each location still counts against the rate limit.
How do I join weather data to my locations?
Build a long table with a location ID and date, then merge it with your table on those columns.
Why do two nearby locations have identical weather?
They fall in the same grid cell of the underlying reanalysis.