
How to Build a Repeat-Sales House Price Index in Python
On this page
Problem statement
Six years of Price Paid files, 2019 to 2024, contain 371,254 consecutive sales of the same home with the same type and tenure. Those pairs are the raw material of a repeat-sales index, the method behind Case-Shiller: each home is compared with itself, so the index measures how values changed rather than which homes happened to sell. Getting from the files to the index means matching a property across years by postcode and address, dropping pairs that are not like-for-like — a new build resold, a resale within six months, a price that implies a change beyond ±50% a year — and regressing the log price changes on year dummies.
This page builds an annual repeat-sales index for England and Wales from the 2019 to 2024 Price Paid files. It matches properties by postcode and address, cleans the pairs, estimates the index with the Bailey-Muth-Nourse regression, and compares it with a simple median index.
Quick answer
Find properties sold at least twice, then regress log price changes on period dummies:
pairs = build_pairs(A)
years = list(range(2019, 2025))
X = np.zeros((len(pairs), len(years) - 1))
for j, y in enumerate(years[1:]):
    X[:, j] = (pairs.y2 == y).astype(int) - (pairs.y1 == y).astype(int)
beta = np.linalg.lstsq(X, np.log(pairs.p2 / pairs.p1).values, rcond=None)[0]
index = pd.Series(100 * np.exp(np.r_[0, beta]), index=years)
print(f"repeat-sale pairs: {len(pairs):,}")
print("repeat-sales index (2019 = 100):", index.round(1).to_dict())
repeat-sale pairs: 308,237
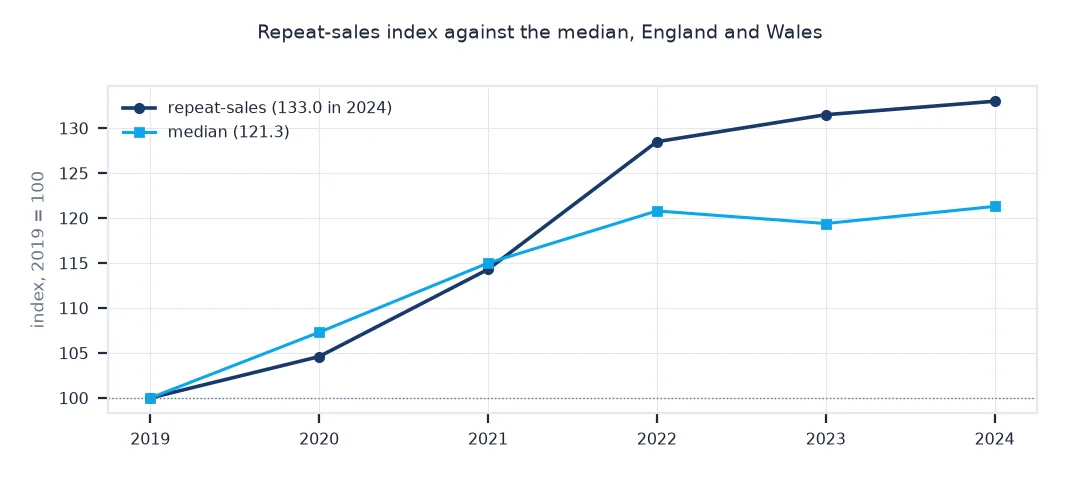
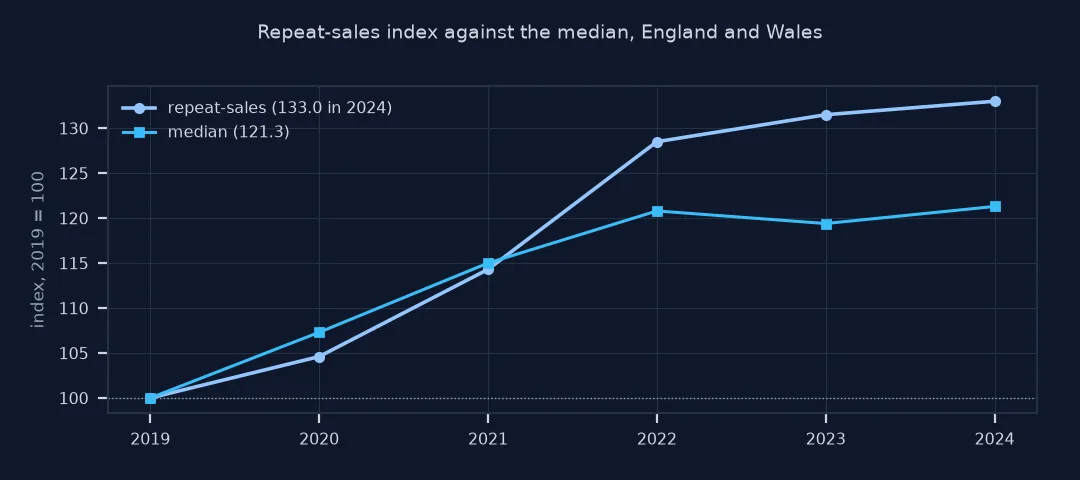
repeat-sales index (2019 = 100): {2019: 100.0, 2020: 104.6, 2021: 114.3, 2022: 128.5, 2023: 131.5, 2024: 133.0}
308,237 clean pairs give an index that rises from 100 in 2019 to 133.0 in 2024. The fastest year was 2022, +12.4% on 2021, and the slowest 2024, +1.1%.
Match properties, clean pairs, compare with a median index
1. Matching the same property
There is no property ID across sales. Build an address key from postcode, primary and secondary address and street, and keep property type and tenure unchanged between sales:
key = A.postcode.fillna("") + "|" + A.paon.fillna("") + "|" + A.saon.fillna("") + "|" + A.street.fillna("")
counts = key.value_counts()
print(f"standard sales {len(A):,}; distinct address keys {len(counts):,}; keys with 2+ sales {(counts >= 2).sum():,}; with 3+ {(counts >= 3).sum():,}")
standard sales 5,065,502; distinct address keys 4,685,688; keys with 2+ sales 366,003; with 3+ 13,465
The 5,065,502 sales come from 4,685,688 distinct addresses. 366,003 sold at least twice in the six years, and 13,465 three times or more.
2. Cleaning the pairs
Drop pairs with a new build as the first sale (a new home is not the same product later), pairs less than six months apart, and extreme price ratios that signal a different property or a non-market sale:
raw = build_pairs(A, clean=False)
print(f"raw consecutive pairs: {len(raw):,}")
print(f"first sale a new build: {(raw.new1 == 'Y').sum():,}; under 6 months apart: {(raw.gap_days < 182).sum():,}; annual change beyond ±50%: {(raw.ann.abs() > 0.5).sum():,}")
print(f"pairs kept: {len(pairs):,} ({len(pairs) / len(raw):.0%})")
raw consecutive pairs: 371,254
first sale a new build: 42,576; under 6 months apart: 8,078; annual change beyond ±50%: 16,338
pairs kept: 308,237 (83%)
Of 371,254 consecutive pairs with the same type and tenure, 42,576 start with a new build and 8,078 are less than six months apart. 16,338 imply an annual change beyond ±50%. Removing them keeps 308,237 pairs, 83%.
3. Against a median index
med = A.groupby(A.date.dt.year).price.median()
med_idx = 100 * med / med.iloc[0]
cmp = pd.DataFrame({"repeat-sales": index, "median": med_idx}).round(1)
print(cmp.to_string())
print(f"2024: repeat-sales {index[2024] - 100:+.1f}%, median {med_idx[2024] - 100:+.1f}%")
repeat-sales median
2019 100.0 100.0
2020 104.6 107.3
2021 114.3 115.0
2022 128.5 120.8
2023 131.5 119.4
2024 133.0 121.3
2024: repeat-sales +33.0%, median +21.3%
The two indices agree until 2021, then part: by 2024 the repeat-sales index is up 33.0% and the median only 21.3%. The median depends on which homes happened to sell each year, while the repeat-sales index compares each home with itself.
How long between sales
The data used on this page
The yearly Price Paid Data files for 2019 to 2024 from HM Land Registry (© Crown copyright 2026, Open Government Licence v3.0), standard sales only, with the address fields needed to match properties.
from pathlib import Path

import numpy as np
import pandas as pd
import requests

Path("data").mkdir(exist_ok=True)
COLS = ["transaction_id", "price", "date", "postcode", "property_type", "old_new", "duration", "paon", "saon",
        "street", "locality", "town", "district", "county", "ppd_category", "record_status"]
frames = []
for y in range(2019, 2025):
    f = Path(f"data/pp-{y}.csv")
    if not f.exists():
        r = requests.get(f"http://prod1.publicdata.landregistry.gov.uk.s3-website-eu-west-1.amazonaws.com/pp-{y}.csv", timeout=1800); r.raise_for_status(); f.write_bytes(r.content)
    frames.append(pd.read_csv(f, header=None, names=COLS, usecols=["price", "date", "postcode", "property_type", "old_new", "duration", "paon", "saon", "street", "ppd_category"], parse_dates=["date"]))
A = pd.concat(frames).query("ppd_category == 'A'")
A = A[A.date.between("2019-01-01", "2024-12-31")]

def build_pairs(df, clean=True):
    """Consecutive sales of the same address, type and tenure."""
    d = df.assign(key=df.postcode.fillna("") + "|" + df.paon.fillna("") + "|" + df.saon.fillna("") + "|" + df.street.fillna(""))
    d = d[d.key.duplicated(keep=False)].sort_values(["key", "date"])
    nxt = d.groupby("key").shift(-1)
    pr = pd.DataFrame({"p1": d.price, "p2": nxt.price, "d1": d.date, "d2": nxt.date, "new1": d.old_new,
                       "same": (d.property_type == nxt.property_type) & (d.duration == nxt.duration)}).dropna(subset=["p2"])
    pr = pr[pr.same]
    pr["y1"], pr["y2"] = pr.d1.dt.year, pr.d2.dt.year
    pr["gap_days"] = (pr.d2 - pr.d1).dt.days
    pr["ann"] = (pr.p2 / pr.p1) ** (365.25 / pr.gap_days.clip(lower=1)) - 1
    if clean:
        pr = pr[(pr.new1 != "Y") & (pr.gap_days >= 182) & (pr.ann.abs() <= 0.5)]
    return pr
print(f"{len(A):,} standard sales, 2019-2024")
5,065,502 standard sales, 2019-2024
The six files hold 5,065,502 standard sales.
Example 1: how long between sales
The pairs show how often homes change hands:
yrs = pairs.gap_days / 365.25
print(f"years between sales: median {yrs.median():.1f}; share within 2 years {(yrs < 2).mean():.0%}")
print(f"median annual change across pairs: {pairs.ann.median():+.1%}")
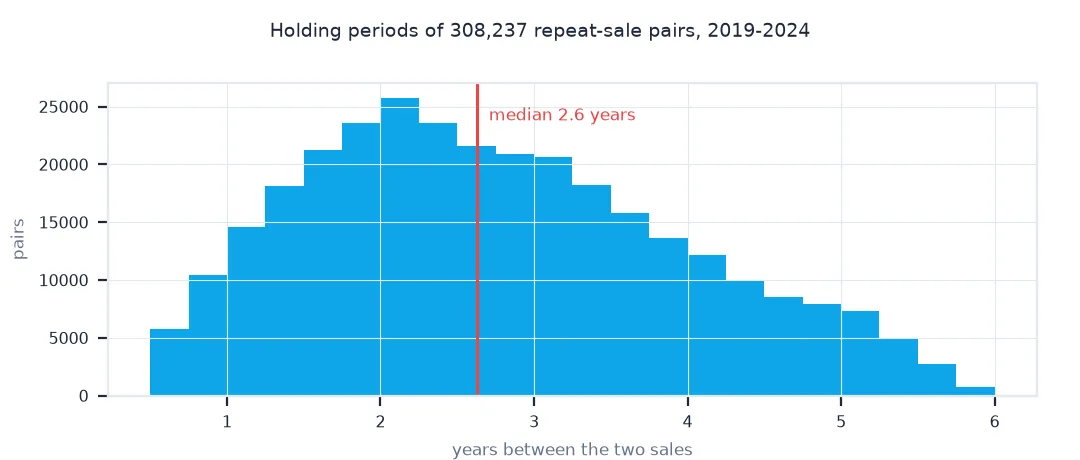
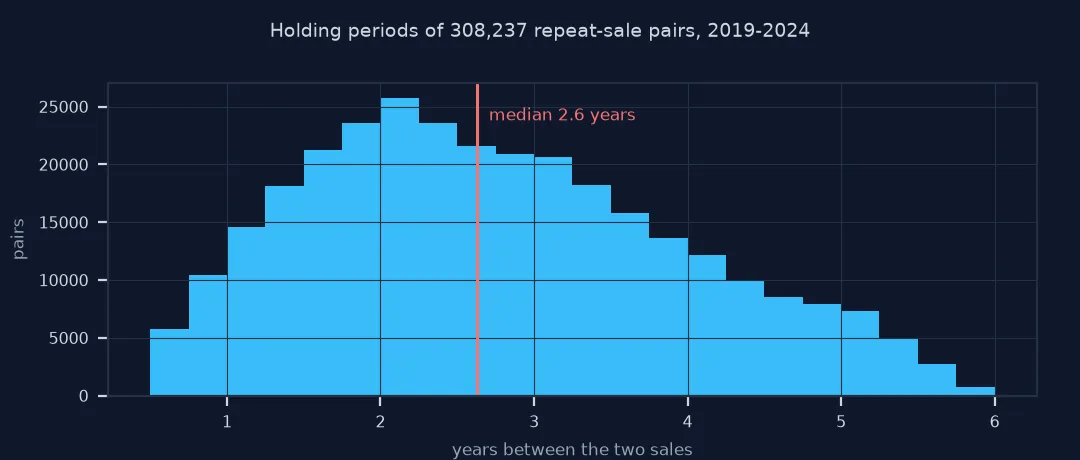
years between sales: median 2.6; share within 2 years 30%
median annual change across pairs: +6.4%
Pairs are a median 2.6 years apart, and 30% resold within two years. The median pair gained 6.4% a year.
Each property compared only with itself
A repeat-sales index compares each property only with itself, so its characteristics, such as size, location and type, cancel out. The Bailey-Muth-Nourse method, the basis of Case-Shiller, models the log of each pair's price ratio as the difference between the index values at the two sale dates, and estimates all index values together by least squares, with one period as the base. Case-Shiller adds weights for pairs with long gaps, which carry more noise, but the core is this regression.
The method's weaknesses come from its data. Only properties that sold twice count, which over six years is a minority, and those may not be typical, since flats and starter homes turn over faster. Renovations, extensions and decline between sales are attributed to the market, and matching by address can link different flats or miss the same house written two ways. Filters for new builds, short gaps and extreme changes remove some of this, at the cost of fewer pairs. Against a median index, a repeat-sales index is far less sensitive to changes in the mix of what sold.
Longer windows, weights and revisions
- Longer windows: more years give more pairs; the complete file since 1995 supports quarterly or monthly indices.
- Weights: Case-Shiller down-weights pairs with long holding periods; a second-stage regression on squared residuals gives the weights.
- Revisions: adding new pairs re-estimates past index values; repeat-sales indices are revised as data arrives.
- Address normalisation: case, punctuation and flat naming vary; normalise PAON and SAON before matching.
Internal links
- How to build a house price time series from Land Registry data in Python — the median approach
- House price index methods explained — the three main methods
- How to build a hedonic price model for Airbnb listings in Python — the hedonic alternative
FAQ
What is a repeat-sales house price index?
An index built only from properties that sold more than once, comparing each with itself so that differences between homes cancel out.
How do I build a Case-Shiller style index in Python?
Find pairs of sales of the same property, regress the log price ratio on period dummies (-1 at the first sale's period, +1 at the second's), and exponentiate the coefficients.
How do I match the same property in Land Registry data?
Combine postcode, PAON, SAON and street into a key, and require the same property type and tenure.
Why does a repeat-sales index differ from median prices?
Medians change with the mix of homes sold; repeat-sales indices hold the property fixed.