
MODIS Sinusoidal Tiles Do Not Line Up
On this page
Problem statement
You read a MODIS land product — snow cover, NDVI, land surface temperature — for a box drawn in longitude and latitude, and something is off. Half the window is empty. Two adjacent days' tiles do not join. Overlaid on a basemap the image is skewed, or sits tens of kilometres from where it should be. MODIS land products are delivered on a sinusoidal grid in 10° tiles, a projection almost nothing else uses, and each of these symptoms comes from treating that grid like longitude and latitude.
This page reads MOD10A1 snow cover for 25 February 2024 over a 0.4° box straddling 40° N in the Colorado Rockies, where two tiles meet, and reproduces each symptom with its fix.
Quick answer
Find every tile that touches your box, mosaic them in their own projection, and place the result using its own coordinates — reproject it, or plot each pixel at its true longitude and latitude:
items = [i for i in catalog.search(collections=["modis-10A1-061"], bbox=BOX, datetime="2024-02-25/2024-02-25").items()
         if i.id.startswith("MOD10A1")]
srcs = [rasterio.open(i.assets["NDSI_Snow_Cover"].href) for i in sorted(items, key=lambda i: i.id)]
sin_box = transform_bounds("EPSG:4326", srcs[0].crs, *BOX)
mosaic, tr = merge(srcs, bounds=sin_box, nodata=255)
utm, utm_tr = to_utm(mosaic[0], tr, srcs[0].crs)
print([i.id.split(".")[2] for i in items], mosaic.shape[1:], "sinusoidal ->", utm.shape, "in UTM 13N at 500 m")
['h09v05', 'h09v04'] (96, 187) sinusoidal -> (91, 279) in UTM 13N at 500 m
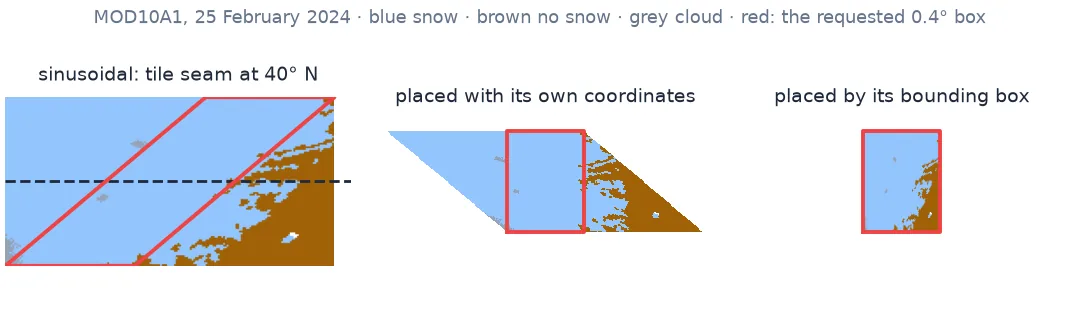
Count tiles, read both, never place by bounding box
1. Count the tiles
MODIS tiles are 10° by 10° on the sinusoidal grid, numbered h (west–east) and v (north–south). Tile rows break at multiples of 10° latitude, so a box crossing 40° N needs two tiles every day:
for s, i in zip(srcs, sorted(items, key=lambda i: i.id)):
    print(i.id.split(".")[2], "y from", round(s.bounds.bottom), "to", round(s.bounds.top))
print("40 N in sinusoidal metres:", round(Transformer.from_crs(4326, srcs[0].crs, always_xy=True).transform(-105.7, 40.0)[1]))
h09v04 y from 4447802 to 5559753
h09v05 y from 3335852 to 4447802
40 N in sinusoidal metres: 4447802
2. Read both, or half the box is empty
Reading one tile with a window over the whole box fills the part outside the tile with nodata:
for s, i in zip(srcs, sorted(items, key=lambda i: i.id)):
    w = from_bounds(*sin_box, s.transform).round_offsets().round_lengths()
    a = s.read(1, window=w, boundless=True, fill_value=255)
    print(i.id.split(".")[2], "alone:", f"{(a == 255).mean():.0%} of the window is fill")
print("merged:", f"{(mosaic[0] == 255).mean():.0%} fill, {(mosaic[0] <= 100).mean():.0%} clear land")
h09v04 alone: 50% of the window is fill
h09v05 alone: 50% of the window is fill
merged: 0% fill, 99% clear land
rasterio.merge.merge joins tiles cleanly because they share one grid: the seam is exact, with no resampling.
3. Know why the window is so wide
In the sinusoidal projection a meridian's x coordinate is R · longitude · cos(latitude), so meridians lean, more steeply the further they are from 0°. At 106° W they lean a long way:
t = Transformer.from_crs(4326, srcs[0].crs, always_xy=True)
xa, _ = t.transform(-105.9, 39.8); xb, _ = t.transform(-105.9, 40.2)
x0, x1 = sin_box[0], sin_box[2]
print(f"the 105.9 W meridian moves {abs(xb - xa) / 1000:.1f} km in x between 39.8 and 40.2 N")
print(f"the box is {abs(t.transform(-105.5, 40)[0] - t.transform(-105.9, 40)[0]) / 1000:.1f} km wide, its sinusoidal window {(x1 - x0) / 1000:.1f} km")
the 105.9 W meridian moves 52.8 km in x between 39.8 and 40.2 N
the box is 34.1 km wide, its sinusoidal window 86.8 km
The 0.4° box is a slanted parallelogram on the sinusoidal grid; its bounding rectangle is more than twice as wide. That is expected, not a bug — but the extra pixels lie outside the box and must not be counted as inside it.
4. Never place it by its bounding box
The common mistake is to plot the window with the box's longitude–latitude extent, as if its rows and columns were parallels and meridians:
inv = Transformer.from_crs(srcs[0].crs, 4326, always_xy=True)
H, W = mosaic.shape[1:]
for (r, c), name in (((0, 0), "top-left"), ((H - 1, W - 1), "bottom-right")):
    lon, lat = inv.transform(*(tr * (c + 0.5, r + 0.5)))
    naive = BOX[0] + (c + 0.5) / W * (BOX[2] - BOX[0])
    print(f"{name:12} pixel is at {lon:.3f} E; placed naively at {naive:.3f} E - {abs(lon - naive) * 111.32 * np.cos(np.radians(lat)):.0f} km off")
top-left pixel is at -106.516 E; placed naively at -105.899 E - 52 km off
bottom-right pixel is at -104.892 E; placed naively at -105.501 E - 52 km off
Corner pixels land fifty kilometres from where they belong. In the middle of the box the error is smaller, which is why the mistake can look almost right.
5. Reproject for use with other data
To combine MODIS with anything in longitude–latitude or UTM, reproject. Nearest-neighbour keeps the codes (250 cloud, 237 water) intact:
print(utm_tr.a, "m pixels;", f"{(utm <= 100).mean():.0%} clear land in the UTM grid")500.0 m pixels; 60% clear land in the UTM grid
The rest of the UTM grid is fill: the slanted sinusoidal footprint becomes a rectangle in UTM only by padding its corners.
Pixels inside the box, and the tile for a point
The data used on this page
MODIS/Terra Snow Cover Daily L3 Global 500m SIN Grid, Version 61 (MOD10A1.061), tiles h09v04 and h09v05 for 25 February 2024, Hall, D. K. and G. A. Riggs, NASA NSIDC DAAC, via Microsoft Planetary Computer.
import numpy as np
import planetary_computer
import pystac_client
import rasterio
from pyproj import Transformer
from rasterio.merge import merge
from rasterio.transform import array_bounds
from rasterio.warp import Resampling, calculate_default_transform, reproject, transform_bounds
from rasterio.windows import from_bounds

catalog = pystac_client.Client.open("https://planetarycomputer.microsoft.com/api/stac/v1",
                                    modifier=planetary_computer.sign_inplace)
BOX = (-105.9, 39.8, -105.5, 40.2)                  # lon/lat, straddling 40 N in the Front Range

def to_utm(a, tr, crs, res=500):
    """Reproject a sinusoidal array to UTM 13N with nearest neighbour, keeping the 255 fill."""
    h, w = a.shape
    t, wd, ht = calculate_default_transform(crs, "EPSG:32613", w, h, *array_bounds(h, w, tr), resolution=res)
    out = np.full((ht, wd), 255, np.uint8)
    reproject(a, out, src_transform=tr, src_crs=crs, dst_transform=t, dst_crs="EPSG:32613",
              resampling=Resampling.nearest, src_nodata=255, dst_nodata=255)
    return out, t

print(BOX)
(-105.9, 39.8, -105.5, 40.2)
Example 1: keep only pixels inside the box
The sinusoidal window contains pixels outside the requested box. Mask them by their true coordinates before counting:
rr, cc = np.mgrid[0:H, 0:W]
xs, ys = tr * (cc + 0.5, rr + 0.5)
lon, lat = inv.transform(xs, ys)
inside = (lon >= BOX[0]) & (lon <= BOX[2]) & (lat >= BOX[1]) & (lat <= BOX[3])
a = mosaic[0]
print(f"{inside.mean():.0%} of the window's pixels are inside the box; snow-covered share inside: "
      f"{((a >= 10) & (a <= 100) & inside).sum() / ((a <= 100) & inside).sum():.0%}, whole window: "
      f"{((a >= 10) & (a <= 100)).sum() / (a <= 100).sum():.0%}")
39% of the window's pixels are inside the box; snow-covered share inside: 99%, whole window: 81%
Example 2: the tile for a point
The tile containing any longitude and latitude follows from the sinusoidal coordinates and the tile size:
TILE = 1111950.5197665233                          # 10 degrees at the equator, in sinusoidal metres
def modis_tile(lon, lat):
    x, y = Transformer.from_crs(4326, srcs[0].crs, always_xy=True).transform(lon, lat)
    return f"h{int((x + 18 * TILE) // TILE):02d}v{int((9 * TILE - y) // TILE):02d}"
print({p: modis_tile(*xy) for p, xy in {"Boulder": (-105.27, 40.01), "Denver": (-104.99, 39.74), "Zermatt": (7.75, 46.02)}.items()})
{'Boulder': 'h09v04', 'Denver': 'h09v05', 'Zermatt': 'h18v04'}
An equal-area grid whose meridians lean
The MODIS sinusoidal grid is equal-area: every 463 m cell covers the same ground everywhere, which is why NASA uses it for global land products. It achieves that by shrinking the east–west scale with the cosine of latitude, so meridians converge towards the poles and lean away from the central meridian. Far from 0° longitude, at 106° W, the lean is severe.
Three practical rules follow. A box defined in longitude and latitude is a slanted shape on the grid, and its bounding window includes pixels outside it — mask them by their true coordinates. Tiles join exactly in their own projection, so mosaic before reprojecting, never after. And any display or overlay must use the pixels' real coordinates, either by reprojecting the raster or by plotting each pixel where it is; placing the window by the box's corners shifts its edges by tens of kilometres.
Tile rows, mosaics and the sphere radius
- Tile rows break every 10° of latitude, columns every 10° at the equator; boxes near a break need two tiles.
- Mosaic in sinusoidal, then reproject once.
- Nearest-neighbour for categorical products and codes.
- Mask to the box by true coordinates; the window is wider than the box.
- The sphere radius is 6,371,007.181 m, not WGS 84 — keep the file's CRS rather than rebuilding it.
- Near the date line and poles tiles are partly empty by design.
Internal links
- How to make a MODIS snow cover time series — the daily product in use
- Polar data lands in the wrong place — the same class of mistake at the poles
- Snow cover and NDSI explained — what the values mean
- Polar stereographic projections explained — another unusual grid
- How to map sea-ice concentration — drawing a grid in its own projection
FAQ
Why do MODIS tiles not line up with my map?
MODIS land products use a sinusoidal projection in which meridians lean; plotting a tile as if its rows were parallels and its columns meridians misplaces it by up to tens of kilometres.
How do I mosaic MODIS tiles in Python?
Open each tile with rasterio and join them with rasterio.merge.merge in their native sinusoidal CRS, then reproject the mosaic once.
Which MODIS tile is my location in?
Convert longitude and latitude to sinusoidal coordinates and divide by the tile size, 1,111,950.52 m: Boulder, Colorado (40.01° N) is in h09v04, just north of the 40° N tile break, and Denver in h09v05.
Why is my MODIS window much wider than my bounding box?
A longitude–latitude box is a slanted parallelogram on the sinusoidal grid; its bounding rectangle can be more than twice the box's width at mid-latitudes far from 0°.