
How to Measure Glacier Retreat with Outlines and Sentinel-2 in Python
On this page
Problem statement
Glacier retreat is usually reported as one number — "the tongue has retreated three kilometres since 1850" — and measuring it looks easy: compare where the ice ended at two dates. Doing it reproducibly raises three questions. Distance along what line, when a valley glacier's tongue curves? From which outlines, when inventory areas disagree between analysts? And what does a satellite actually see at the end of a glacier in late summer, when the lowest kilometre or two may be buried under rock debris?
This page measures the retreat of the Great Aletsch Glacier along its centreline from GLIMS outlines for 1850, 1926, 1973, 2000 and 2017, and extends the record with two cloud-free Sentinel-2 scenes from August 2016 and August 2025 — measuring what they can and cannot show.
Quick answer
Build a centreline down the tongue, find how far along it each outline reaches, and difference the positions:
s = np.arange(0, centreline.length, 10)
termini = {}
for year in (1850, 1926, 1973, 2000, 2017):
    geom = outlines.loc[outlines.year == year, "geometry"].iloc[0]
    inside = np.array([geom.contains(centreline.interpolate(v)) for v in s])
    termini[year] = s[np.nonzero(inside)[0].max()]
t = pd.Series(termini)
print(t.to_dict(), "m along the centreline")
print("retreat:", {f"{a}-{b}": int(t[a] - t[b]) for a, b in zip(t.index[:-1], t.index[1:])}, "m;",
      f"1850-2017 total {t[1850] - t[2017]:,.0f} m")
{1850: 11950.0, 1926: 10180.0, 1973: 9310.0, 2000: 8540.0, 2017: 7670.0} m along the centreline
retreat: {'1850-1926': 1770, '1926-1973': 870, '1973-2000': 770, '2000-2017': 870} m; 1850-2017 total 4,280 m
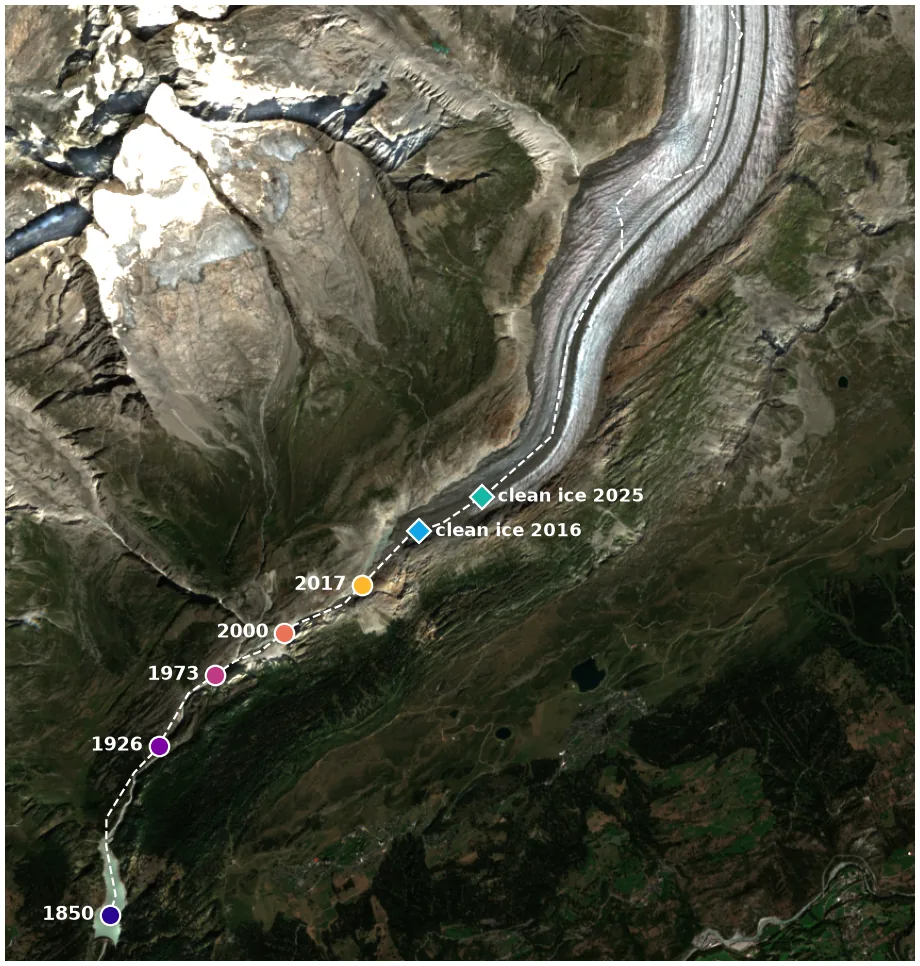
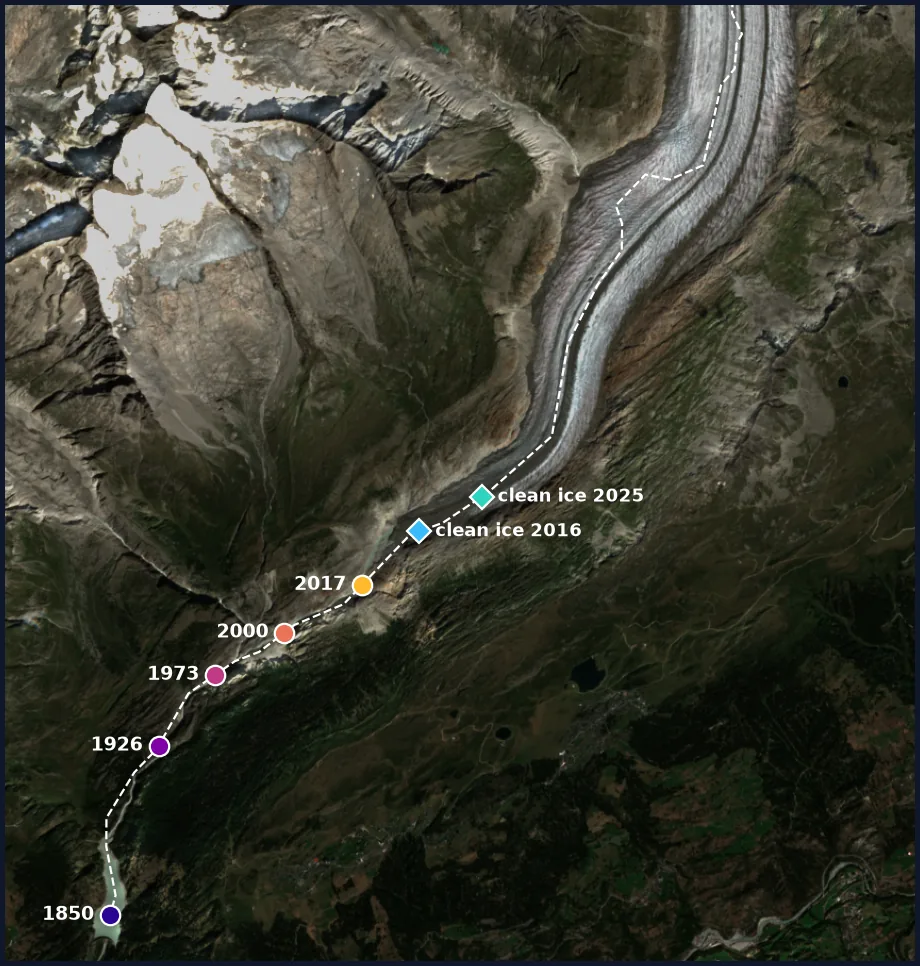
Outlines, a centreline, terminus positions, Sentinel-2
1. Choose the outlines
Retreat at the terminus is robust to most of the boundary decisions that make inventory areas disagree: analysts argue about divides and rock outcrops high up, not about where the tongue ends. Still, use one record per date and note who made it:
print(outlines[["year", "chief_affl", "km2"]].to_string(index=False)) year chief_affl km2
1850 University of Zurich-Irchel 105.54
1926 GLAMOS (Glacier Monitoring Switzerland) 99.61
1973 University of Zurich-Irchel 86.57
2000 Friedrich-Alexander University (FAU) 84.22
2017 GLAMOS (Glacier Monitoring Switzerland) 78.44
2. Build a centreline
Straight-line distances between terminus points understate retreat on a curving tongue. A centreline that follows the valley is the standard reference. Here it is built from cross-sections of the 1850 outline: walk down a rough axis, cut across the glacier at each step, and take the midpoint of each cut:
print(f"centreline: {centreline.length:,.0f} m, {len(centreline.coords)} vertices after simplifying")centreline: 11,960 m, 30 vertices after simplifying
3. Measure each terminus along it
The terminus at each date is the furthest point along the centreline still inside that date's outline — the quick answer's loop. The retreat rate varies from period to period:
years = np.array(t.index)
rate = -np.diff(t.values) / np.diff(years)
for (a, b), r in zip(zip(years[:-1], years[1:]), rate):
    print(f"{a}-{b}: {r:5.1f} m per year")
1850-1926: 23.3 m per year
1926-1973: 18.5 m per year
1973-2000: 28.5 m per year
2000-2017: 51.2 m per year
4. Look at the tongue from Sentinel-2
Late-summer Sentinel-2 imagery shows the bare tongue clearly. The snow index (NDSI) that separates snow and clean ice from rock does well on the clean ice — and fails on the lowest part of the tongue, where the ice is covered by rock debris:
for d, path in SCENES.items():
    ndsi, tr = load_ndsi(path)
    at_2017 = ndsi_at(ndsi, tr, centreline.interpolate(t[2017]))
    print(f"{d}: NDSI at the 2017 terminus {at_2017:+.2f}; 4 km up-glacier {ndsi_at(ndsi, tr, centreline.interpolate(t[2017] - 4000)):+.2f}")
2016-08-23: NDSI at the 2017 terminus -0.13; 4 km up-glacier +0.88
2025-08-26: NDSI at the 2017 terminus -0.12; 4 km up-glacier +0.86
At the terminus GLIMS mapped in 2017, the NDSI is that of rock, not ice: the last stretch of the glacier is debris-covered, and from above it looks like the moraines beside it. NDSI cannot find this terminus.
5. Measure what Sentinel-2 can see: the clean-ice limit
What the index can track is where clean ice ends. Across each cross-section of the tongue, count the share of pixels with NDSI above 0.4, and find where it falls below 5% and stays there:
limits = {}
for d, path in SCENES.items():
    ndsi, tr = load_ndsi(path)
    stations, share = clean_share(ndsi, tr)
    first = next(i for i in range(len(stations)) if np.nan_to_num(share[i:i + 12], nan=0).max() < 0.05)
    limits[d] = int(stations[first])
print(limits, f"- the clean-ice limit moved {limits['2016-08-23'] - limits['2025-08-26']:.0f} m up-glacier in nine years")
{'2016-08-23': 6925, '2025-08-26': 6250} - the clean-ice limit moved 675 m up-glacier in nine years
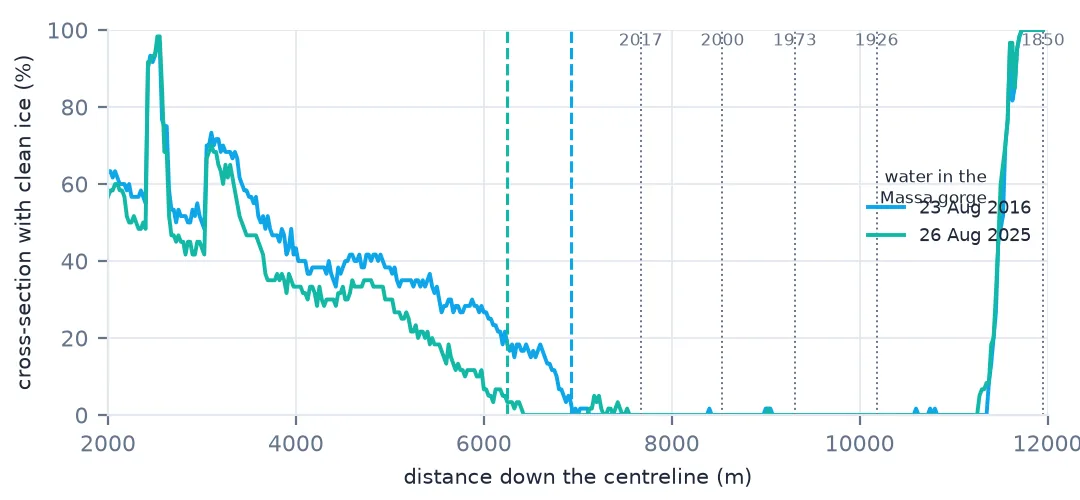
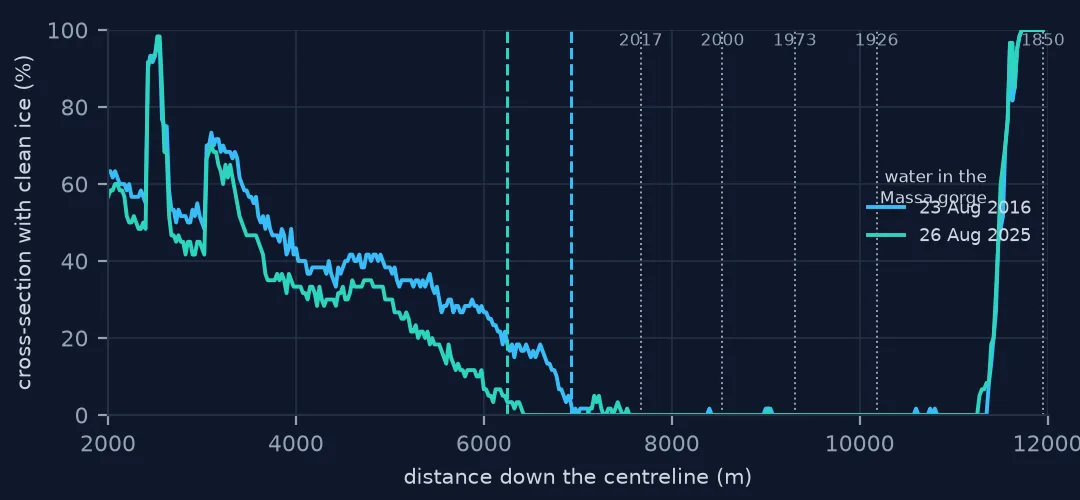
That is not terminus retreat, but it is a real and measurable change in the same direction: the clean ice is giving way to debris-covered ice further up the glacier each year.
Straight lines understate retreat
The data used on this page
Glacier outlines from the GLIMS Glacier Database (NSIDC), glacier G008032E46504N. Copernicus Sentinel-2 Level-2A scenes S2A_MSIL2A_20160823T103022_R108_T32TMS and S2C_MSIL2A_20250826T103051_R108_T32TMS (Copernicus Sentinel data 2016, 2025, processed by ESA) via Microsoft Planetary Computer.
from pathlib import Path

import geopandas as gpd
import numpy as np
import pandas as pd
import planetary_computer
import pystac_client
import rasterio
import requests
from rasterio.enums import Resampling
from rasterio.warp import transform_bounds
from rasterio.windows import from_bounds
from shapely import make_valid
from shapely.geometry import LineString

Path("data").mkdir(exist_ok=True)
GLIMS = ("https://www.glims.org/geoserver/GLIMS/ows?service=WFS&version=1.0.0&request=GetFeature"
         "&typeName=GLIMS:GLIMS_Glacier_Outlines&outputFormat=application/json&bbox=7.95,46.40,8.15,46.56")
if not Path("data/glims_aletsch.json").exists():
    Path("data/glims_aletsch.json").write_bytes(requests.get(GLIMS, timeout=300).content)
catalog = pystac_client.Client.open("https://planetarycomputer.microsoft.com/api/stac/v1",
                                    modifier=planetary_computer.sign_inplace)
SCENES = {"2016-08-23": "S2A_MSIL2A_20160823T103022_R108_T32TMS_20210212T171641",
          "2025-08-26": "S2C_MSIL2A_20250826T103051_R108_T32TMS_20250827T091516"}
BOX = (7.99, 46.37, 8.10, 46.45)
CRS_UTM = "EPSG:32632"

g = gpd.read_file("data/glims_aletsch.json")
outlines = g[(g.glac_id == "G008032E46504N") & (g.line_type == "glac_bound")].to_crs(CRS_UTM)
outlines = outlines[outlines.area > 1e6].sort_values("src_date").drop_duplicates("src_date", keep="last")
outlines = outlines.assign(year=outlines.src_date.dt.year, km2=(outlines.area / 1e6).round(2),
                           geometry=outlines.geometry.apply(make_valid))
outlines = outlines[outlines.year.isin([1850, 1926, 1973, 2000, 2017])]

# centreline: midpoints of cross-sections of the 1850 outline along a rough valley axis
axis = LineString([(429800, 5144600), (427200, 5141200), (425000, 5139000), (423400, 5136700), (423000, 5135600)])
g1850 = outlines.loc[outlines.year == 1850, "geometry"].iloc[0]
mids = []
for d in np.arange(0, axis.length, 100):
    p, q = axis.interpolate(d), axis.interpolate(min(d + 1, axis.length))
    tv = np.array([q.x - p.x, q.y - p.y]); tv /= np.hypot(*tv); n = np.array([-tv[1], tv[0]])
    cut = LineString([(p.x - n[0] * 1500, p.y - n[1] * 1500), (p.x + n[0] * 1500, p.y + n[1] * 1500)]).intersection(g1850)
    if not cut.is_empty:
        cut = max(getattr(cut, "geoms", [cut]), key=lambda c: c.length)
        mids.append(cut.interpolate(0.5, normalized=True))
centreline = LineString([(m.x, m.y) for m in mids]).simplify(30)

def load_ndsi(item_id):
    """NDSI on the 10 m grid for BOX; applies the L2A offset only for processing baseline 04.00 and later."""
    item = catalog.get_collection("sentinel-2-l2a").get_item(item_id)
    off = 1000 if float(item.properties["s2:processing_baseline"]) >= 4 else 0
    bands = {}
    for b in ("B03", "B11"):
        with rasterio.open(item.assets[b].href) as src:
            w = from_bounds(*transform_bounds(4326, src.crs, *BOX), src.transform).round_offsets().round_lengths()
            sc = 2 if src.res[0] == 20 else 1
            bands[b] = (src.read(1, window=w, out_shape=(int(w.height * sc), int(w.width * sc)),
                                 resampling=Resampling.nearest).astype(float) - off) / 1e4
            if b == "B03":
                tr = src.window_transform(w)
    r, c = min(v.shape[0] for v in bands.values()), min(v.shape[1] for v in bands.values())
    gr, sw = bands["B03"][:r, :c], bands["B11"][:r, :c]
    return (gr - sw) / (gr + sw + 1e-9), tr

def ndsi_at(ndsi, tr, p, half=3):
    c, r = ~tr * (p.x, p.y)
    return float(np.median(ndsi[int(r) - half:int(r) + half + 1, int(c) - half:int(c) + half + 1]))

def clean_share(ndsi, tr, start=2000, step=25):
    """Share of each cross-section of the 1850 outline with NDSI > 0.4, every `step` m down the centreline."""
    stations = np.arange(start, centreline.length, step)
    share = []
    for v in stations:
        p, q = centreline.interpolate(v), centreline.interpolate(min(v + 1, centreline.length))
        tv = np.array([q.x - p.x, q.y - p.y]); tv /= np.hypot(*tv); n = np.array([-tv[1], tv[0]])
        cut = LineString([(p.x - n[0] * 1200, p.y - n[1] * 1200), (p.x + n[0] * 1200, p.y + n[1] * 1200)]).intersection(g1850)
        vals = []
        if not cut.is_empty:
            for u in np.linspace(0, 1, 60):
                pp = cut.interpolate(u, normalized=True)
                c, r = ~tr * (pp.x, pp.y)
                if 0 <= int(r) < ndsi.shape[0] and 0 <= int(c) < ndsi.shape[1]:
                    vals.append(ndsi[int(r), int(c)])
        share.append(np.mean(np.array(vals) > 0.4) if vals else np.nan)
    return stations, np.array(share)

print(len(outlines), "outlines;", f"centreline {centreline.length:,.0f} m")
5 outlines; centreline 11,960 m
Example 1: straight-line distance understates retreat
Compare the along-centreline retreat with the straight distance between terminus points:
pts = {y: centreline.interpolate(d) for y, d in termini.items()}
for a, b in ((1850, 2017), (1973, 2017)):
    print(f"{a}-{b}: along the centreline {termini[a] - termini[b]:,.0f} m, straight line {pts[a].distance(pts[b]):,.0f} m")
1850-2017: along the centreline 4,280 m, straight line 3,903 m
1973-2017: along the centreline 1,640 m, straight line 1,619 m
Example 2: the processing baseline offset
The 2016 scene was processed with baseline 02.12, the 2025 one with 05.11. Applying the 1,000 offset to the older scene shifts every reflectance:
item16 = catalog.get_collection("sentinel-2-l2a").get_item(SCENES["2016-08-23"])
print("2016 baseline:", item16.properties["s2:processing_baseline"])
ndsi16, tr16 = load_ndsi(SCENES["2016-08-23"])
p = centreline.interpolate(4000)
c, r = ~tr16 * (p.x, p.y)
with rasterio.open(item16.assets["B03"].href) as src:
    w = from_bounds(*transform_bounds(4326, src.crs, *BOX), src.transform).round_offsets().round_lengths()
    dn = src.read(1, window=w)[int(r), int(c)]
print(f"green DN on clean ice {dn}: reflectance {dn / 1e4:.3f} without offset, {(dn - 1000) / 1e4:.3f} if the offset were wrongly applied")
2016 baseline: 02.12
green DN on clean ice 2654: reflectance 0.265 without offset, 0.165 if the offset were wrongly applied
Why the terminus is the robust measure
Terminus position is the most robust single measure of a glacier's change because it depends on one boundary everyone agrees on: where the ice ends in its valley. Measured along a centreline, it gives a retreat distance that is comparable between dates and between glaciers, and on the Great Aletsch it shows a steady retreat from 1850 to 2017, accelerating in the most recent period.
Satellites complicate the picture in an instructive way. A late-summer image shows the glacier surface, and the lowest part of many valley glaciers is buried under rock that has fallen onto the ice and melted out of it. Spectrally that debris is rock; the snow index sees no ice there. A terminus "mapped" from NDSI would be the end of the clean ice, kilometres above the true terminus — and would appear to retreat faster than the glacier as debris cover spreads upwards.
So the two measurements answer different questions. Inventory outlines, drawn by analysts who use topography, flow features and field knowledge to follow the ice under its debris, give the terminus. The snow index gives the clean-ice limit — useful in its own right, since a growing debris cover changes how a glacier melts, but not the same thing. Saying which one is being measured is the whole difference between a correct and an alarming number.
Debris, water NDSI and processing baselines
- Measure along a centreline, not in a straight line, on curving tongues.
- Debris-covered ice hides the terminus from optical indices.
- Water has high NDSI too; the reservoir in the Massa gorge below the 1850 terminus scores like snow.
- Processing baseline decides the L2A offset; check
s2:processing_baselineper scene. - Late-summer scenes minimise seasonal snow on the tongue; check for fresh snow.
- One analyst per date keeps boundary decisions out of the comparison.
Internal links
- Glacier inventories explained — the outlines and their differences
- How to compute glacier hypsometry from a DEM — where the area was lost
- Snow cover and NDSI explained — the index and its limits
- NDSI snow confused with cloud or water — the reservoir trap
- How to map snow cover from Sentinel-2 — the same data for snow
FAQ
How do I measure glacier retreat in Python?
Build a centreline down the glacier tongue, find the furthest point along it inside each dated outline, and difference the positions; divide by the years for a rate.
How far has the Great Aletsch Glacier retreated?
Along its centreline, about 4.3 km between the 1850 and 2017 GLIMS outlines.
Can I map a glacier terminus from Sentinel-2?
Only where the terminus is clean ice. Where the tongue is debris-covered, as at Aletsch, the snow index finds the end of the clean ice, not the end of the glacier.
Why does the processing baseline matter for Sentinel-2?
From baseline 04.00 (2022 onward) L2A reflectances carry a +1000 offset; older processing does not. Applying the offset to an older scene shifts every reflectance by 0.1.