
Snow Depth Data Has Gaps, Zeros and Impossible Values
On this page
Problem statement
Station snow records look simple — a depth in millimetres every day — and produce strange statistics the moment you summarise them. A mean winter snow depth that was four times higher a century ago. A single day with three and a half metres of snow on the plains. A record that says "0" on days with a fresh snowfall. Each of these is a real feature of how the observations were made and stored, and each has a specific fix that is not "drop the NaNs".
This page works through the GHCN-Daily record for Boulder, Colorado — snow depth since 1897 — and diagnoses the four problems that break most first attempts: values that failed quality control, gaps that are not random, zeros that are traces, and a record that is still changing.
Quick answer
Read the flags, drop quality-flagged values, treat trace as zero snow on the ground, and decide which winters are complete enough to use — never fill or drop missing days blindly:
fl = d["SNWD_ATTRIBUTES"].fillna(",,,").str.split(",", expand=True)
clean = d["SNWD"].where(fl[1] == "")                           # quality flag empty = passed
w = clean[clean.index.month.isin([11, 12, 1, 2, 3])]
season = (w.index + pd.DateOffset(months=3)).year
share = w.notna().groupby(season).mean()
ok = share[share >= 0.9].index
print(f"{(fl[1] != '').sum()} values failed QC; {len(ok)} of {share.size} winters have depth on 90%+ of days")
print(f"mean Nov-Mar depth in complete winters: {w[season.isin(ok)].mean():.0f} mm")
17 values failed QC; 71 of 130 winters have depth on 90%+ of days
mean Nov-Mar depth in complete winters: 29 mm
Flags on impossible values, non-random gaps, traces
1. Impossible values carry a flag
Sort the record by depth and the top is suspicious:
top = d.nlargest(5, "SNWD")[["SNOW", "SNWD", "SNWD_ATTRIBUTES"]]
print(top.to_string())
SNOW SNWD SNWD_ATTRIBUTES
DATE
1931-02-28 356.0 3556.0 ,G,6,
1947-04-16 203.0 1270.0 ,G,6,
1913-12-05 483.0 1067.0 ,G,6,
1941-10-30 76.0 762.0 ,,6,
1970-03-31 74.0 686.0 ,,0,
3,556 mm on 28 February 1931 — beside 356 mm of snowfall, so most likely a misplaced decimal point — carries quality flag G, a failed gross-limits check. So does 1,270 mm in April 1947 and 1,067 mm in December 1913. NCEI flags them but does not remove them; a max() or a mean over the raw column includes them.
2. List the quality flags
print(d.loc[fl[1] != "", ["SNOW", "SNWD", "SNWD_ATTRIBUTES"]].to_string()) SNOW SNWD SNWD_ATTRIBUTES
DATE
1913-12-05 483.0 1067.0 ,G,6,
1924-03-15 13.0 127.0 ,I,6,
1924-03-16 127.0 305.0 ,I,6,
1930-12-27 0.0 25.0 ,I,6,
1930-12-28 0.0 178.0 ,I,6,
1931-02-28 356.0 3556.0 ,G,6,
1931-03-02 0.0 51.0 ,I,6,
1931-03-03 0.0 102.0 ,I,6,
1947-04-16 203.0 1270.0 ,G,6,
1951-01-04 0.0 0.0 T,I,0,
1951-01-05 13.0 127.0 ,I,0,
1984-02-16 0.0 0.0 T,I,0,
1984-02-17 5.0 51.0 ,I,0,
1996-01-16 0.0 0.0 ,I,0,
1996-01-17 119.0 152.0 ,I,0,
2026-09-02 0.0 0.0 ,W,H,1700
2026-09-03 0.0 229.0 ,W,H,1700
G is a gross-limits failure, I an internal-consistency failure (depth inconsistent with snowfall or with the previous day), W a temperature check — snow depth on a day too warm for snow. All are dropped by keeping only values whose quality flag is empty.
3. Missing is not random
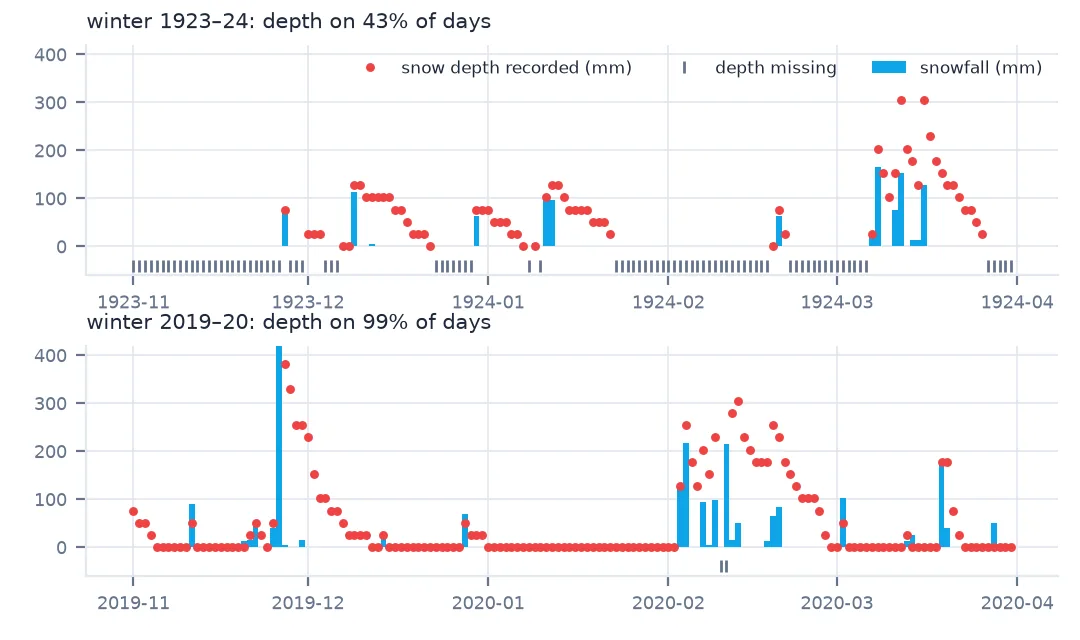
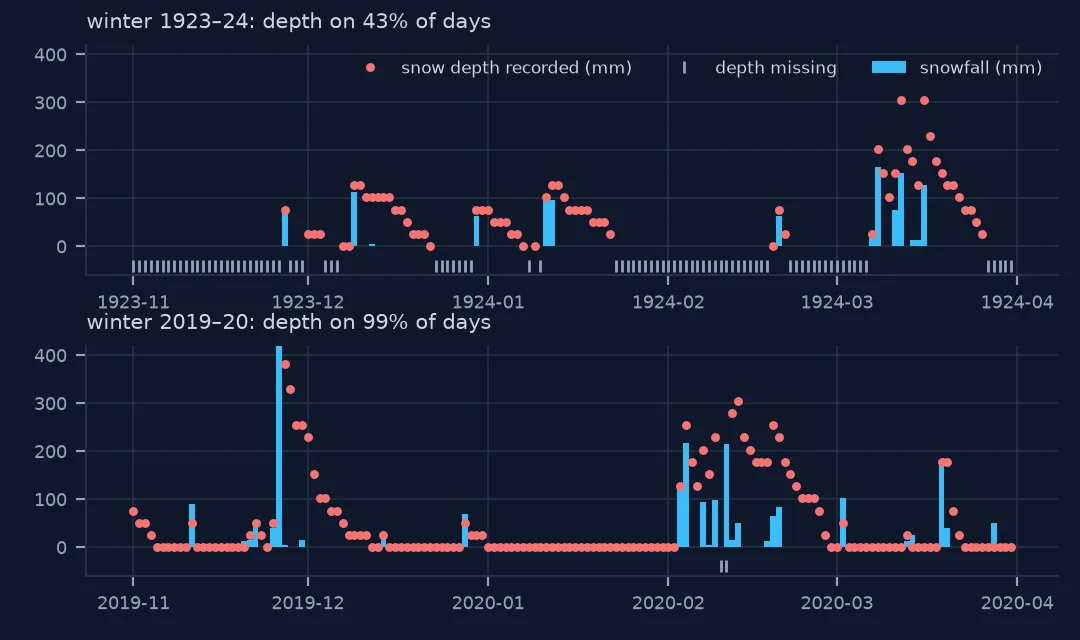
The early record is full of gaps. It would be convenient if they were random, so that dropping them left an unbiased sample. They are not:
early = d.loc["1898":"1940"]; early = early[early.index.month.isin([11, 12, 1, 2, 3])]
modern = d.loc["1960":"2025"]; modern = modern[modern.index.month.isin([11, 12, 1, 2, 3])]
rec = early.SNWD.notna()
print(f"1898-1940: depth recorded on {rec.mean():.0%} of winter days; {(early.SNWD[rec] > 0).mean():.0%} of those had snow on the ground")
print(f"1960-2025: depth recorded on {modern.SNWD.notna().mean():.0%} of winter days; {(modern.SNWD > 0).mean():.0%} had snow on the ground")
print(f"snowfall in the 3 days before: {(early.SNOW.rolling(3).sum()[rec] > 0).mean():.0%} of recorded days, "
      f"{(early.SNOW.rolling(3).sum()[~rec] > 0).mean():.0%} of missing days")
1898-1940: depth recorded on 24% of winter days; 73% of those had snow on the ground
1960-2025: depth recorded on 96% of winter days; 30% had snow on the ground
snowfall in the 3 days before: 53% of recorded days, 10% of missing days
Early observers wrote down the depth mostly when there was snow to measure, and left the column blank on bare days. Dropping the gaps keeps the snowy days and loses the bare ones; filling them with zeros assumes every unrecorded day was bare. Both are wrong:
x = early.SNWD
print(f"1898-1940 mean winter depth: gaps dropped {x.mean():.0f} mm, gaps as zero {x.fillna(0).mean():.0f} mm; "
      f"complete winters 1960-2025: {modern.SNWD.mean():.0f} mm")
1898-1940 mean winter depth: gaps dropped 70 mm, gaps as zero 17 mm; complete winters 1960-2025: 31 mm
4. Zero can mean trace
A measurement flag of T marks a trace — snow present but less than the smallest unit. GHCN stores it as 0:
print("SNWD values stored with a T flag:", d.SNWD[fl[0] == "T"].value_counts().to_dict())SNWD values stored with a T flag: {0.0: 2435}
For "days with snow on the ground" a trace is usually counted as no cover — it is below any useful threshold — but it is not the same as an observed bare day, and a count of "days with any snow" should include it.
5. Fix the end of the record
The per-station file grows every day, and its newest values are provisional. Boulder's file, downloaded for this page, ends with 229 mm of snow depth on a September day when the maximum temperature was 33 °C (GHCN stores temperature in tenths of a degree) — flagged W, failed the temperature check:
print(d.loc[(d.index >= "2026-09-01") & (fl[1] != ""), ["SNOW", "SNWD", "TMAX", "SNWD_ATTRIBUTES"]].to_string()) SNOW SNWD TMAX SNWD_ATTRIBUTES
DATE
2026-09-02 0.0 0.0 322.0 ,W,H,1700
2026-09-03 0.0 229.0 333.0 ,W,H,1700
Fix an end date — here the end of winter 2024–25 — so results reproduce and provisional values stay out.
Completeness by winter and a cleaning function
The data used on this page
NOAA NCEI Global Historical Climatology Network – Daily, station USC00050848 (Boulder, Colorado), per-station CSV. Flag definitions from the GHCN-Daily documentation.
from pathlib import Path

import numpy as np
import pandas as pd
import requests

Path("data").mkdir(exist_ok=True)
URL = "https://www.ncei.noaa.gov/data/global-historical-climatology-network-daily/access/USC00050848.csv"
if not Path("data/USC00050848.csv").exists():
    # The file grows daily: the length printed below is the 2026-10-01 copy.
    Path("data/USC00050848.csv").write_bytes(requests.get(URL, timeout=300).content)
d = pd.read_csv("data/USC00050848.csv", usecols=["DATE", "SNOW", "SNOW_ATTRIBUTES", "SNWD", "SNWD_ATTRIBUTES", "TMAX"],
                parse_dates=["DATE"], low_memory=False).set_index("DATE")
print(len(d), "days,", d.index.min().date(), "to", d.index.max().date())
47064 days, 1893-10-01 to 2026-09-27
Example 1: a winter-by-winter completeness table
The 1980s have a gap too — a reminder that completeness has to be checked winter by winter, not era by era:
print(share.loc[1976:1990].round(2).to_string())DATE
1976 1.00
1977 1.00
1978 1.00
1979 1.00
1980 0.02
1981 0.49
1982 0.25
1983 0.51
1984 0.99
1985 1.00
1986 1.00
1987 1.00
1988 1.00
1989 0.99
Example 2: a reusable cleaning function
def clean_snow_depth(df, end="2025-04-30", min_share=0.9, months=(11, 12, 1, 2, 3)):
    """GHCN-Daily SNWD in mm: QC-flagged values removed, cut at `end`, only winters with depth on
    at least `min_share` of days in `months`. Returns the daily series and the list of winters kept."""
    f = df["SNWD_ATTRIBUTES"].fillna(",,,").str.split(",", expand=True)
    s = df["SNWD"].where(f[1] == "").loc[:end]
    s = s[s.index.month.isin(months)]
    season = pd.Series((s.index + pd.DateOffset(months=3)).year, index=s.index)
    keep = s.notna().groupby(season).mean().loc[lambda x: x >= min_share].index
    return s[season.isin(keep)], list(keep)

series, winters = clean_snow_depth(d)
print(f"{len(winters)} winters, {series.notna().sum():,} daily values, max {series.max():.0f} mm on {series.idxmax().date()}")
70 winters, 10,462 daily values, max 686 mm on 1970-03-31
The deepest snow in the cleaned record is a plausible figure for a big Front Range storm, instead of a decimal error.
A station record is a history
A station snow record is a history of observing practice as much as of snow. Cooperative observers measured with a ruler once a day; for decades many recorded depth only when there was some, and the blank on other days was a convention, not a lost measurement. Digitisation preserved the blanks as missing values. Quality control added flags for values that cannot be right, without deleting them, so that users can see what was changed.
Each of the four problems needs a different response. Flagged values are removed. Traces are counted as zero depth but kept distinct when the question is about any snow at all. Gaps are neither dropped nor zero-filled; instead, the analysis is restricted to winters where the record is complete enough that the gaps cannot matter. And the record's end is fixed, because its newest values have not finished their checks.
The cost is data: at Boulder, 59 of 130 winters fail the completeness test, mostly before 1950. What remains is a record that can be compared from winter to winter without its observers' habits showing up as climate.
Empty flags, traces and observation times
- Quality flag empty means passed; G, I, W and others mean failed a check.
- T is a trace, stored as 0; P marks a value that may be missing-presumed-zero.
- Gaps are often snow-dependent in old records; check what fraction of recorded days had snow.
- Restrict to complete winters instead of dropping or filling gaps.
- Observation-time changes shift depth by a day of melt; the file records the time in the fourth attribute field.
- Fix the end date; recent values are provisional.
Internal links
- How to analyse snow depth from GHCN-Daily — the full analysis
- How to analyse SNOTEL snow water equivalent — automated stations, fewer gaps
- How to analyse a sea-ice extent time series — another record with seams
- Snow water equivalent explained — depth versus water
- How accurate is a historical map? — old records, honest uncertainty
FAQ
Why does my GHCN snow depth have impossible values?
Some values failed quality checks and are flagged but not removed. Keep only values whose quality flag (the second attribute field) is empty.
Should I fill missing snow depth with zero?
No — in old records depth was often recorded only when snow was present, so missing days were mostly bare but not all. Restrict analysis to winters with near-complete records instead.
What does a T flag mean in GHCN-Daily?
A trace: snow present but below the smallest measurable amount. The value is stored as 0.
Why was snow depth higher in the past in my analysis?
Probably because missing days were dropped. Early observers recorded depth mostly on snowy days, so the recorded days over-represent snow.