
Sea-Ice Extent Numbers Disagree
On this page
Problem statement
How low did Arctic sea ice get in September 2016? NSIDC's own Sea Ice Index gives 4.14, 4.17, 4.53 and 2.91 million km², depending on whether the question is the lowest single day, the lowest five-day mean, the September average, or ice area rather than extent. A news story calls a year "the second lowest on record" and a scientific summary calls it fifth, and a number computed from the grids matches neither. None of these is an error; they are different quantities that share a name, and each ranks the years differently.
This page reproduces the main sources of disagreement inside one dataset — the NSIDC Sea Ice Index, version 4 — and shows how each one changes the number and the ranking.
Quick answer
For any September, compare the four quantities NSIDC publishes or implies, and say which one you mean:
for y in (2012, 2016, 2019, 2020, 2025):
    print(f"{y}: monthly extent {monthly.loc[y, 'extent']:.2f}, monthly area {monthly.loc[y, 'area']:.2f}, "
          f"lowest daily {daily[str(y)].min():.2f}, lowest 5-day mean {five[str(y)].min():.2f} million km²")
2012: monthly extent 3.57, monthly area 2.41, lowest daily 3.34, lowest 5-day mean 3.39 million km²
2016: monthly extent 4.53, monthly area 2.91, lowest daily 4.14, lowest 5-day mean 4.17 million km²
2019: monthly extent 4.36, monthly area 3.17, lowest daily 4.17, lowest 5-day mean 4.19 million km²
2020: monthly extent 4.00, monthly area 2.83, lowest daily 3.79, lowest 5-day mean 3.82 million km²
2025: monthly extent 4.75, monthly area 3.08, lowest daily 4.54, lowest 5-day mean 4.60 million km²
Monthly or daily, one day or five, extent or area
1. Monthly or daily?
The monthly value is the average of the month's daily extents; the annual minimum is a single day. They differ by a few hundred thousand square kilometres:
for y in (2012, 2025):
    sep = daily[f"{y}-09"]
    print(f"{y}: monthly file {monthly.loc[y, 'extent']:.2f}, mean of daily {sep.mean():.2f}, "
          f"lowest day {sep.min():.2f} on {sep.idxmin():%d %B}")
2012: monthly file 3.57, mean of daily 3.57, lowest day 3.34 on 16 September
2025: monthly file 4.75, mean of daily 4.75, lowest day 4.54 on 08 September
The monthly file is exactly the mean of the daily values here, so the two NSIDC products agree with each other — they simply answer different questions.
2. One day or a five-day mean?
NSIDC quotes its daily minimum as a 5-day trailing mean, which smooths weather noise and shifts the date of the minimum by a few days:
for y in (2012, 2020, 2024):
    print(f"{y}: lowest day {daily[str(y)].min():.3f} on {daily[str(y)].idxmin():%d %b}; "
          f"lowest 5-day mean {five[str(y)].min():.3f} on {five[str(y)].idxmin():%d %b}")
2012: lowest day 3.340 on 16 Sep; lowest 5-day mean 3.387 on 17 Sep
2020: lowest day 3.793 on 13 Sep; lowest 5-day mean 3.818 on 16 Sep
2024: lowest day 4.245 on 10 Sep; lowest 5-day mean 4.252 on 14 Sep
3. Extent or area?
Extent counts every cell with at least 15% ice; area weights each by its concentration. September area is about two-thirds of extent, and the ratio changes from year to year, so the two rank years differently.
4. Rankings depend on the measure
Rank the Septembers of 2007–2025 by each measure:
r = pd.DataFrame({"monthly extent": monthly.loc[YEARS, "extent"], "monthly area": monthly.loc[YEARS, "area"],
                  "lowest daily": [daily[str(y)].min() for y in YEARS],
                  "lowest 5-day": [five[str(y)].min() for y in YEARS]}, index=YEARS).rank(method="min").astype(int)
print(r.loc[[2007, 2012, 2016, 2019, 2020]].to_string())
monthly extent monthly area lowest daily lowest 5-day
2007 3 2 4 3
2012 1 1 1 1
2016 7 5 3 4
2019 5 8 5 5
2020 2 3 2 2
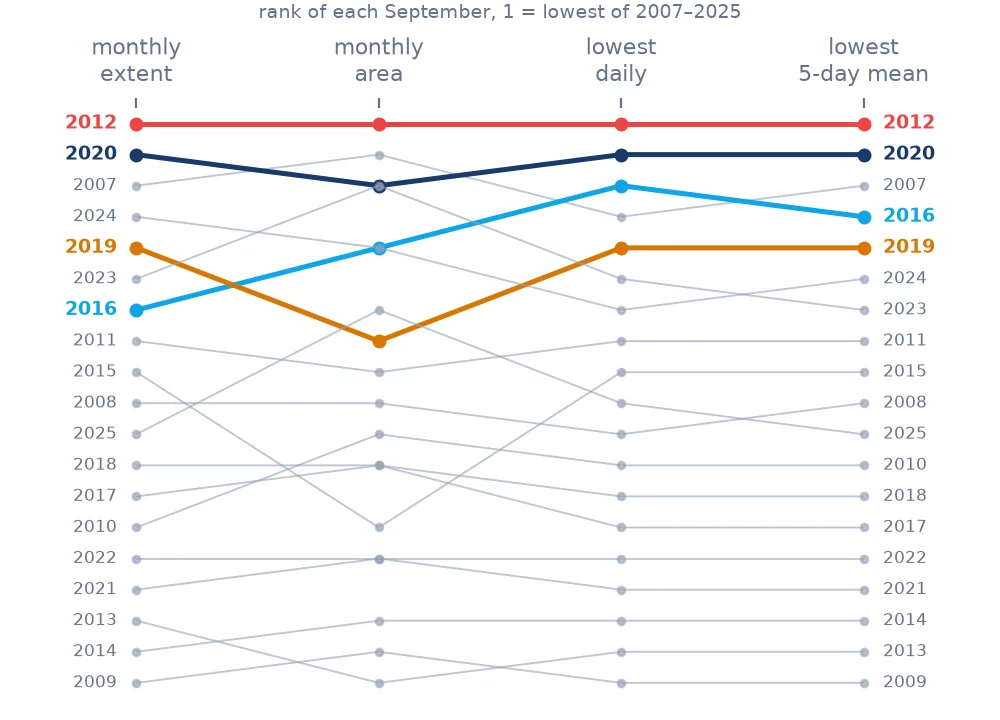
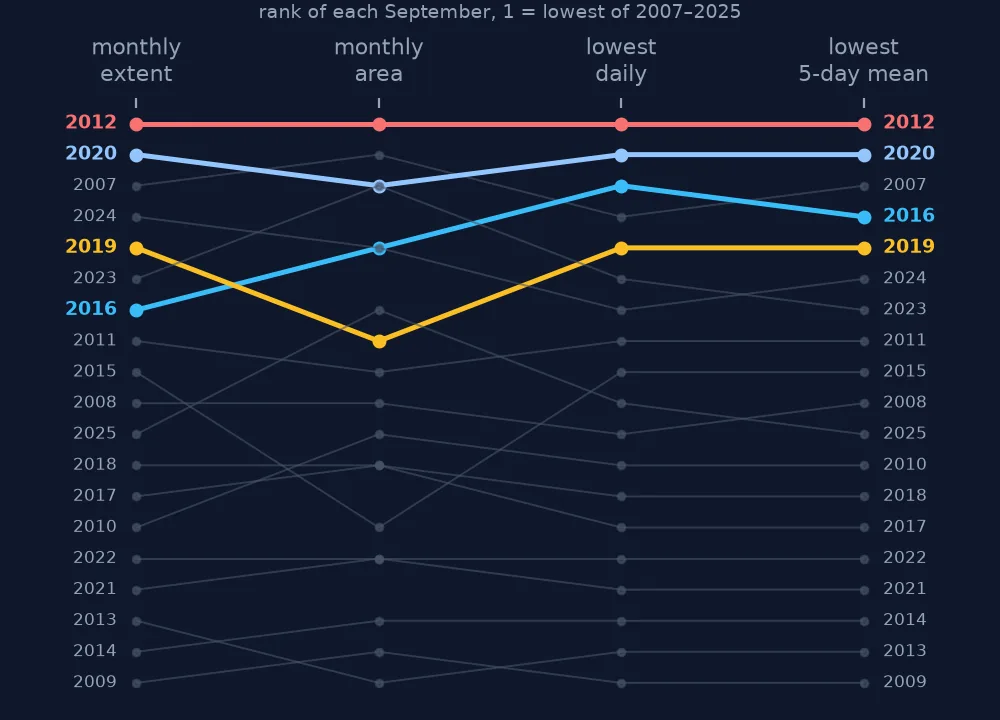
2012 is lowest by every measure and 2020 second by three of the four. Below that, rankings move: 2016 is seventh-lowest by monthly extent and third by daily minimum: its low was brief and the month's average stayed high. 2019 is fifth by extent and eighth by area: its ice was compact — area 73% of extent, against 64% in 2016 — so its area was relatively large. "The Nth lowest" without a measure is not a well-defined statement.
5. Your own number from the grids
Computed from the monthly concentration grids, extent depends on cell areas and the pole hole, and differs from the published table by a few per cent — see extent versus area for the reconstruction. Compare like with like: a grid-derived value with other grid-derived values, published table values with each other.
Two September 2016 numbers, compared
The data used on this page
NSIDC Sea Ice Index, version 4 (G02135): daily extent and the monthly September extent and area table, Northern Hemisphere, from NSIDC / NOAA, values to 31 December 2025.
from pathlib import Path

import numpy as np
import pandas as pd
import requests

Path("data").mkdir(exist_ok=True)
UA = {"User-Agent": "spatialworkflow.io guide (https://www.spatialworkflow.io)"}
BASE = "https://noaadata.apps.nsidc.org/NOAA/G02135/north"
for path, name in (("daily/data", "N_seaice_extent_daily_v4.0.csv"), ("monthly/data", "N_09_extent_v4.0.csv")):
    if not Path(f"data/{name}").exists():
        Path(f"data/{name}").write_bytes(requests.get(f"{BASE}/{path}/{name}", headers=UA, timeout=120).content)
d = pd.read_csv("data/N_seaice_extent_daily_v4.0.csv", skiprows=[1], skipinitialspace=True)
d.columns = d.columns.str.strip()
d["date"] = pd.to_datetime(dict(year=d.Year, month=d.Month, day=d.Day))
daily = d[(d.date >= "1979-01-01") & (d.date <= "2025-12-31")].set_index("date")["Extent"]
five = daily.asfreq("D").interpolate(limit=3).rolling(5).mean()
monthly = pd.read_csv("data/N_09_extent_v4.0.csv", skipinitialspace=True)
monthly.columns = monthly.columns.str.strip()
monthly = monthly.set_index("year").loc[:2025]  # the table gains a row each October
YEARS = list(range(2007, 2026))
print(len(daily), "daily values;", len(monthly), "Septembers")
15549 daily values; 47 Septembers
Example 1: how different can two "September 2016" numbers be?
vals = {"monthly extent": monthly.loc[2016, "extent"], "lowest 5-day": five["2016"].min(),
        "lowest daily": daily["2016"].min(), "monthly area": monthly.loc[2016, "area"]}
print({k: round(float(v), 2) for k, v in vals.items()}, f"- spread {max(vals.values()) - min(vals.values()):.2f} million km²")
{'monthly extent': 4.53, 'lowest 5-day': 4.17, 'lowest daily': 4.14, 'monthly area': 2.91} - spread 1.62 million km²
Example 2: a reproducible citation
A number is reproducible when it says what it is:
y = 2025
print(f"Arctic sea-ice extent, September {y} monthly mean: {monthly.loc[y, 'extent']:.2f} million km² "
      f"(NSIDC Sea Ice Index v4, G02135, monthly table); annual minimum (5-day trailing mean): "
      f"{five[str(y)].min():.2f} million km² on {five[str(y)].idxmin():%d %B %Y}; data to 31 December {y}.")
Arctic sea-ice extent, September 2025 monthly mean: 4.75 million km² (NSIDC Sea Ice Index v4, G02135, monthly table); annual minimum (5-day trailing mean): 4.60 million km² on 10 September 2025; data to 31 December 2025.
One phrase, several quantities
"Sea-ice extent in September" sounds like one quantity and is at least four: the monthly mean, the lowest single day, the lowest five-day mean, and — if "extent" is used loosely — area. Each is a legitimate summary of the same daily record, and they differ by more than many of the year-to-year changes people want to compare.
Rankings are where the difference matters most. Close years swap places when the measure changes, because a year can have a low but brief minimum, a long but moderate low season, or unusually compact or loose ice. 2016 and 2019 are the clearest cases here: one ranks third or seventh, the other fifth or eighth, depending on which reasonable number is used.
The fix is not to choose the "right" measure once and for all — they answer different questions — but to name the measure, the product version and the data end date every time a number is quoted, and to compare only like with like.
Means of daily values, versions and other products
- Monthly = mean of daily in Sea Ice Index v4.
- The minimum is a 5-day mean in NSIDC's own statements.
- Extent and area rank differently; never compare one with the other.
- Version matters: values change between Sea Ice Index versions.
- Other products (OSI SAF, JAXA) use different sensors and algorithms; expect small offsets.
- Recent values are provisional; cite the data end date.
Internal links
- How to analyse a sea-ice extent time series — the daily record
- Sea-ice extent versus area explained — the two quantities
- How to map sea-ice concentration — the grids behind them
- Polar stereographic projections explained — cell areas
- How accurate is a historical map? — naming what a number measures
FAQ
Why do sea-ice extent numbers for the same year differ?
They are different quantities: monthly mean, single-day minimum, 5-day mean minimum, or area rather than extent. For September 2016 these range from 2.91 to 4.53 million km².
Is NSIDC's monthly sea-ice extent the average of daily values?
In Sea Ice Index version 4, yes: the September monthly value matches the mean of the September daily values.
Which year had the second-lowest Arctic sea ice?
2020 by monthly extent and by both daily measures; by monthly area 2007 ranks second among 2007–2025. Below that the ranking depends on the measure.
How should I cite a sea-ice extent value?
Name the quantity (monthly mean, daily or 5-day minimum, extent or area), the product and version, and the data end date.