
Snow Cover and NDSI Explained: How Satellites Map Snow
On this page
Problem statement
Snow is the brightest natural surface in visible light, so finding it in a satellite image looks trivial — until you notice that clouds are bright too, that sunlit rock can be nearly as bright as shaded snow, and that snow under trees is hardly visible at all. Every operational snow map, from MODIS to Sentinel-2, solves the first problem with the same trick: the Normalised Difference Snow Index (NDSI), which compares visible and short-wave infrared reflectance. Knowing how it works, and where it fails, is the difference between using a snow map and being misled by one.
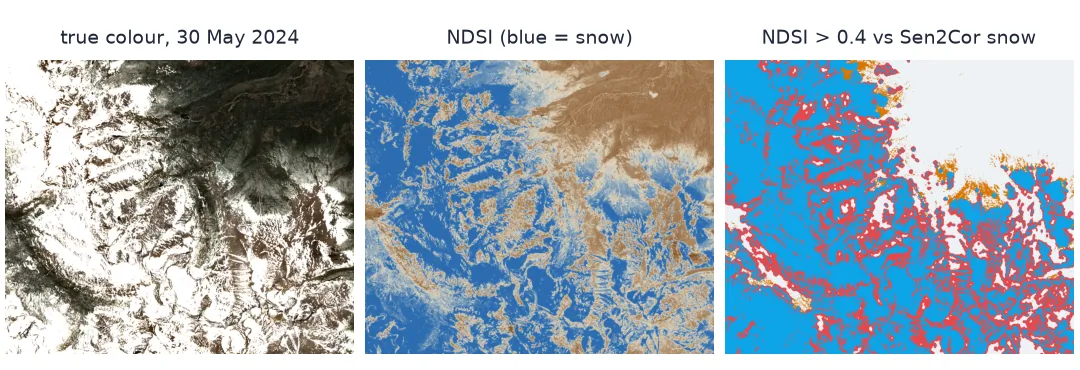
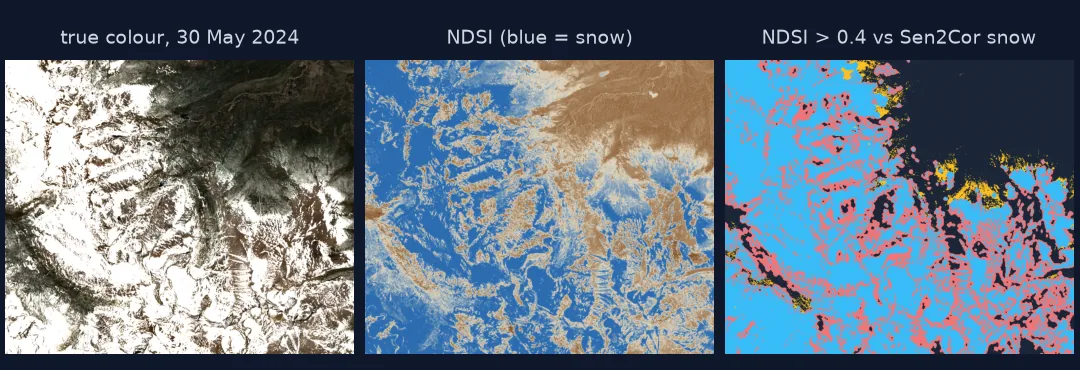
This page computes NDSI from a Sentinel-2 scene of Rocky Mountain National Park on 30 May 2024, compares it with the scene classification Sentinel-2's own processor produces, and measures how the answer depends on the threshold.
Quick answer
NDSI is the normalised difference of green and short-wave infrared reflectance. Snow is bright in green and dark in SWIR, so its NDSI is high; most other surfaces are the other way round:
green, swir = refl["B03"], refl["B11"]                    # Sentinel-2 L2A surface reflectance
ndsi = (green - swir) / (green + swir)
for k, name in ((11, "snow"), (6, "water"), (4, "vegetation"), (5, "bare ground")):
    m = scl == k
    print(f"{name:12} {m.sum():8,} pixels   median NDSI {np.median(ndsi[m]):+.2f}")
print(f"NDSI > 0.4: {(ndsi > 0.4).mean():.0%} of the window; Sen2Cor snow class: {(scl == 11).mean():.0%}")
snow 847,924 pixels median NDSI +0.66
water 1,328 pixels median NDSI +0.51
vegetation 109,768 pixels median NDSI -0.51
bare ground 243,052 pixels median NDSI -0.29
NDSI > 0.4: 49% of the window; Sen2Cor snow class: 70%
Green and shortwave infrared, correct reflectance, a chosen threshold
1. Why green and short-wave infrared
Snow reflects most visible light, and ice absorbs strongly in the short-wave infrared around 1.6 µm. Clouds made of water droplets reflect in both. So the difference between the two bands, scaled by their sum, separates snow from cloud, which a brightness threshold cannot:
for k, name in ((11, "snow"), (5, "bare ground"), (4, "vegetation")):
    m = scl == k
    print(f"{name:12} green {np.median(green[m]):.2f}   SWIR {np.median(swir[m]):.2f}")
snow green 0.49 SWIR 0.09
bare ground green 0.11 SWIR 0.18
vegetation green 0.05 SWIR 0.15
2. Read the surface reflectance correctly
Sentinel-2 L2A digital numbers are reflectance × 10,000 — and since processing baseline 04.00 (January 2022), with an offset of 1,000 added. Forgetting the offset shifts every reflectance by 0.1 and every NDSI with it:
print("processing baseline:", item.properties["s2:processing_baseline"])
raw_g, raw_s = dn["B03"] / 10000, dn["B11"] / 10000
wrong = (raw_g - raw_s) / (raw_g + raw_s)
print(f"median NDSI of bare ground without the offset: {np.median(wrong[scl == 5]):+.2f}, with it: {np.median(ndsi[scl == 5]):+.2f}")
processing baseline: 05.10
median NDSI of bare ground without the offset: -0.17, with it: -0.29
3. Choose a threshold, and know it is a choice
There is no natural break in NDSI between "snow" and "not snow"; patchy snow, wet snow and snow under sparse trees fill the space between. The snow-covered share of the same scene depends on where the line is drawn:
for t in (0.0, 0.1, 0.2, 0.3, 0.4, 0.5):
    print(f"NDSI > {t:.1f}: {(ndsi > t).mean():.0%} snow")
NDSI > 0.0: 66% snow
NDSI > 0.1: 62% snow
NDSI > 0.2: 58% snow
NDSI > 0.3: 54% snow
NDSI > 0.4: 49% snow
NDSI > 0.5: 44% snow
0.4 is the classic threshold for a pixel mostly covered by snow; MODIS's product uses 0.1 for "any snow". Between them lie 13% of this window — the patchy snow on ridges and the edges of the melting pack.
4. Compare with the scene classification
Sentinel-2's Sen2Cor processor delivers a scene classification layer (SCL) with its own snow class. It uses NDSI among other tests, at 20 m, and labels generously at the edges of snow patches:
both = (scl == 11) & (ndsi > 0.4)
only_scl = (scl == 11) & (ndsi <= 0.4)
only_ndsi = (scl != 11) & (ndsi > 0.4)
print(f"agree snow {both.mean():.0%}; Sen2Cor only {only_scl.mean():.0%}; NDSI only {only_ndsi.mean():.1%}")
print(f"median NDSI where only Sen2Cor says snow: {np.median(ndsi[only_scl]):+.2f}")
agree snow 47%; Sen2Cor only 23%; NDSI only 2.0%
median NDSI where only Sen2Cor says snow: -0.00
Most of the disagreement is pixels Sen2Cor calls snow but whose NDSI is low — the ragged edges of the snowpack on 30 May, where a 20 m pixel is part snow and part rock. Neither is wrong; they answer "is there snow here?" with different tolerances.
5. Watch for the surfaces that look like snow
Some non-snow surfaces have high NDSI. In this scene the Sen2Cor "water" class does:
w = scl == 6
print(f"water pixels: {w.sum():,}; with NDSI > 0.4: {(w & (ndsi > 0.4)).sum():,} ({(w & (ndsi > 0.4)).sum() / w.sum():.0%})")
water pixels: 1,328; with NDSI > 0.4: 744 (56%)
At 3,000 m at the end of May, many of the park's lakes are still frozen and snow-covered, so high NDSI there is correct. Open water can also have positive NDSI because it is dark in both bands; that is why snow algorithms also require minimum brightness in the visible or near infrared.
Snow under trees and the snow line
The data used on this page
Sentinel-2B Level-2A scene S2B_MSIL2A_20240530T174909_R141_T13TDE (30 May 2024, 1.1% cloud), Copernicus Sentinel data 2024, processed by ESA, via Microsoft Planetary Computer. The window is 12 × 10 km around Bear Lake and Longs Peak.
import numpy as np
import planetary_computer
import pystac_client
import rasterio
from rasterio.enums import Resampling
from rasterio.warp import transform_bounds
from rasterio.windows import from_bounds

catalog = pystac_client.Client.open("https://planetarycomputer.microsoft.com/api/stac/v1",
                                    modifier=planetary_computer.sign_inplace)
item = catalog.get_collection("sentinel-2-l2a").get_item("S2B_MSIL2A_20240530T174909_R141_T13TDE_20240530T231838")
BOX = (-105.72, 40.24, -105.58, 40.33)
dn = {}
for band in ("B02", "B03", "B04", "B08", "B11", "SCL"):
    with rasterio.open(item.assets[band].href) as src:
        w = from_bounds(*transform_bounds(4326, src.crs, *BOX), src.transform).round_offsets().round_lengths()
        scale = 2 if src.res[0] == 20 else 1                      # bring 20 m bands to the 10 m grid
        dn[band] = src.read(1, window=w, out_shape=(int(w.height * scale), int(w.width * scale)),
                            resampling=Resampling.nearest).astype(float)
rows = min(a.shape[0] for a in dn.values()); cols = min(a.shape[1] for a in dn.values())
dn = {k: v[:rows, :cols] for k, v in dn.items()}
refl = {k: (v - 1000) / 10000 for k, v in dn.items() if k != "SCL"}    # baseline >= 04.00: offset 1000
scl = dn["SCL"].astype(int)
print(rows, "x", cols, "pixels at 10 m")
1008 x 1197 pixels at 10 m
Example 1: snow under trees
NDSI looks at the top of the canopy. Where Sen2Cor sees vegetation, how much of it has an NDSI that hints at snow beneath?
ndvi = (refl["B08"] - refl["B04"]) / (refl["B08"] + refl["B04"])
veg = scl == 4
print(f"vegetation pixels with NDSI > 0.1: {(veg & (ndsi > 0.1)).sum() / veg.sum():.1%}")
print(f"median NDVI of Sen2Cor snow pixels whose NDSI is below 0.4: {np.median(ndvi[only_scl]):.2f}")
vegetation pixels with NDSI > 0.1: 1.2%
median NDVI of Sen2Cor snow pixels whose NDSI is below 0.4: 0.11
Very little of the forest shows snow from above, even in late May when snow lies under the trees at this elevation. That is the reason the MODIS melt-out dates at forested SNOTEL stations ran up to three weeks early.
Example 2: the snow line from NDSI
Combined with elevation, NDSI gives a snow line — the elevation above which most ground is snow-covered:
dem = np.zeros(scl.shape, np.float32)
with rasterio.open(item.assets["B03"].href) as ref:
    dst_t = ref.window_transform(from_bounds(*transform_bounds(4326, ref.crs, *BOX), ref.transform).round_offsets())
    dst_crs = ref.crs
with rasterio.open("https://copernicus-dem-30m.s3.amazonaws.com/Copernicus_DSM_COG_10_N40_00_W106_00_DEM/"
                   "Copernicus_DSM_COG_10_N40_00_W106_00_DEM.tif") as src:
    rasterio.warp.reproject(src.read(1), dem, src_transform=src.transform, src_crs=src.crs,
                            dst_transform=dst_t, dst_crs=dst_crs, resampling=Resampling.bilinear)
for lo in range(2600, 3800, 200):
    m = (dem >= lo) & (dem < lo + 200)
    print(f"{lo}-{lo + 200} m: {(ndsi[m] > 0.4).mean():.0%} snow")
2600-2800 m: 0% snow
2800-3000 m: 6% snow
3000-3200 m: 38% snow
3200-3400 m: 67% snow
3400-3600 m: 62% snow
3600-3800 m: 63% snow
On 30 May the snow line sat between 3,000 and 3,200 m. Above it the share levels off at about two-thirds, not all: the high ground of Longs Peak's flanks is steep rock and cliff that sheds snow even in a big year.
The physics behind NDSI
The NDSI works because of a physical property of ice: it absorbs strongly in the short-wave infrared while reflecting most visible light. Water droplets in clouds do not absorb nearly as much at 1.6 µm, so clouds stay bright in both bands and their NDSI stays low. Vegetation and soil reflect more SWIR than green, giving negative values. Snow sits alone at the top of the scale.
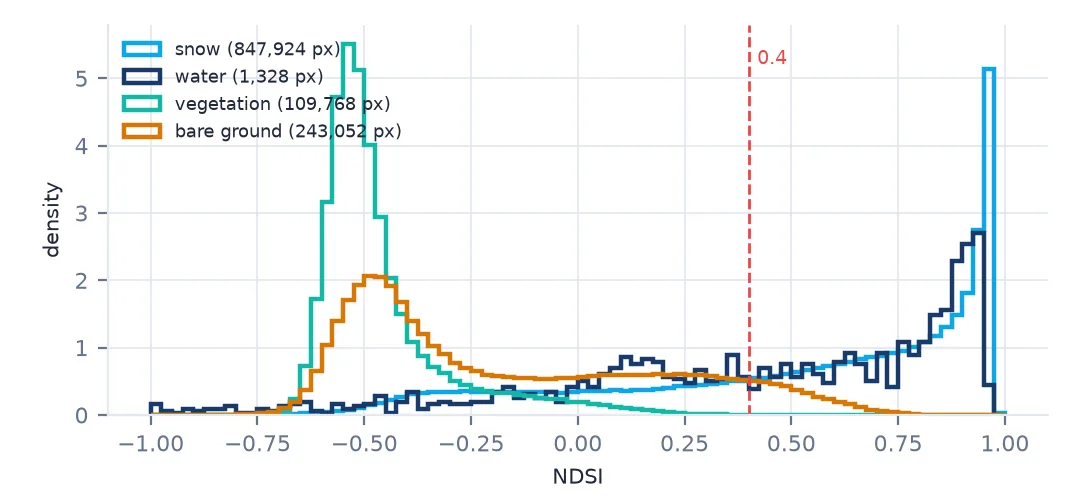
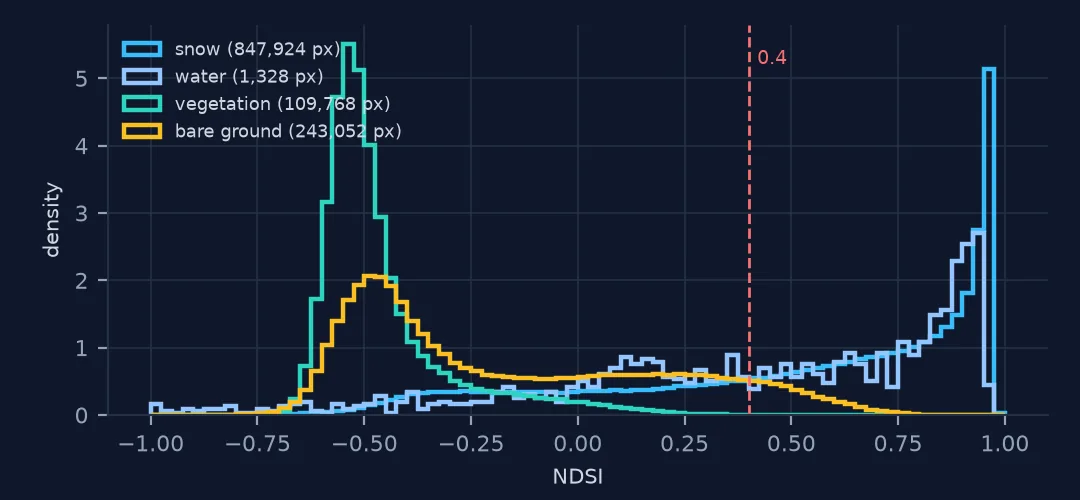
Everything else about a snow map is a decision layered on top: the threshold (0.4 for mostly snow, 0.1 for any snow), additional brightness tests to exclude dark water, cloud masks for the cirrus that NDSI cannot see, and the resolution at which the decision is made. Two products built from the same physics can disagree by a fifth of a scene, as NDSI > 0.4 and Sen2Cor did here, without either being wrong.
What no optical index can do is see through things. Under a closed forest canopy the satellite sees needles, not snow, and under cloud it sees cloud. Those two blind spots — not the index — are the main limits of snow mapping from space.
L2A offsets, frozen lakes and terrain shadow
- Apply the L2A offset for processing baseline 04.00 and later: reflectance = (DN − 1000) / 10000.
- The threshold is a definition, not a property of the data; state it.
- Frozen lakes are snow; open water can have positive NDSI too, so test brightness as well.
- Forest canopy hides snow; expect underestimates in forest.
- Terrain shadow lowers both bands; NDSI copes better than brightness, but deep shadow is still noisy.
- MODIS uses band 4 and band 6; the same index, different wavelengths and 500 m pixels.
Internal links
- How to make a MODIS snow cover time series — NDSI every day
- How to map snow cover from Sentinel-2 — a whole scene, step by step
- NDSI snow confused with cloud or water — the failure cases
- How to find the snow line elevation — NDSI with a DEM
- Snow water equivalent explained — what satellites cannot measure
FAQ
What is NDSI?
The Normalised Difference Snow Index, (green − SWIR) / (green + SWIR). Snow scores high because it is bright in visible light and dark in the short-wave infrared.
What NDSI threshold indicates snow?
0.4 is the traditional threshold for a mostly snow-covered pixel; MODIS Collection 6 uses 0.1 for any snow. On the scene here the two give snow-covered shares of 49% and 62%.
Which Sentinel-2 bands are used for NDSI?
Band 3 (green, 560 nm, 10 m) and band 11 (SWIR, 1610 nm, 20 m).
Why does NDSI miss snow in forests?
The satellite sees the top of the canopy. Unless snow is lying on the branches, a forest pixel's reflectance is mostly trees, and its NDSI is low.