
How to Extract a Sea Surface Temperature Time Series at a Point in Python
On this page
Problem statement
The most common request of a gridded sea surface temperature product is the simplest: the temperature over time at one place, a harbour, a fish farm, a dive site, a study station. With a 0.25° grid, the cell containing a coastal point is often land, and selecting the nearest cell centre returns a column of missing values. The fix is to find the nearest cell that has data, say how far away it is, and only then download the series.
This page takes three points on the coast of Ireland, finds which ones fall in land cells of NOAA OISST, picks the nearest ocean cell for each, downloads a year of daily temperatures for them, and compares the series.
Quick answer
Find the nearest cell with data from one day's field, then request the series for that cell:
for name, (lat, lon) in POINTS.items():
    near = day.sel(latitude=lat, longitude=lon, method="nearest")
    c = nearest_valid(day, lat, lon)
    print(f"{name:>13}: own cell {'land' if np.isnan(float(near)) else 'ocean'}; nearest ocean cell {c['lat']:.3f} N, {-c['lon']:.3f} W, {c['km']:.0f} km away")
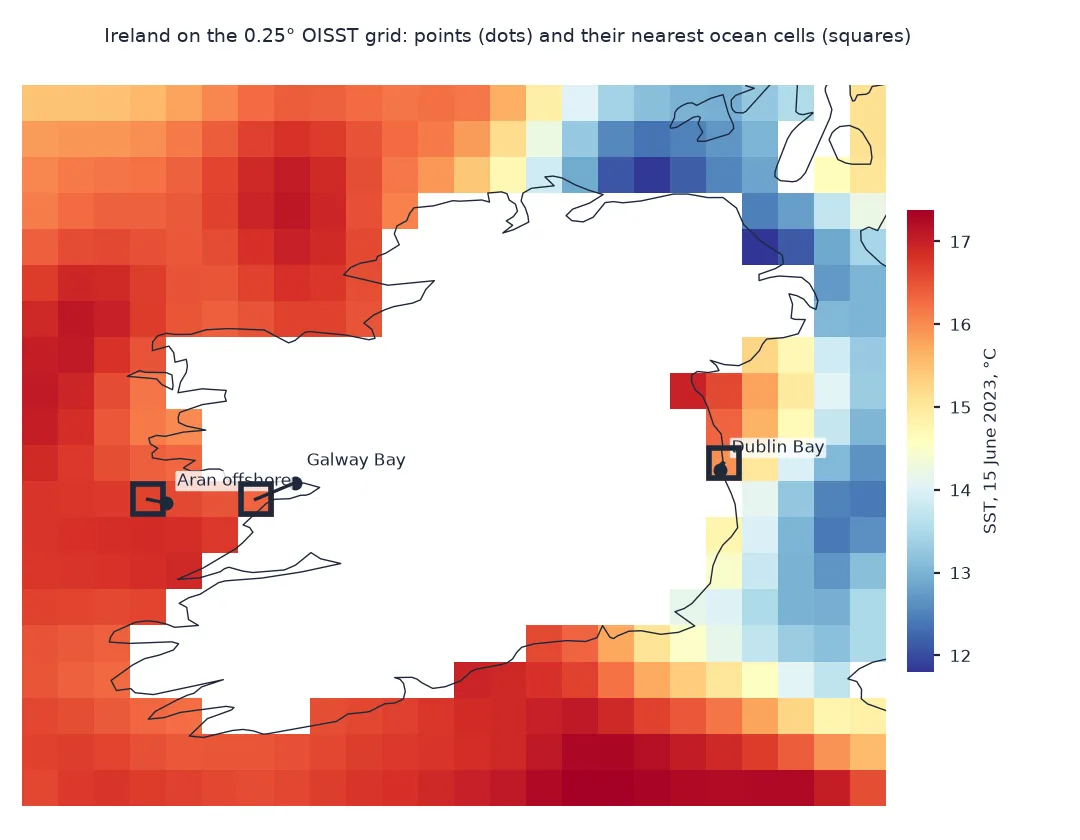
Galway Bay: own cell land; nearest ocean cell 53.125 N, 9.375 W, 22 km away
Aran offshore: own cell ocean; nearest ocean cell 53.125 N, 10.125 W, 9 km away
Dublin Bay: own cell ocean; nearest ocean cell 53.375 N, 6.125 W, 5 km away
Inner Galway Bay falls in a land cell; its nearest ocean cell is 22 km away at the mouth of the bay. The offshore point and Dublin Bay sit in ocean cells, 9 and 5 km from the cell centres.
The nearest cell can be land, download, compare neighbours
1. Why the nearest cell can be land
A 0.25° cell at 53°N is about 28 km north to south and 17 km east to west. Count how many cells of a coastal box are land:
print(f"box: {day.sizes['latitude']} x {day.sizes['longitude']} cells, land {int(day.isnull().sum())} ({float(day.isnull().mean()):.0%})")
print(f"cell size at 53 N: {0.25 * 111.32:.0f} km x {0.25 * 111.32 * np.cos(np.radians(53)):.0f} km")
box: 21 x 25 cells, land 190 (36%)
cell size at 53 N: 28 km x 17 km
Over a third of this coastal box, 190 of 525 cells, is land. At 53°N a cell is 28 km tall and 17 km wide.
2. Download the series for the chosen cells
Ask ERDDAP for a single cell over a year; a one-cell request is small even for a long period:
print(f"days: {S.notnull().sum().to_dict()}")
print(S.describe().loc[["mean", "min", "max"]].round(2).to_string())
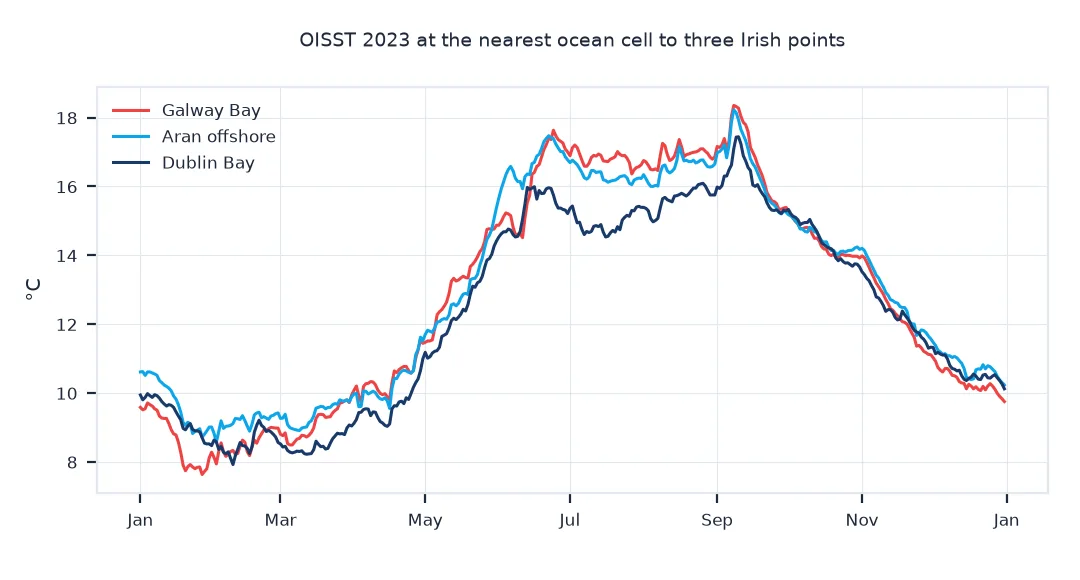
days: {'Galway Bay': 365, 'Aran offshore': 365, 'Dublin Bay': 365}
Galway Bay Aran offshore Dublin Bay
mean 12.83 12.99 12.34
min 7.63 8.57 7.92
max 18.35 18.22 17.44
Each cell has all 365 days. The two west-coast cells average about 12.9 °C over the year; the Dublin Bay cell, in the Irish Sea, 12.34 °C, with a cooler summer peak.
3. How different nearby series are
Compare the series pairwise: their seasonal ranges and the largest daily differences:
rng = S.max() - S.min()
print("seasonal range: " + ", ".join(f"{k} {v:.2f} °C" for k, v in rng.items()))
for a, b in (("Galway Bay", "Aran offshore"), ("Dublin Bay", "Galway Bay")):
    d = S[a] - S[b]
    print(f"{a} - {b}: mean {d.mean():+.2f} °C, largest {d.abs().max():.2f} °C on {d.abs().idxmax():%d %b}")
seasonal range: Galway Bay 10.72 °C, Aran offshore 9.65 °C, Dublin Bay 9.52 °C
Galway Bay - Aran offshore: mean -0.16 °C, largest 1.64 °C on 08 Jun
Dublin Bay - Galway Bay: mean -0.49 °C, largest 2.20 °C on 16 Jul
The cell at the mouth of Galway Bay has the largest seasonal range, 10.72 °C, against about 9.6 °C for the other two. It averages 0.16 °C cooler than the open water off the Aran Islands, but differs from it by up to 1.64 °C on single days. The Dublin Bay cell is 0.49 °C cooler than Galway Bay on average and up to 2.20 °C on 16 July.
The warmest week at each point
The data used on this page
Daily NOAA OISST v2.1 for 2023 from NOAA CoastWatch's ERDDAP, whose longitudes run from 0 to 360, with the 12 days of 2023 it lacks taken from NCEI's daily files. The three points are illustrative locations: inner Galway Bay, open water west of the Aran Islands, and Dublin Bay.
import io
import time
from pathlib import Path

import numpy as np
import pandas as pd
import requests
import xarray as xr
from pyproj import Geod

Path("data").mkdir(exist_ok=True)
CW = "https://coastwatch.pfeg.noaa.gov/erddap/griddap"
ARCHIVE = "https://www.ncei.noaa.gov/data/sea-surface-temperature-optimum-interpolation/v2.1/access/avhrr"
def _get(url):
    for attempt in range(5):                                            # a busy ERDDAP answers 500 or 503
        r = requests.get(url, timeout=900)
        if r.status_code < 500:
            break
        time.sleep(30 * (attempt + 1))
    r.raise_for_status()
    return r
def _lon180(da):
    return da.assign_coords(longitude=(da.longitude + 180) % 360 - 180).sortby("longitude")
def oisst(start, end, path, var="sst", lat=(52, 54), lon=(-12, -10), step=1):
    """Daily OISST v2.1 for a box and dates, saved to path, longitudes -180 to 180. CoastWatch's ERDDAP
    aggregation (version 2 before 2016, the same analysis as v2.1 for those years), with every day it
    lacks taken from NCEI's daily archive: the aggregations skip days, and a skipped day is silent."""
    path = Path(path)
    if not path.exists():
        days = pd.date_range(start, end)
        ds = "ncdcOisst2Agg" if days[-1].year <= 2015 else "ncdcOisst21Agg"
        a, b = lon[0] % 360, lon[1] % 360
        got = []
        for lo in [(a, b)] if a <= b else [(a, 359.875), (0.125, b)]:          # across 0°, two requests
            q = (f"{var}[({start}T12:00:00Z):1:({end}T12:00:00Z)][(0.0)]"
                 f"[({lat[0]}):{step}:({lat[1]})][({lo[0]}):{step}:({lo[1]})]")
            got.append(xr.open_dataset(io.BytesIO(_get(f"{CW}/{ds}.nc?{q}").content))[var].load())
        da = _lon180(xr.concat(got, "longitude").squeeze("zlev", drop=True))
        da = da.sel(time=slice(start, f"{end}T23:59"))                       # a missing end day snaps past it
        for day in days.difference(pd.DatetimeIndex(da.time.values).normalize()):
            url = f"{ARCHIVE}/{day:%Y%m}/oisst-avhrr-v02r01.{day:%Y%m%d}.nc"
            d = xr.open_dataset(io.BytesIO(_get(url).content))[var].squeeze("zlev", drop=True)
            d = _lon180(d.rename(lat="latitude", lon="longitude"))
            d = d.sel(latitude=da.latitude, longitude=da.longitude, method="nearest")
            da = xr.concat([da, d.assign_coords(latitude=da.latitude, longitude=da.longitude).load()], "time")
        da.sortby("time").to_dataset(name=var).to_netcdf(path)
    return xr.open_dataset(path)[var]
POINTS = {"Galway Bay": (53.24, -9.10), "Aran offshore": (53.10, -10.00), "Dublin Bay": (53.33, -6.15)}
geod = Geod(ellps="WGS84")
p = Path("data/oisst_ireland_20230615.nc")
day = oisst("2023-06-15", "2023-06-15", p, "sst", (51, 56), (-11, -5)).squeeze(drop=True)
def nearest_valid(da, lat, lon):
    la, lo = np.meshgrid(da.latitude.values, da.longitude.values, indexing="ij")
    ok = np.isfinite(da.values)
    d = geod.inv(np.full(ok.sum(), lon), np.full(ok.sum(), lat), lo[ok], la[ok])[2]
    i = np.argmin(d)
    return {"lat": float(la[ok][i]), "lon": float(lo[ok][i]), "km": d[i] / 1000}
series = {}
for name, (lat, lon) in POINTS.items():
    c = nearest_valid(day, lat, lon)
    q = Path(f"data/oisst_point_{c['lat']:.3f}_{c['lon']:.3f}_2023.nc")
    s = oisst("2023-01-01", "2023-12-31", q, "sst", (c["lat"],) * 2, (c["lon"],) * 2).squeeze().to_series()
    s.index = s.index.normalize()
    series[name] = s
S = pd.DataFrame(series)
print(f"box {day.sizes['latitude']} x {day.sizes['longitude']} cells on 15 June 2023; {len(S)} days for {S.shape[1]} points")
box 21 x 25 cells on 15 June 2023; 365 days for 3 points
The setup reads a 21 by 25 cell box for one day to find the ocean cells, then 365 days for each of the three chosen cells.
Example 1: the warmest week at each point
Find each point's warmest seven-day spell in 2023:
wk = S.rolling(7, center=True).mean()
for name in S:
    print(f"{name:>13}: warmest week centred on {wk[name].idxmax():%d %b}, {wk[name].max():.2f} °C")
Galway Bay: warmest week centred on 10 Sep, 18.09 °C
Aran offshore: warmest week centred on 10 Sep, 17.80 °C
Dublin Bay: warmest week centred on 10 Sep, 17.06 °C
All three cells had their warmest week in 2023 centred on 10 September, from 17.06 °C in the Irish Sea to 18.09 °C at the mouth of Galway Bay.
A grid's coastline is a staircase
A gridded product averages the ocean over each cell, and assigns a cell to land when too much of it is land, so the coastline of the grid is a staircase several kilometres from the real one. Bays, estuaries and fjords narrower than a cell are often entirely land on the grid. Selecting by nearest centre is right for points in open water; for coastal points the nearest valid cell is a better choice, and its distance belongs in any result, because water 20 km offshore is not the water in the harbour.
Even nearby cells can differ in ways that matter. Inner bays warm more in summer and cool more in winter than the open shelf, and the Irish Sea and the Atlantic coast have different seasonal cycles. A gridded product resolves the shelf-scale differences but not the harbour-scale ones; for those, a local sensor or a high-resolution product such as NASA's MUR at 0.01° is the right source.
Longitude conventions and many points
- Longitude convention: the ERDDAP dataset uses 0–360; 9.10°W is 350.90°E. See the longitude fix.
- Masks change rarely: OISST's land mask is fixed, but cells near the sea-ice edge can be missing in winter; pick the nearest valid cell from a day in the season of interest.
- Many points: requesting a small box once and selecting cells locally is faster than one request per point.
- Distance: report it; a nearest valid cell 30 km away is a different sea area for many purposes.
Internal links
- How to download NOAA OISST sea surface temperature in Python — box requests
- How to compare buoy water temperature with satellite SST in Python — a point measurement against the grid
- How to detect marine heatwaves in Python — what to do with a series
FAQ
How do I get an SST time series for one location in Python?
Find the nearest grid cell with data, then request that one cell for the period from an ERDDAP server and open it with xarray.
Why is my SST time series all NaN?
The point's nearest cell is land on the 0.25° grid; choose the nearest cell with data instead.
How far is the nearest ocean cell?
It depends on the coast; for the points on this page, the quick answer prints the distance for each.
Which SST product is best near the coast?
A high-resolution analysis such as MUR at 0.01°, or local measurements; 0.25° products cannot resolve small bays.