
How to Aggregate Tract Health Estimates to Neighbourhoods in Python
On this page
Problem statement
Health estimates come for census tracts, and the questions come for something else: a city, a ward, a neighbourhood, a hospital's service area. Combining tract prevalences into one figure for a larger area is a weighted average, and the weights decide whether the answer is right. A plain mean of tract percentages counts a tract of 800 adults the same as one of 8,000; a population-weighted mean does not. CDC PLACES publishes estimates for cities as well as tracts, which gives a rare check: aggregate the tracts and see whether you get the city's own figure.
This page aggregates PLACES 2025 tract estimates for five measures to the city of Chicago, checks the result against the PLACES city estimate, and then aggregates to Chicago's 77 community areas, which PLACES does not publish.
Quick answer
Weight each tract's prevalence by its adult population, the population the estimate describes:
in_city = TRACTS[TRACTS.share_in_city >= 0.5].GEOID
t = PLACES[PLACES.locationname.isin(in_city)]
agg = t.groupby("measureid").apply(lambda g: np.average(g.data_value, weights=g.totalpop18plus), include_groups=False)
check = pd.DataFrame({"from tracts": agg.round(2), "PLACES city": CITY.data_value})
check["difference"] = (check["from tracts"] - check["PLACES city"]).round(2)
print(f"{len(in_city)} tracts, {t.drop_duplicates('locationname').totalpop18plus.sum():,.0f} adults (PLACES city: {CITY.totalpop18plus.iloc[0]:,.0f})")
print(check.to_string())
793 tracts, 2,202,845 adults (PLACES city: 2,201,215)
from tracts PLACES city difference
measureid
BINGE 19.01 19.0 0.01
CSMOKING 11.85 11.9 -0.05
DEPRESSION 19.14 19.1 0.04
DIABETES 11.96 12.0 -0.04
OBESITY 32.58 32.6 -0.02
Which tracts belong, the right weights, uncovered areas
1. Decide which tracts belong to the area
Tract and city boundaries do not always line up. Measure how much of each tract lies inside, and decide on a rule:
share = TRACTS.share_in_city
print(f"tracts touching Chicago: {len(TRACTS)}; more than half inside: {(share >= 0.5).sum()}; "
      f"wholly inside (99%+): {(share >= 0.99).sum()}; slivers under 1%: {(share < 0.01).sum()}")
tracts touching Chicago: 873; more than half inside: 793; wholly inside (99%+): 791; slivers under 1%: 72
The 72 slivers are neighbouring tracts whose edges meet the city line; the tracts more than half inside are the city.
2. Use the right weights
The same tracts give three different answers depending on the weights:
d = t[t.measureid == "DIABETES"]
for label, w in (("unweighted mean", None), ("weighted by total population", d.totalpopulation), ("weighted by adults", d.totalpop18plus)):
    print(f"{label:>28}: {np.average(d.data_value, weights=w):.2f}%")
print(f"{'PLACES city estimate':>28}: {CITY.loc['DIABETES', 'data_value']:.2f}%")
print("mean diabetes by quarter of adult population, smallest first:",
      d.groupby(pd.qcut(d.totalpop18plus, 4, labels=False)).data_value.mean().round(2).tolist())
unweighted mean: 12.75%
weighted by total population: 12.24%
weighted by adults: 11.96%
PLACES city estimate: 12.00%
mean diabetes by quarter of adult population, smallest first: [14.74, 13.0, 12.04, 11.21]
The unweighted mean is too high because small tracts in Chicago tend to have higher diabetes estimates. PLACES measures describe adults, so the adult population is the right weight.
3. Aggregate to areas the data do not cover
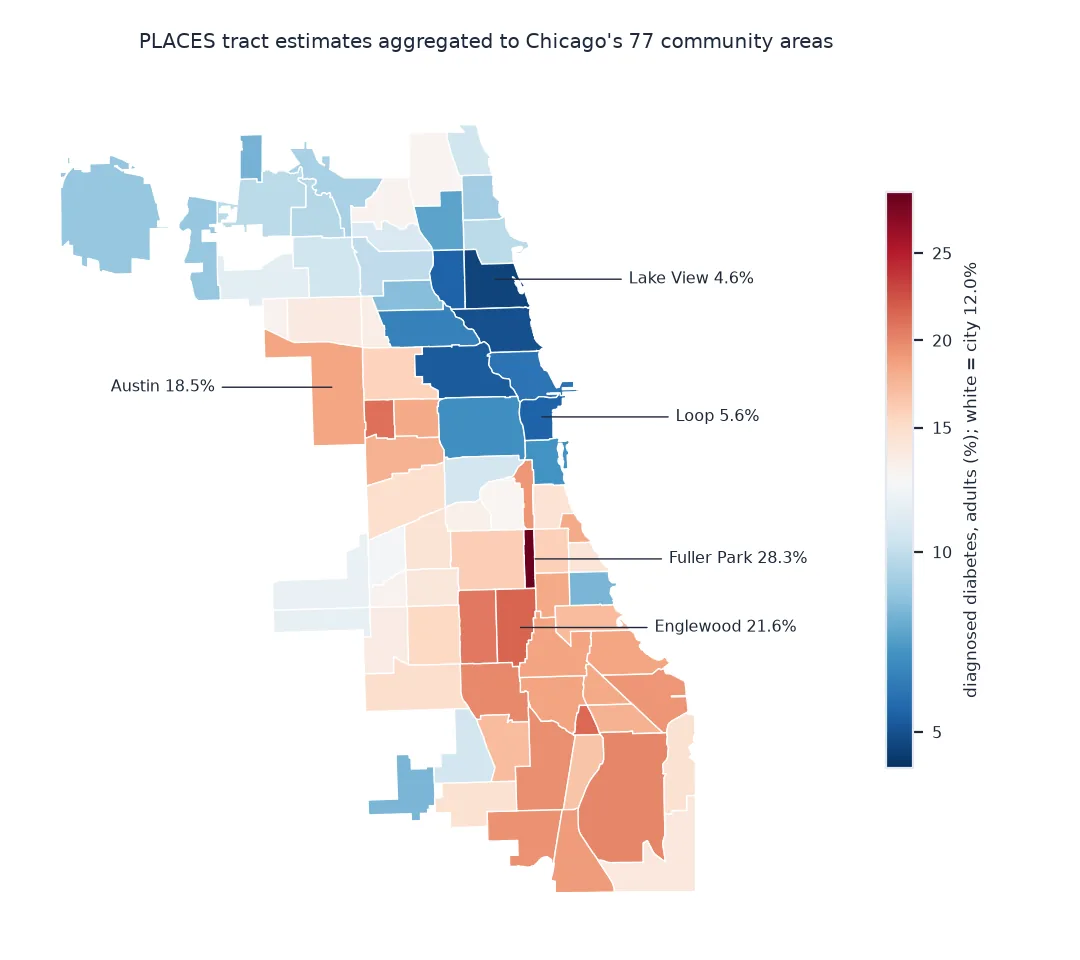
For community areas, split each tract's adults between the areas it overlaps, in proportion to area, then take the weighted mean in each:
pieces = gpd.overlay(TRACTS[["GEOID", "geometry"]].assign(tract_area=TRACTS.area), CA[["community", "geometry"]], how="intersection")
pieces["frac"] = pieces.area / pieces.tract_area
pieces = pieces.merge(d[["locationname", "data_value", "totalpop18plus"]], left_on="GEOID", right_on="locationname")
pieces["adults"] = pieces.totalpop18plus * pieces.frac
ca = pieces.groupby("community").apply(lambda g: pd.Series({"diabetes": np.average(g.data_value, weights=g.adults), "adults": g.adults.sum()}),
                                       include_groups=False)
second = pieces.sort_values("frac", ascending=False).groupby("GEOID").frac.apply(lambda f: f.iloc[1] if len(f) > 1 else 0)
print(f"{len(ca)} community areas; tracts with over 5% of their area in a second area: {(second > 0.05).sum()}, "
      f"with only a sliver: {((second > 0) & (second <= 0.05)).sum()}; adults allocated {ca.adults.sum():,.0f}")
print(f"diabetes: {ca.diabetes.min():.1f}% ({ca.diabetes.idxmin().title()}) to {ca.diabetes.max():.1f}% ({ca.diabetes.idxmax().title()})")
77 community areas; tracts with over 5% of their area in a second area: 3, with only a sliver: 534; adults allocated 2,193,913
diabetes: 4.6% (Lake View) to 28.3% (Fuller Park)
Only three tracts have more than 5% of their area in a second community area. The rest of the overlaps are slivers where two boundary files, drawn separately, disagree by a few metres; community areas and tracts nest almost exactly, so the allocation barely matters here.
Community areas that differ most from the city
The data used on this page
CDC PLACES 2025 release: tract estimates (cwsq-ngmh) for Cook and DuPage counties and place estimates (eav7-hnsx) for Chicago, crude prevalence; Census 2023 cartographic boundary files for Illinois tracts and places; and Chicago's community area boundaries from the City of Chicago data portal.
from pathlib import Path

import geopandas as gpd
import numpy as np
import pandas as pd
import requests

Path("data").mkdir(exist_ok=True)
SRC = {"cb_2023_17_tract_500k.zip": "https://www2.census.gov/geo/tiger/GENZ2023/shp/cb_2023_17_tract_500k.zip",
       "cb_2023_17_place_500k.zip": "https://www2.census.gov/geo/tiger/GENZ2023/shp/cb_2023_17_place_500k.zip",
       "chicago_community_areas.geojson": "https://data.cityofchicago.org/resource/igwz-8jzy.geojson?$limit=100"}
for name, url in SRC.items():
    if not Path("data", name).exists():
        Path("data", name).write_bytes(requests.get(url, timeout=300).content)

MEASURES = "('DIABETES', 'OBESITY', 'CSMOKING', 'DEPRESSION', 'BINGE')"
PLACES = pd.DataFrame(requests.get("https://data.cdc.gov/resource/cwsq-ngmh.json", timeout=120, params={
    "$where": f"countyfips in ('17031', '17043') AND measureid in {MEASURES}",
    "$select": "locationname, measureid, data_value, totalpopulation, totalpop18plus", "$limit": 20000}).json())
PLACES[["data_value", "totalpopulation", "totalpop18plus"]] = PLACES[["data_value", "totalpopulation", "totalpop18plus"]].astype(float)
CITY = pd.DataFrame(requests.get("https://data.cdc.gov/resource/eav7-hnsx.json", timeout=120, params={
    "$where": f"locationid = '1714000' AND datavaluetypeid = 'CrdPrv' AND measureid in {MEASURES}",
    "$select": "measureid, data_value, totalpop18plus"}).json()).astype({"data_value": float, "totalpop18plus": float}).set_index("measureid")

chicago = gpd.read_file("data/cb_2023_17_place_500k.zip").query("GEOID == '1714000'").to_crs(3435).geometry.iloc[0]
TRACTS = gpd.read_file("data/cb_2023_17_tract_500k.zip").to_crs(3435)
TRACTS = TRACTS[TRACTS.intersects(chicago)].copy()
TRACTS["share_in_city"] = TRACTS.intersection(chicago).area / TRACTS.area
CA = gpd.read_file("data/chicago_community_areas.geojson").to_crs(3435)
print(f"{PLACES.locationname.nunique()} tracts with estimates in Cook and DuPage; {len(CA)} community areas")
1547 tracts with estimates in Cook and DuPage; 77 community areas
Example 1: which community areas differ most from the city
city = CITY.loc["DIABETES", "data_value"]
ranked = ca.assign(vs_city=ca.diabetes - city).sort_values("vs_city")
print(pd.concat([ranked.head(3), ranked.tail(3)]).round(1).to_string())
diabetes adults vs_city
community
LAKE VIEW 4.6 88205.1 -7.4
LINCOLN PARK 5.0 59688.9 -7.0
WEST TOWN 5.3 76119.7 -6.7
BURNSIDE 21.5 2002.5 9.5
ENGLEWOOD 21.6 17990.9 9.6
FULLER PARK 28.3 2005.7 16.3
Prevalence times adults is a count
A prevalence for a group of tracts is the number of adults with the condition divided by the number of adults, and the tract prevalence times its adult population is that tract's estimated count. Summing counts and dividing by summed adults is exactly the adult-weighted mean. The check against PLACES works because PLACES produces its city estimates the same way, from the same small-area model applied to the city's population, so the two agree to a few hundredths of a point.
Splitting tracts by area assumes adults are spread evenly over each tract, which is close enough where community areas follow tract lines and rough where a split tract is half park. Census blocks, which nest in tracts and have 2020 populations, give a better split if it matters. The uncertainty of an aggregate cannot be computed from the tract intervals, because the tract estimates come from one model and their errors are correlated; quote aggregates as estimates without an interval, or use the place-level intervals where PLACES publishes them.
Age adjustment, missing tracts and denominators
- Crude or age-adjusted: tract estimates are crude prevalence; compare them with crude place or county estimates.
- Counties: Chicago includes a sliver of DuPage County at O'Hare, so query both counties.
- Missing tracts: tracts with no estimate drop out of the weights; check that the adults add up.
- Vintage: the 2025 release uses 2020 tracts; community area boundaries and tract boundaries come from different sources and differ slightly at edges.
- Not for measures with other denominators: a few PLACES measures apply to subgroups, such as women of a given age; weight those by that subgroup if you have it.
Internal links
- How to map CDC PLACES health estimates by census tract — the tract data
- Why does my health map look like a poverty map? — what the estimates contain
FAQ
How do I combine census tract prevalence estimates into a city figure?
Multiply each tract's prevalence by its adult population, sum, and divide by the total adults: the adult-weighted mean.
Why not just average the tract percentages?
An unweighted mean treats every tract equally regardless of population, and in Chicago it overstates diabetes by about 0.8 points.
Does PLACES publish estimates for neighbourhoods?
No; it publishes tracts, ZCTAs, places and counties. Neighbourhood figures have to be aggregated from tracts.
Can I compute a confidence interval for an aggregated PLACES estimate?
Not from the tract intervals alone, because tract errors are correlated; report the aggregate without one, or use a published level.