
Why Do My Health Estimates Not Join to Current Census Tracts?
On this page
Problem statement
You have tract-level health data, such as life expectancy from USALEEP or an older PLACES release, and you join it to the current tract boundaries by GEOID. Most tracts match, a hundred or more come out blank, and nothing warns you that some of the matches are not the same piece of ground. The cause is the tract vintage. Census tracts are redrawn every ten years: growing tracts are split and given new numbers, others are merged or nudged, and the 11-digit ID of a 2010 tract does not always point at the same place in 2020.
This page joins USALEEP life expectancy, built on 2010 tracts, to Cook County's 2020 tracts in two ways, by ID and through the Census Bureau's tract relationship file, and counts what the ID join loses.
Quick answer
Carry the values across with the 2020-to-2010 relationship file, weighting each 2010 tract by its share of the 2020 tract's land, and keep only 2020 tracts mostly covered by estimates:
parts = REL.merge(LE[["GEOID", "e(0)"]], left_on="GEOID_TRACT_10", right_on="GEOID").dropna(subset=["e(0)"])
cw = parts.groupby("GEOID_TRACT_20").apply(
    lambda d: pd.Series({"e0": np.average(d["e(0)"], weights=d.w), "covered": d.w.sum()}), include_groups=False)
cw = cw[cw.covered >= 0.5]
print(f"{len(T20)} tracts in 2020; with a value joined by ID: {T20.GEOID.isin(LE.GEOID).sum()}; "
      f"through the relationship file: {T20.GEOID.isin(cw.index).sum()}")
1331 tracts in 2020; with a value joined by ID: 1175; through the relationship file: 1215
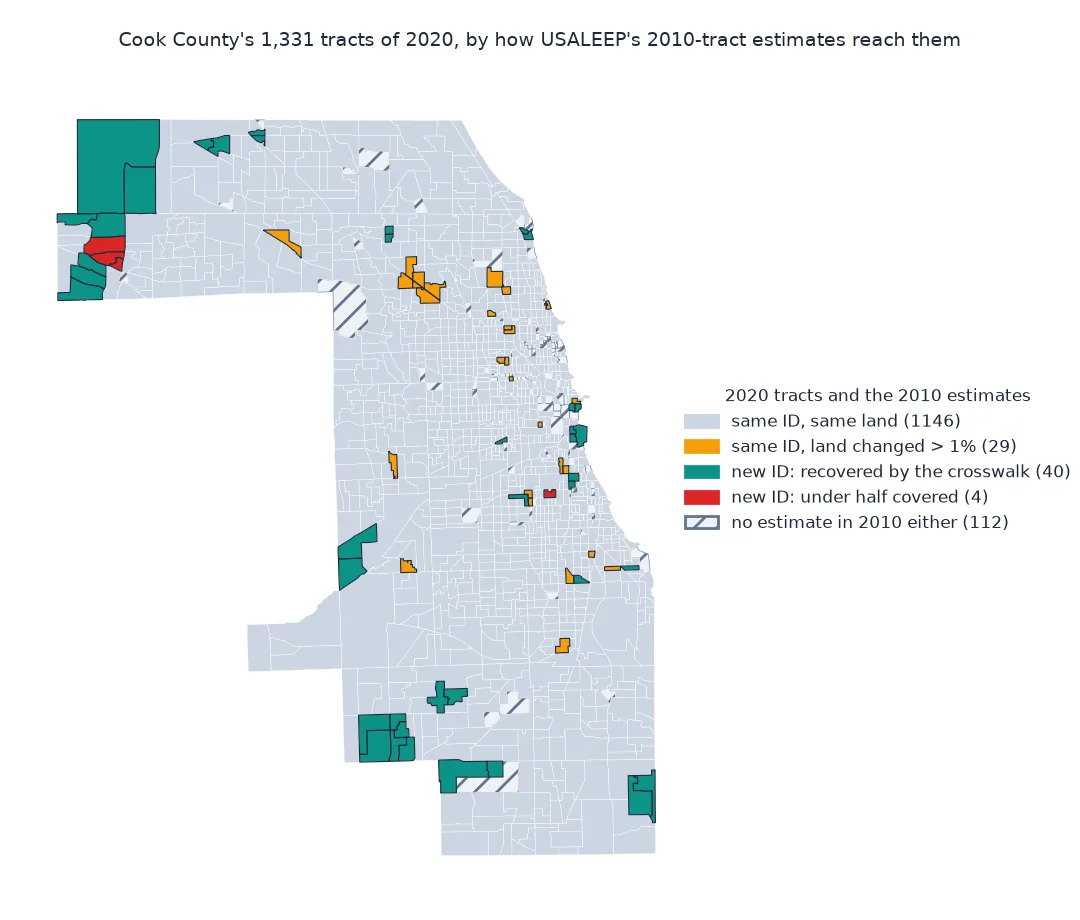
Count changed ids, check matching ids, ignore slivers
1. Count the IDs that changed
A 2020 tract whose ID did not exist in 2010 cannot match anything by ID:
ids10 = set(REL.GEOID_TRACT_10)
new = ~T20.GEOID.isin(ids10)
print(f"2020 tract IDs that did not exist in 2010: {new.sum()}; 2010 IDs gone by 2020: {len(ids10 - set(T20.GEOID))}")
2020 tract IDs that did not exist in 2010: 44; 2010 IDs gone by 2020: 42
2. Check that a matching ID is the same place
Most tracts kept both their ID and their shape. Some kept the ID while land moved in or out:
same = REL[REL.GEOID_TRACT_20 == REL.GEOID_TRACT_10].copy()
same["kept"] = same.AREALAND_PART / same.AREALAND_TRACT_10                 # share of the 2010 tract still in it
moved = same[(same.w < 0.99) | (same.kept < 0.99)]
print(f"tracts with the same ID in both years: {len(same)}; of those, land changed by more than 1%: {len(moved)}")
print(f"the largest change: the 2020 tract holds {moved.kept.min():.0%} of its 2010 namesake")
tracts with the same ID in both years: 1287; of those, land changed by more than 1%: 32
the largest change: the 2020 tract holds 83% of its 2010 namesake
3. Do not let slivers fill empty tracts
Boundary files are digitised slightly differently in each decade, so the relationship file lists thin slivers where a 2020 tract touches a neighbouring 2010 tract. Without a coverage threshold those slivers hand estimates to tracts that never had one:
cov = parts.groupby("GEOID_TRACT_20").w.sum().reindex(T20.GEOID).fillna(0)
own = T20.GEOID.isin(LE.GEOID).to_numpy()
print(f"2020 tracts without an estimate of their own that a sliver would fill: {((cov > 0) & (cov < 0.5) & ~own).sum()}")
print(f"new tracts recovered with at least half their land covered: {((cov >= 0.5) & new.to_numpy()).sum()} of {new.sum()}")
2020 tracts without an estimate of their own that a sliver would fill: 13
new tracts recovered with at least half their land covered: 40 of 44
What a tract split looks like, and whether it matters
The data used on this page
USALEEP life expectancy at birth for 2010–2015 by 2010 census tract (US_A.CSV), the Census Bureau's 2020 to 2010 census tract relationship file for Illinois, and the 2023 cartographic boundary file of Illinois tracts (2020 vintage), Cook County only. The relationship file has one row for every piece where a 2020 tract and a 2010 tract overlap, with its land area.
from pathlib import Path

import geopandas as gpd
import numpy as np
import pandas as pd
import requests

Path("data").mkdir(exist_ok=True)
SRC = {"US_A.CSV": "https://ftp.cdc.gov/pub/Health_Statistics/NCHS/Datasets/NVSS/USALEEP/CSV/US_A.CSV",
       "tab20_tract20_tract10_st17.txt": "https://www2.census.gov/geo/docs/maps-data/data/rel2020/tract/tab20_tract20_tract10_st17.txt",
       "cb_2023_17_tract_500k.zip": "https://www2.census.gov/geo/tiger/GENZ2023/shp/cb_2023_17_tract_500k.zip"}
for name, url in SRC.items():
    if not Path("data", name).exists():
        Path("data", name).write_bytes(requests.get(url, timeout=300).content)
LE = pd.read_csv("data/US_A.CSV", dtype={"Tract ID": str})
LE["GEOID"] = LE["Tract ID"].str.zfill(11)
LE = LE[LE.GEOID.str.startswith("17031")]
REL = pd.read_csv("data/tab20_tract20_tract10_st17.txt", sep="|", dtype=str, encoding="utf-8-sig")   # the header has a byte-order mark
for c in ("AREALAND_TRACT_20", "AREALAND_TRACT_10", "AREALAND_PART"):
    REL[c] = REL[c].astype(float)
REL = REL[REL.GEOID_TRACT_20.str.startswith("17031") & (REL.AREALAND_PART > 0)].copy()
REL["w"] = REL.AREALAND_PART / REL.AREALAND_TRACT_20           # share of the 2020 tract's land from each 2010 tract
T20 = gpd.read_file("data/cb_2023_17_tract_500k.zip").query("COUNTYFP == '031'").to_crs(3435)
print(f"{len(LE)} USALEEP estimates; {len(REL)} relationship pieces; {len(T20)} tracts in 2020")
1200 USALEEP estimates; 1533 relationship pieces; 1331 tracts in 2020
Example 1: what a split looks like
kids = REL[REL.w >= 0.01].groupby("GEOID_TRACT_10").GEOID_TRACT_20.nunique()
split = REL[REL.GEOID_TRACT_10.isin(kids[kids > 1].index) & (REL.AREALAND_PART / REL.AREALAND_TRACT_10 >= 0.2)]
split = split[split.groupby("GEOID_TRACT_10").GEOID_TRACT_10.transform("size") > 1]
g10 = split.GEOID_TRACT_10.iloc[0]
print(f"2010 tracts split between two or more 2020 tracts: {(kids > 1).sum()}; for example {g10}:")
for _, p in split[split.GEOID_TRACT_10 == g10].iterrows():
    print(f"  → {p.GEOID_TRACT_20} ({p.NAMELSAD_TRACT_20}): {p.AREALAND_PART / p.AREALAND_TRACT_10:.0%} of its land")
2010 tracts split between two or more 2020 tracts: 33; for example 17031320100:
→ 17031320101 (Census Tract 3201.01): 48% of its land
→ 17031320102 (Census Tract 3201.02): 52% of its land
Example 2: does it matter for an analysis?
Comparing 2010–2015 life expectancy with current PLACES estimates, which use 2020 tracts:
dia = pd.DataFrame(requests.get("https://data.cdc.gov/resource/cwsq-ngmh.json", params={
    "$where": "countyfips = '17031' AND measureid = 'DIABETES'", "$select": "locationname, data_value", "$limit": 5000},
    timeout=120).json()).astype({"data_value": float}).set_index("locationname")
by_id = dia.join(LE.set_index("GEOID")["e(0)"], how="inner")
by_cw = dia.join(cw.e0, how="inner")
print(f"joined by ID: {len(by_id)} tracts, r = {by_id.data_value.corr(by_id['e(0)']):.2f}; "
      f"through the relationship file: {len(by_cw)} tracts, r = {by_cw.data_value.corr(by_cw.e0):.2f}")
joined by ID: 1175 tracts, r = -0.69; through the relationship file: 1215 tracts, r = -0.69
The correlation is the same either way: here the ID join costs coverage, 40 tracts, rather than changing the answer. The blanks are not a random sample, though: tracts are split because their population grew, so an ID join drops growing neighbourhoods first.
Why tracts change every decade
Census tracts are designed to hold about 4,000 people, and each decade the Census Bureau, working with local participants, splits those that have grown and merges those that have shrunk. A split keeps the four-digit base and changes the suffix (Cook County's tract 3201 became 3201.01 and 3201.02), so the old ID disappears. Most tracts carry over unchanged, which is why an ID join looks as if it worked: the failures are a minority and show up only as blanks.
The relationship file is the Census Bureau's record of how the two sets of polygons overlap, with the land area of each overlapping piece. Weighting by land area assumes that people, and deaths, are spread evenly within each 2010 tract, which is rough in a tract that is half park or rail yard. The Census Bureau also publishes block-level relationship files, and weighting by 2010 block population is better where it matters. For a rate or a life expectancy the weighted mean is an approximation either way; for counts, such as deaths or cases, weight the counts and recompute the rate.
Vintages, counties and coverage thresholds
- Which vintage: USALEEP and older PLACES releases use 2010 tracts; the 2025 PLACES release uses 2020 tracts, as do ACS 5-year tables from the 2016–2020 release on. Check each dataset's documentation.
- Counties too: Connecticut replaced its counties with planning regions in 2022, so county FIPS codes changed as well.
- Same ID, different land: check the relationship file even for tracts that match, if the analysis is sensitive to boundaries.
- Coverage threshold: 50% is a judgement; report how many tracts it drops or fills.
- Rates and medians: area-weighted averages of rates are approximations; recompute from counts where you have them.
Internal links
- How to map life expectancy by census tract — the USALEEP data on its own boundaries
- How to map CDC PLACES health estimates by census tract — current tract-level measures
FAQ
Why do some census tract IDs not match between 2010 and 2020?
Tracts that grew were split and given new suffixes, and others were merged or renumbered, so their 2010 IDs no longer exist.
What is the Census tract relationship file?
A table from the Census Bureau listing every overlap between a 2020 tract and a 2010 tract, with the land and water area of each overlap, for converting data between vintages.
How do I convert 2010 tract data to 2020 tracts?
Join the data to the relationship file on the 2010 GEOID, weight each piece by its share of the 2020 tract's land (or by population), and aggregate by the 2020 GEOID.
Does a matching tract ID mean the same boundary?
Usually, but not always: in Cook County 32 tracts kept their ID while more than 1% of their land changed.