
Why Do the Latest Overdose Death Counts Always Look Like a Drop?
On this page
Problem statement
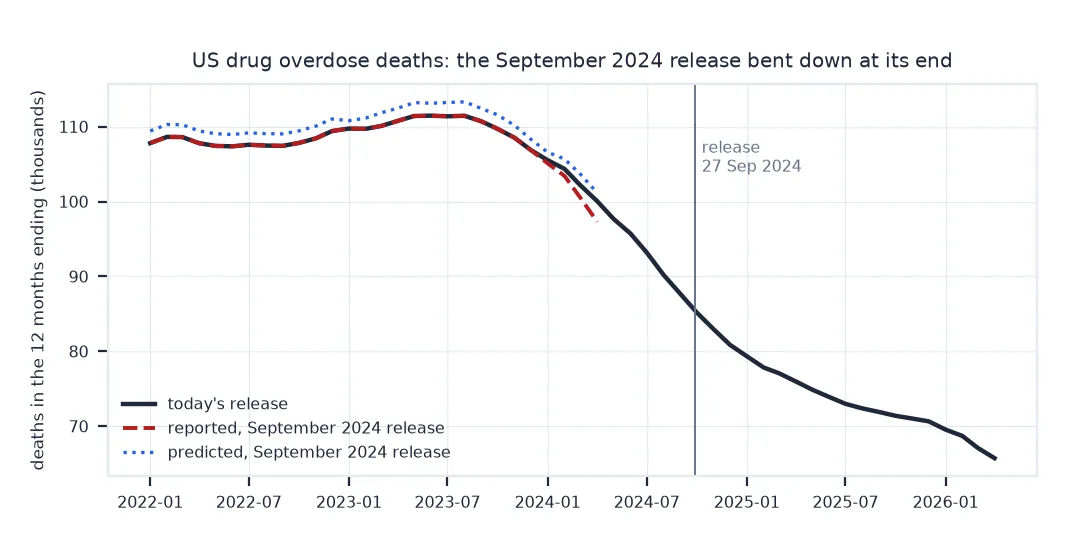
You download the CDC's provisional drug overdose death counts, plot or map the most recent months, and see deaths falling faster than ever. Some of that fall is real. Some is the data arriving: a death enters the provisional counts only once the death certificate has been filed and coded, and overdose deaths often wait weeks or months for toxicology before the cause is known. The most recent months are always incomplete, so any series of reported counts bends down at its end.
This page measures the effect directly. It compares a release of the CDC's provisional counts from September 2024, archived by the Internet Archive, with the same months in today's release, nationally and for each state, and checks how well the CDC's own adjusted "predicted" counts did.
Quick answer
Use the predicted values for recent months, and check what the reported counts for those months became later:
then = OLD[(OLD.State == "US") & (OLD.Indicator == IND)].set_index("t").sort_index()
now = NEW[(NEW.state == "US")].set_index("t").sort_index()
x = then[["Data Value", "Predicted Value"]].join(now.data_value.rename("today")).dropna().tail(6)
x["reported_then_vs_today"] = x["Data Value"] / x.today - 1
x["predicted_then_vs_today"] = x["Predicted Value"] / x.today - 1
print(x.map(lambda v: f"{v:+.1%}" if abs(v) < 1 else f"{v:,.0f}").to_string())
Data Value Predicted Value today reported_then_vs_today predicted_then_vs_today
t
202311 108,524 110,179 108,529 -0.0% +1.5%
202312 106,876 108,318 106,881 -0.0% +1.3%
202401 105,096 106,578 105,522 -0.4% +1.0%
202402 103,420 105,685 104,361 -0.9% +1.3%
202403 100,518 103,658 102,174 -1.6% +1.5%
202404 97,309 101,168 100,052 -2.7% +1.1%
Measure undercount by recency, check states, use predictions
1. Measure the undercount by how recent the month was
Line up each 12-month period in the old release with today's figure, by how many months before the release it ended:
last = then.index.max()
full = then[["Data Value"]].join(now.data_value.rename("today")).dropna()
full["lag"] = [(last // 100 - t // 100) * 12 + (last % 100 - t % 100) for t in full.index]   # months before the newest
short_by_lag = full.assign(short=1 - full["Data Value"] / full.today).set_index("lag").short.sort_index()
print(short_by_lag.loc[0:11].map("{:.1%}".format).to_string())
lag
0 2.7%
1 1.6%
2 0.9%
3 0.4%
4 0.0%
5 0.0%
6 0.0%
7 0.0%
8 0.0%
9 0.0%
10 0.0%
11 0.0%
The newest month in the release was 2.7% short of today's count, the one before it 1.6%; from four months back, the September 2024 counts and today's agree to the nearest 0.1%. In this release, the incomplete stretch was the last four months.
2. Look at the states, where it is larger
st = OLD[(OLD.Indicator == IND) & (OLD.t == last) & (OLD.State != "US")].set_index("State")["Data Value"]
st_now = NEW[NEW.t == last].set_index("state").data_value
short = (1 - st / st_now).dropna().sort_values(ascending=False)
print(f"{len(short)} jurisdictions; shortfall in the newest month: median {short.median():.1%}, "
      f"largest {short.iloc[0]:.1%} ({short.index[0]}), {(short > 0.05).sum()} above 5%")
print(short.head(5).map("{:.1%}".format).to_string())
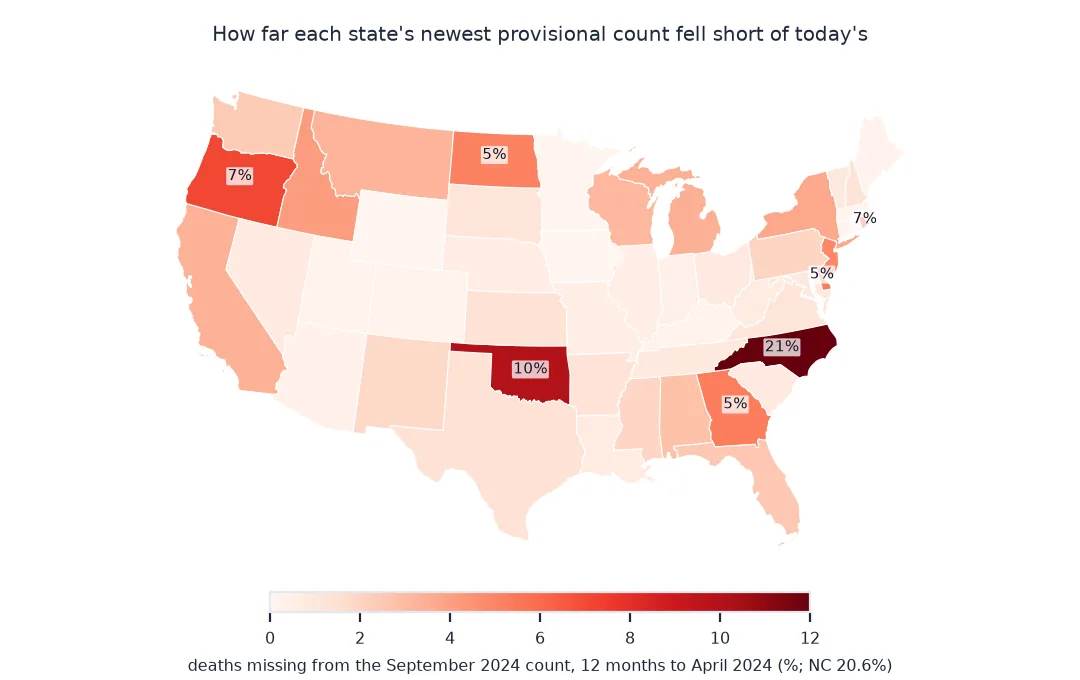
52 jurisdictions; shortfall in the newest month: median 1.2%, largest 20.6% (NC), 8 above 5%
State
NC 20.6%
OK 9.9%
HI 8.8%
RI 7.4%
OR 7.1%
3. Use the predicted values, and know their limits
The CDC publishes predicted counts that adjust for the expected delay. They removed most of the undercount, but erred in the other direction:
p = then[["Predicted Value"]].join(now.data_value.rename("today")).dropna().loc[:last].tail(12)
err = p["Predicted Value"] / p.today - 1
print(f"predicted counts in the old release, last 12 months: from {err.min():+.1%} to {err.max():+.1%} against today's counts")
predicted counts in the old release, last 12 months: from +1.0% to +1.7% against today's counts
The early-2024 fall, then and now
The data used on this page
The CDC's VSRR Provisional Drug Overdose Death Counts (xkb8-kh2a on data.cdc.gov) as published today, and the same dataset as exported on 27 September 2024, retrieved from the Internet Archive. Counts are 12-month-ending totals by month, by state of residence, with Data Value the reported count and Predicted Value the CDC's adjusted count.
from pathlib import Path

import numpy as np
import pandas as pd
import requests

Path("data").mkdir(exist_ok=True)
ARCHIVE = ("https://web.archive.org/web/20240927215338id_/"
           "https://data.cdc.gov/api/views/xkb8-kh2a/rows.csv?accessType=DOWNLOAD")
F = Path("data/vsrr_2024-09-27.csv")
if not F.exists():
    F.write_bytes(requests.get(ARCHIVE, timeout=600).content)
IND = "Number of Drug Overdose Deaths"
MONTH = {m: i for i, m in enumerate(["January", "February", "March", "April", "May", "June", "July",
                                     "August", "September", "October", "November", "December"], 1)}
OLD = pd.read_csv(F, low_memory=False)
OLD = OLD[OLD.Indicator == IND].copy()
for c in ("Data Value", "Predicted Value"):
    OLD[c] = pd.to_numeric(OLD[c].astype(str).str.replace(",", ""), errors="coerce")
OLD["t"] = OLD.Year * 100 + OLD.Month.map(MONTH)                     # 202404 = 12 months ending April 2024
NEW = pd.DataFrame(requests.get("https://data.cdc.gov/resource/xkb8-kh2a.json", timeout=120, params={
    "$where": f"indicator = '{IND}'", "$select": "state, year, month, data_value, predicted_value, percent_pending_investigation",
    "$limit": 50000}).json())
NEW["t"] = NEW.year.astype(int) * 100 + NEW.month.map(MONTH)
for c in ("data_value", "predicted_value", "percent_pending_investigation"):
    NEW[c] = pd.to_numeric(NEW[c], errors="coerce")
print(f"September 2024 release: periods to {OLD.t.max()}; today's release: periods to {NEW.t.max()}")
September 2024 release: periods to 202404; today's release: periods to 202604
Example 1: the fall in early 2024, then and now
for label, s in (("reported in September 2024", then["Data Value"]), ("today", now.data_value)):
    print(f"{label}: {s[202312]:,.0f} (year to December 2023) → {s[last]:,.0f} (year to April 2024), {s[last] / s[202312] - 1:+.1%}")
reported in September 2024: 106,876 (year to December 2023) → 97,309 (year to April 2024), -9.0%
today: 106,881 (year to December 2023) → 100,052 (year to April 2024), -6.4%
The fall was real: today's counts show 6.4% fewer deaths in the year to April 2024 than in 2023. The release of September 2024 showed 9.0%, overstating it by about two fifths.
Example 2: today's newest months
The same caution applies to the current release. Its newest months show the widest gap between reported and predicted values, and the highest share of deaths pending investigation:
cur = now.sort_index().tail(6)
print(cur.assign(gap=cur.predicted_value / cur.data_value - 1)[["data_value", "predicted_value", "gap", "percent_pending_investigation"]]   # the last is a percentage
      .round(3).to_string())
data_value predicted_value gap percent_pending_investigation
t
202511 71017 71293 0.004 0.105
202512 70646 70735 0.001 0.103
202601 69544 69800 0.004 0.130
202602 68689 69150 0.007 0.162
202603 67104 67923 0.012 0.205
202604 65726 66937 0.018 0.259
A running tally of certificates
Provisional counts are a running tally of death certificates received and coded. A certificate for a death from a heart attack is usually complete when filed; an overdose needs a toxicology report, and the certificate stays "pending investigation" until the medical examiner or coroner amends it. Those deaths join the overdose count late, so each new release adds deaths to the most recent months. Jurisdictions differ greatly in how quickly toxicology is completed, which is why the shortfall in one state can be several times the national one.
The predicted values model that delay from past completeness and the share of records pending, and they removed most of the gap in this comparison. They are themselves estimates: in this release they overshot by around one to two percent. Neither column is a final count, and a trend measured over the newest few months mixes real change with data that have not yet arrived.
Waiting or adjusting, and pending shares
- Wait or adjust: for trends, either stop six months before the release date or use predicted values, and say which.
- States: compare a state's newest months only with its own completeness; a slow state's provisional figures fall more.
- Pending share:
percent_pending_investigationis the best single warning sign in each release. - Final data: NCHS final data replace provisional counts about a year after the end of each year.
- Archives: keeping each release you use, with its date, is the only way to measure revisions later.
Internal links
- How to map county drug overdose death rates — county data and their modelled rates
- Why does my death rate map just show where old people live? — another way death data mislead
FAQ
Why do recent overdose death counts look low?
Deaths enter the provisional counts as certificates are completed, and overdose deaths often wait for toxicology, so the latest months are incomplete.
What is the predicted value in CDC provisional overdose data?
The CDC's estimate of the count after adjusting for reporting delays, based on past completeness and the share of records pending investigation.
How much do provisional overdose counts change?
In the September 2024 release, the newest national 12-month count was 2.7% below today's figure; state figures changed by more.
When are overdose death counts final?
NCHS releases final mortality data for a year about eleven or twelve months after it ends.