
How to Map Health Estimates by ZIP Code in Python
On this page
Problem statement
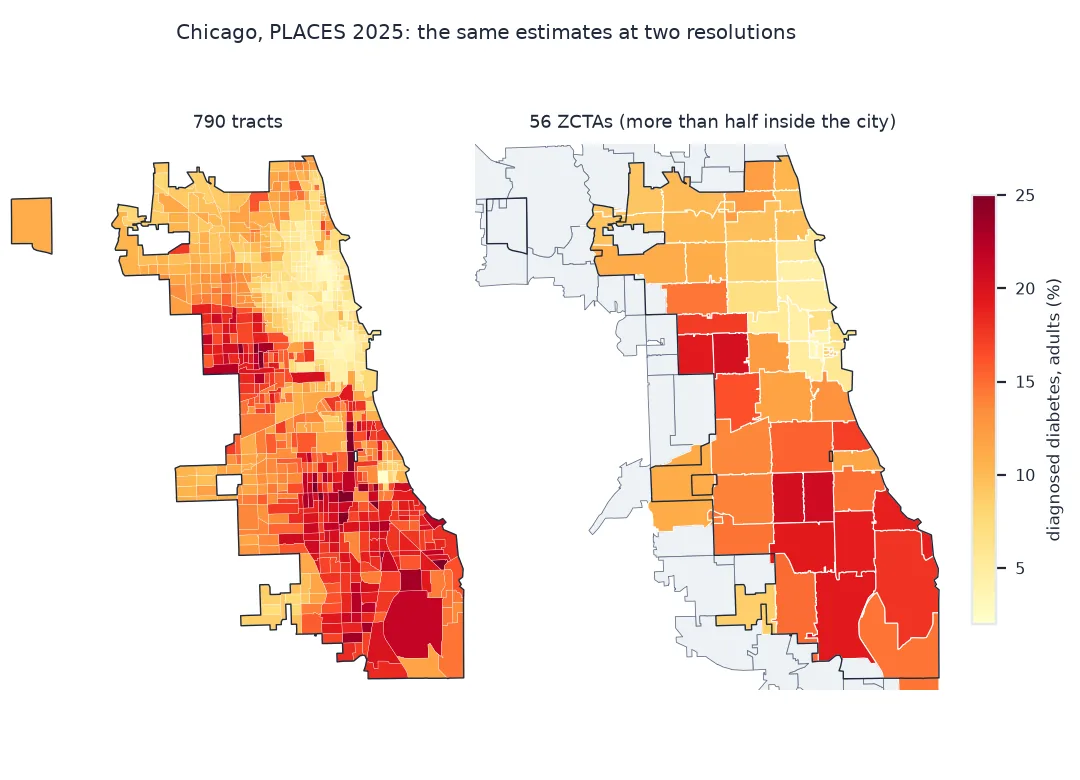
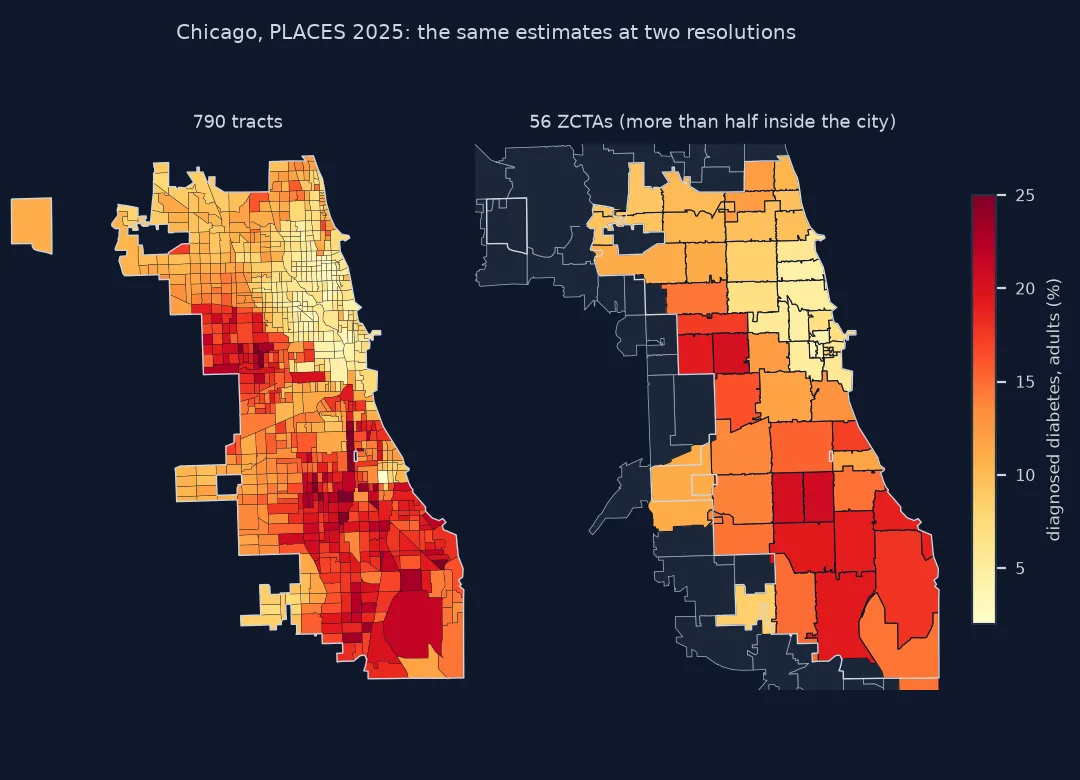
Health departments, hospitals and the public all think in ZIP codes, and CDC PLACES publishes its estimates for them, or rather for ZIP Code Tabulation Areas (ZCTAs), the Census Bureau's polygons built from census blocks to approximate ZIP code delivery areas. The difference matters. ZIP codes are mail routes, not areas; some belong to a single building or organisation and have no ZCTA at all; ZCTAs cross city and county lines freely; and they are much larger than tracts, so a ZCTA map hides variation a tract map shows.
This page maps PLACES 2025 diabetes estimates for the ZCTAs of Chicago, checks which ZIP codes in a real address list have no ZCTA, and compares the ZCTA map with the tract map of the same city.
Quick answer
Join the PLACES ZCTA estimates to the ZCTA boundary file on the five-digit code, kept as text:
z = ZCTA[ZCTA.ZCTA5CE20.isin(CHI_ZCTAS)].merge(PZ, left_on="ZCTA5CE20", right_on="locationname", how="left")
print(f"{len(z)} ZCTAs at least half inside Chicago; with an estimate: {z.data_value.notna().sum()}")
print(f"diagnosed diabetes: {z.data_value.min():.1f}% to {z.data_value.max():.1f}%; adult-weighted city figure "
      f"{np.average(z.data_value, weights=z.totalpop18plus):.2f}% (PLACES city estimate {CITY_DIABETES:.1f}%)")
56 ZCTAs at least half inside Chicago; with an estimate: 56
diagnosed diabetes: 3.3% to 20.9%; adult-weighted city figure 11.95% (PLACES city estimate 12.0%)
Not every ZIP has a ZCTA, and ZCTAs ignore city limits
1. Not every ZIP code has a ZCTA
ZIP codes assigned to one organisation, a post office box section or a large building have no area of their own, so they have no ZCTA and no PLACES estimate. An address list joined by ZIP will lose them silently:
zips = HOSP["ZIP Code"].str[:5]
missing = HOSP[~zips.isin(set(ZCTA.ZCTA5CE20))]
print(f"Illinois hospitals: {len(HOSP)}; ZIP codes with no ZCTA: {len(missing)}")
print(missing[["Facility Name", "City/Town", "ZIP Code"]].to_string(index=False))
Illinois hospitals: 193; ZIP codes with no ZCTA: 3
Facility Name City/Town ZIP Code
ST JOHNS HOSPITAL SPRINGFIELD 62769
SAINT FRANCIS MEDICAL CENTER PEORIA 61637
CARLE HEALTH METHODIST HOSPITAL PEORIA 61636
Hospitals are a common case: some large ones have their own ZIP codes. Assign such addresses to a ZCTA by geocoding them, not by their ZIP.
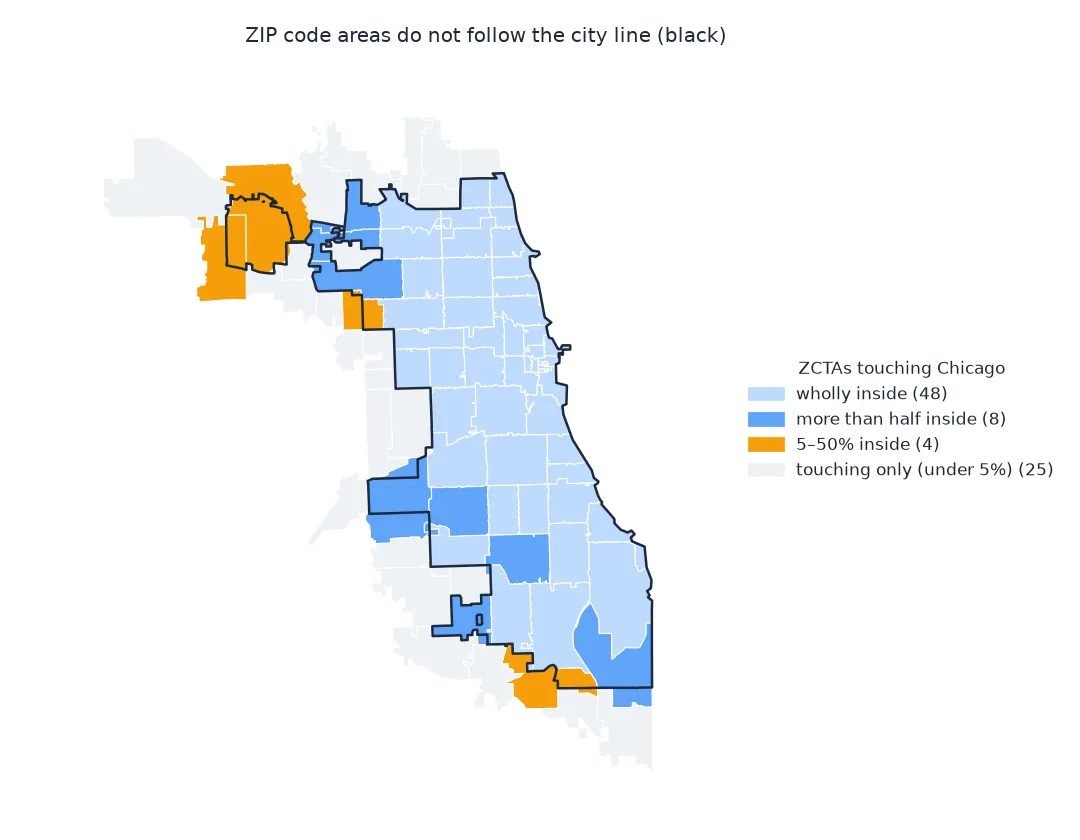
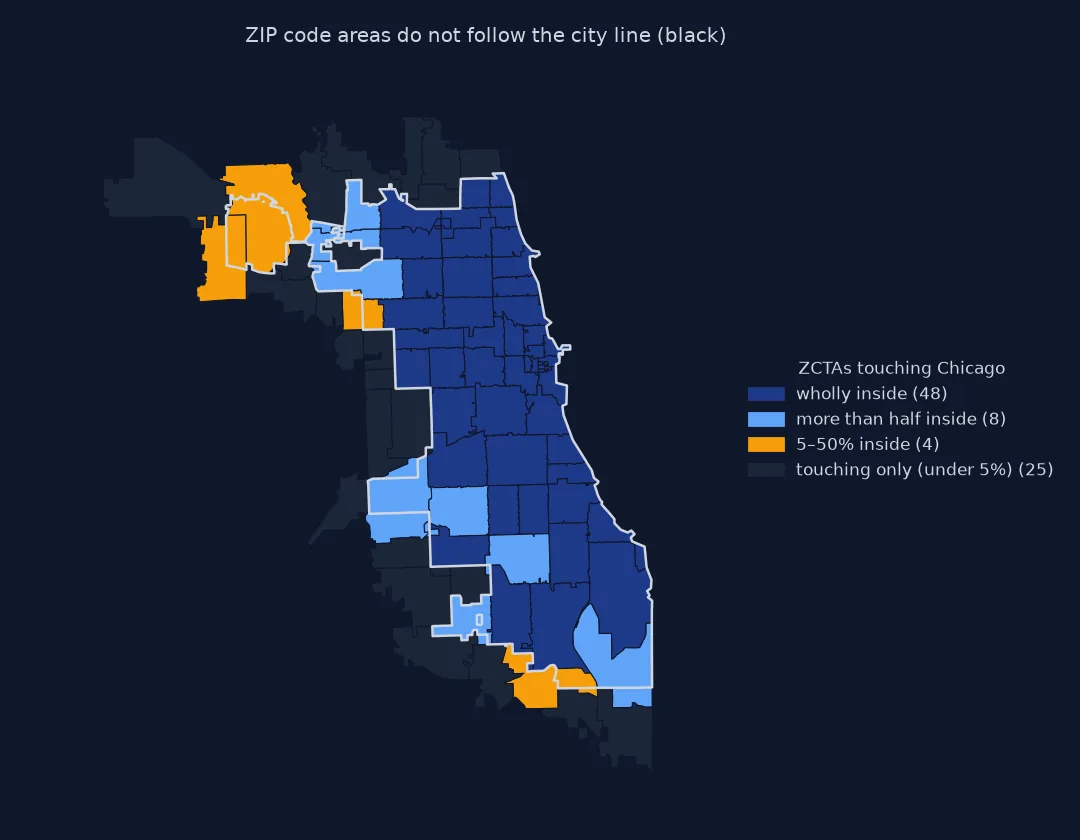
2. ZCTAs ignore city limits
share = ZCTA_CHI.share_in_city
print(f"ZCTAs touching Chicago: {len(ZCTA_CHI)}; more than half inside: {(share > 0.5).sum()}; wholly inside: {(share > 0.99).sum()}")
straddle = ZCTA_CHI[(share > 0.05) & (share < 0.95)]
print(f"straddling the city line (5–95% inside): {len(straddle)}, with {PZ.set_index('locationname').totalpop18plus.reindex(straddle.ZCTA5CE20).sum():,.0f} adults")
ZCTAs touching Chicago: 85; more than half inside: 56; wholly inside: 48
straddling the city line (5–95% inside): 7, with 167,080 adults
3. Larger units smooth the map
A Chicago ZCTA holds as many adults as about fifteen tracts. Averaging over them narrows the range of the estimates and moves the extremes towards the middle:
summary = pd.DataFrame({
    "units": [len(TRACT_EST), len(z)],
    "median adults": [TRACT_EST.totalpop18plus.median(), z.totalpop18plus.median()],
    "lowest": [TRACT_EST.data_value.min(), z.data_value.min()],
    "highest": [TRACT_EST.data_value.max(), z.data_value.max()],
    "std": [TRACT_EST.data_value.std(), z.data_value.std()]}, index=["tracts", "ZCTAs"])
print(summary.round(1).to_string())
units median adults lowest highest std
tracts 790 2538.0 2.0 32.3 5.6
ZCTAs 56 37984.5 3.3 20.9 5.1
The highest tract estimate is 32.3%, the highest ZCTA estimate 20.9%; the spread of the whole map changes less, because the large differences between the South and West Sides and the north lakefront are bigger than any ZCTA.
ZCTAs that straddle the city line
The data used on this page
CDC PLACES 2025 release: ZCTA estimates (qnzd-25i4), tract estimates (cwsq-ngmh) and the place estimate for Chicago (eav7-hnsx), crude prevalence of diagnosed diabetes; the Census 2020 ZCTA cartographic boundary file, the 2023 Illinois place and tract files, and the CMS Hospital General Information file as an example address list.
from pathlib import Path

import geopandas as gpd
import numpy as np
import pandas as pd
import requests

Path("data").mkdir(exist_ok=True)
meta = requests.get("https://data.cms.gov/provider-data/api/1/metastore/schemas/dataset/items/xubh-q36u", timeout=60).json()
SRC = {"cb_2020_us_zcta520_500k.zip": "https://www2.census.gov/geo/tiger/GENZ2020/shp/cb_2020_us_zcta520_500k.zip",
       "cb_2023_17_place_500k.zip": "https://www2.census.gov/geo/tiger/GENZ2023/shp/cb_2023_17_place_500k.zip",
       "cb_2023_17_tract_500k.zip": "https://www2.census.gov/geo/tiger/GENZ2023/shp/cb_2023_17_tract_500k.zip",
       "Hospital_General_Information.csv": meta["distribution"][0]["downloadURL"]}
for name, url in SRC.items():
    if not Path("data", name).exists():
        Path("data", name).write_bytes(requests.get(url, timeout=600).content)

def places(dataset, where, select="locationname, data_value, totalpop18plus"):
    d = pd.DataFrame(requests.get(f"https://data.cdc.gov/resource/{dataset}.json", timeout=120,
                                  params={"$where": where, "$select": select, "$limit": 50000}).json())
    return d.astype({c: float for c in ("data_value", "totalpop18plus") if c in d})

chicago = gpd.read_file("data/cb_2023_17_place_500k.zip").query("GEOID == '1714000'").to_crs(3435).geometry.iloc[0]
ZCTA = gpd.read_file("data/cb_2020_us_zcta520_500k.zip").to_crs(3435)
ZCTA_CHI = ZCTA[ZCTA.ZCTA5CE20.str.startswith("60") & ZCTA.intersects(chicago)].copy()
ZCTA_CHI["share_in_city"] = ZCTA_CHI.intersection(chicago).area / ZCTA_CHI.area
CHI_ZCTAS = ZCTA_CHI[ZCTA_CHI.share_in_city > 0.5].ZCTA5CE20
PZ = places("qnzd-25i4", "measureid = 'DIABETES' AND starts_with(locationname, '60')")
tracts = gpd.read_file("data/cb_2023_17_tract_500k.zip").to_crs(3435)
tracts = tracts[tracts.intersects(chicago)]
in_city = tracts[tracts.intersection(chicago).area / tracts.area > 0.5].GEOID
TRACT_EST = places("cwsq-ngmh", "countyfips in ('17031', '17043') AND measureid = 'DIABETES'").query("locationname in @in_city")
CITY_DIABETES = places("eav7-hnsx", "locationid = '1714000' AND measureid = 'DIABETES' AND datavaluetypeid = 'CrdPrv'", "data_value").data_value.iloc[0]
h = pd.read_csv("data/Hospital_General_Information.csv", dtype=str)
HOSP = h[h.State == "IL"]
print(f"{len(ZCTA):,} ZCTAs nationally; {len(PZ)} PLACES ZCTA estimates starting 60; {len(TRACT_EST)} Chicago tracts with estimates")
33,791 ZCTAs nationally; 395 PLACES ZCTA estimates starting 60; 790 Chicago tracts with estimates
Example 1: the ZCTAs that straddle the city line
print(ZCTA_CHI.assign(inside=lambda d: d.share_in_city.round(2)).query("0.05 < inside < 0.95")
      .merge(PZ, left_on="ZCTA5CE20", right_on="locationname")[["ZCTA5CE20", "inside", "data_value", "totalpop18plus"]]
      .sort_values("inside").to_string(index=False))
ZCTA5CE20 inside data_value totalpop18plus
60827 0.24 18.9 17937.0
60106 0.29 11.6 15879.0
60707 0.47 11.4 34571.0
60018 0.47 11.4 23384.0
60638 0.54 11.1 43973.0
60633 0.83 14.6 10254.0
60655 0.91 8.5 21082.0
How ZCTAs are built from blocks
ZCTAs are built by the Census Bureau from census blocks: each block is assigned to the ZIP code most of its addresses use, and blocks with the same ZIP code are joined into a polygon. ZIP codes that serve a single building, a business or a post office box section, and ZIP codes with no residential addresses, generally do not become ZCTAs. Because ZIP codes follow postal routes, ZCTAs cut across city, county and even state lines, and they change between censuses.
For mapping health, ZCTAs are a compromise: familiar to readers, coarser than tracts, and awkward at boundaries. Their PLACES estimates come from the same small-area model as tract estimates, applied to each ZCTA's population, which is why the adult-weighted average over a city's ZCTAs lands on the city's own figure. Where the audience thinks in ZIP codes, map ZCTAs and label them as such; where detail matters, map tracts.
Leading zeros, ZIP+4 and crosswalks
- Leading zeros: ZIP codes in New England and New Jersey start with 0; read them as text.
- ZIP+4: strip addresses to five digits before joining.
- Vintage: PLACES 2025 uses 2020 ZCTAs; a ZCTA can be added or dropped between censuses.
- Crosswalks: HUD-USPS crosswalk files allocate ZIP codes to tracts and counties by address counts, but require a free account.
- Unique ZIPs on maps: a hospital ZIP code is a point, not an area; never draw it as one.
Internal links
- How to aggregate tract health estimates to neighbourhoods — the tract route to custom areas
- How to map CDC PLACES health estimates by census tract — the finer map
FAQ
Is a ZCTA the same as a ZIP code?
No. A ZCTA is a Census Bureau area built from census blocks to approximate a ZIP code's delivery area; some ZIP codes have no ZCTA and boundaries differ.
Why does my ZIP code have no data?
It is probably a unique ZIP code for an organisation, a building or post office boxes, which has no ZCTA and so no area-based estimate.
Where can I get health estimates by ZIP code?
CDC PLACES publishes estimates for 40 measures by ZCTA; join them to the Census ZCTA boundary file on the five-digit code.
Should I map health data by ZIP code or census tract?
Tracts show more detail and nest in counties; ZCTAs are familiar to readers but coarser and cross boundaries.