
How to Map CDC PLACES Health Estimates by Census Tract in Python
On this page
Problem statement
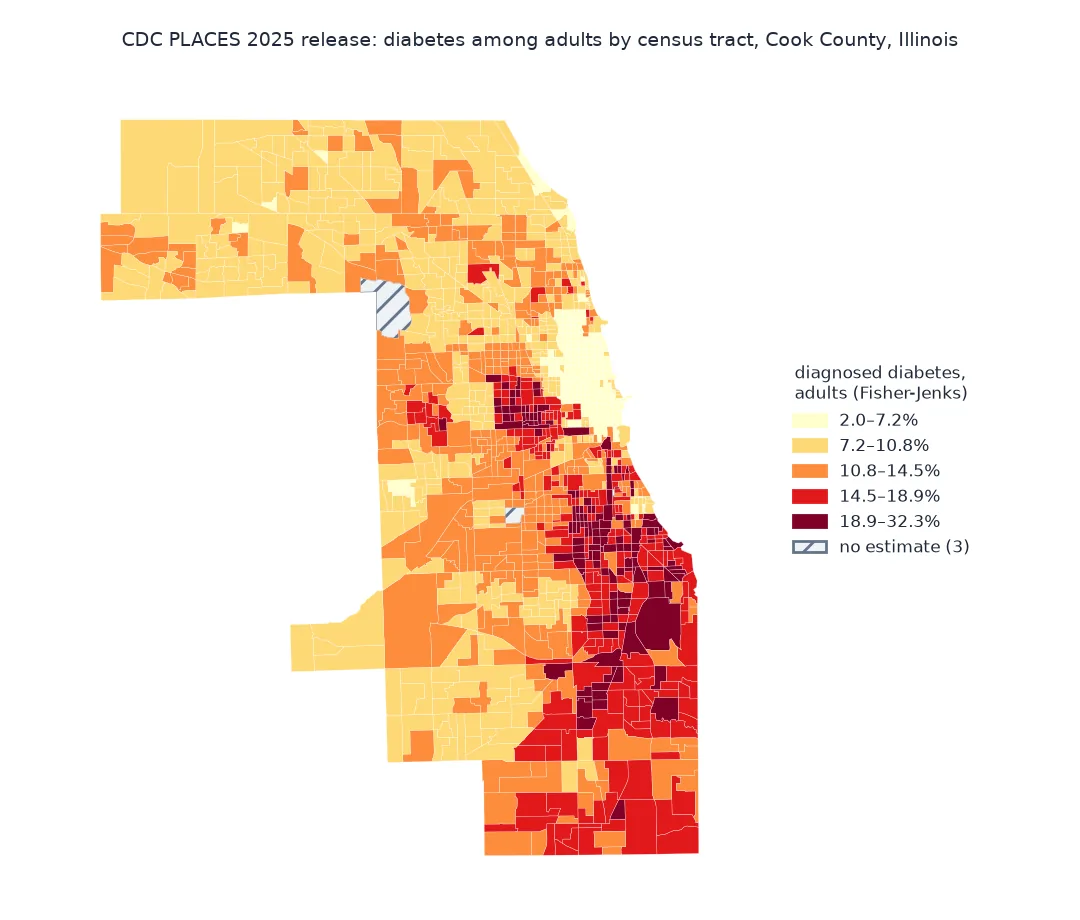
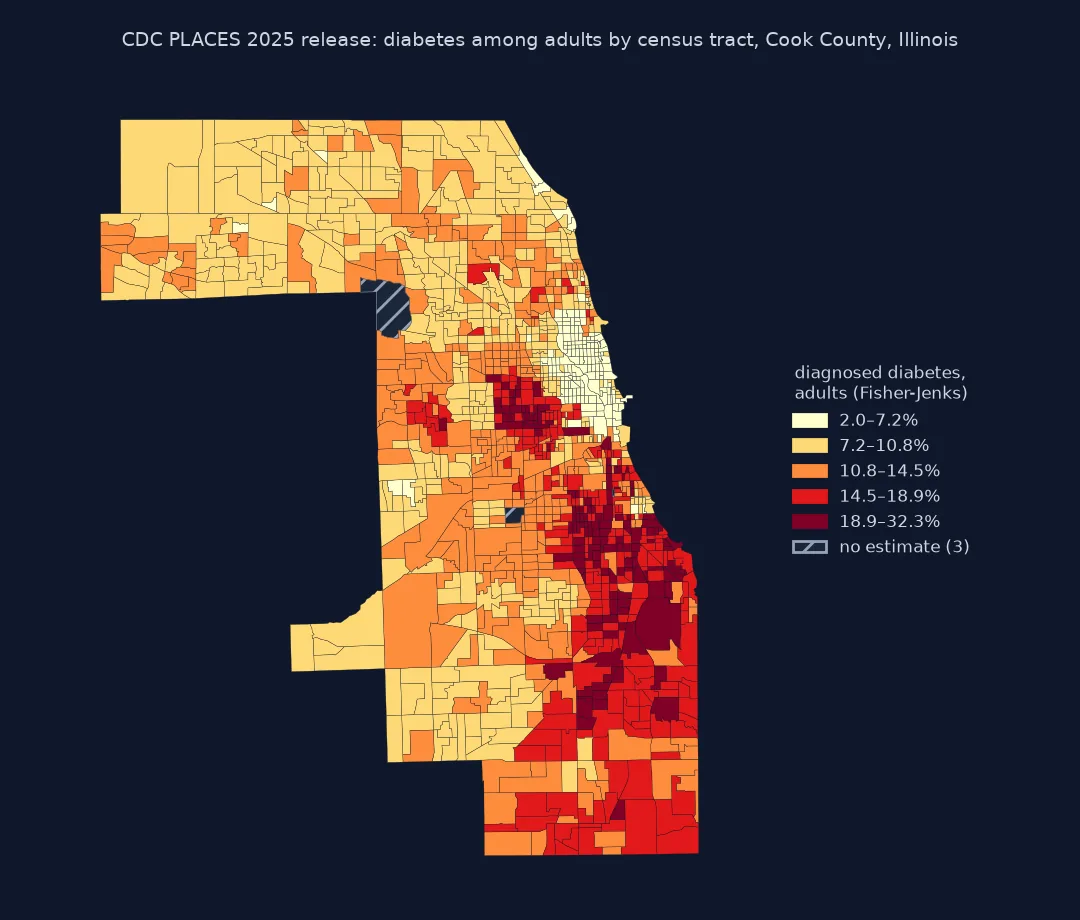
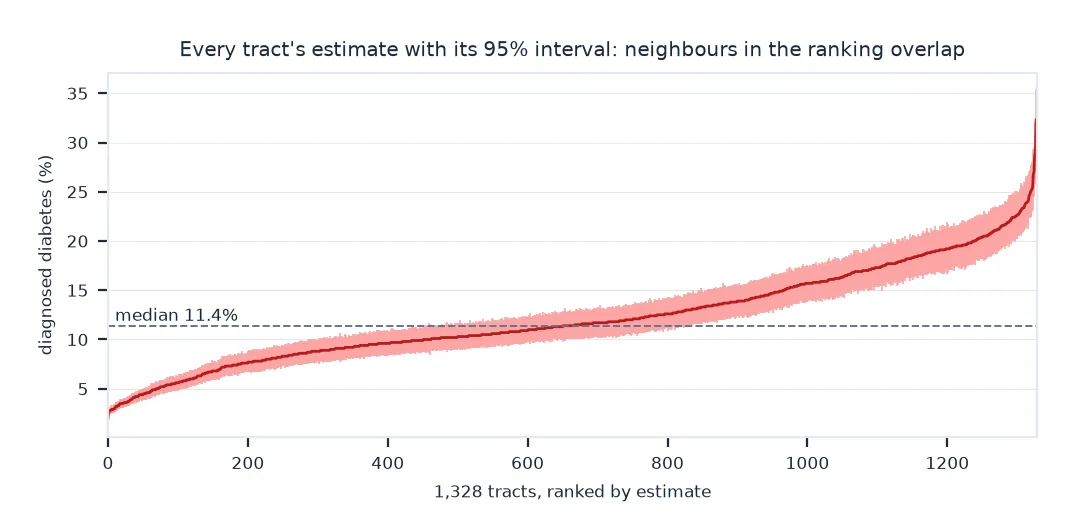
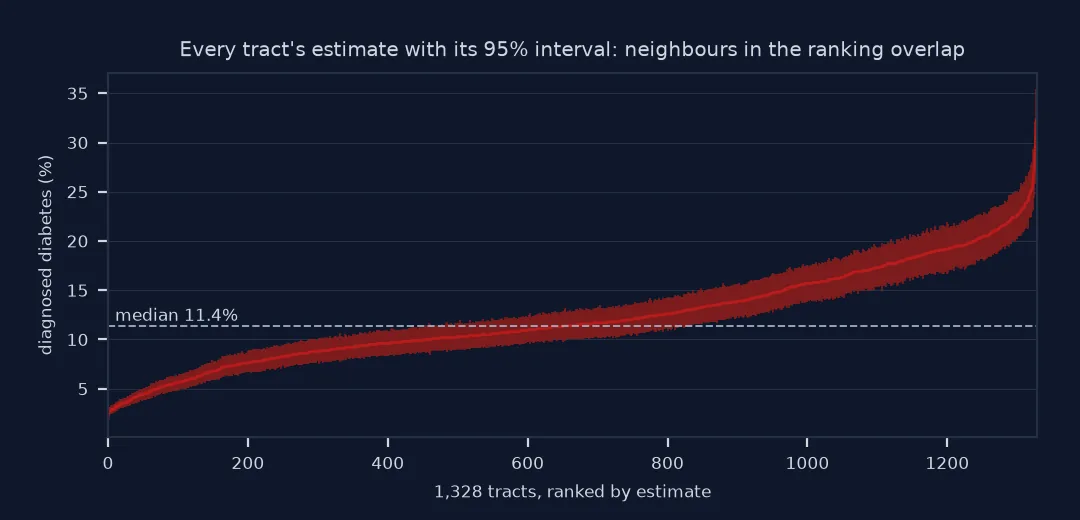
One query to CDC PLACES' Socrata API, with no key, returns 2023 estimates of diagnosed diabetes for 1,328 of Cook County's census tracts — from 2.0% of adults to 32.3%, each with a 95% interval. Mapping them takes a $where clause, a join on the tract GEOID to 2020-vintage boundaries (three tracts have no estimate), and a classification that does not overstate the differences: for 35% of random pairs of tracts, the two intervals overlap.
This page downloads PLACES diabetes estimates for the 1,328 tracts of Cook County, Illinois, joins them to 2020-vintage tract boundaries, maps them, and measures how often two tracts' estimates cannot be told apart.
Quick answer
Query the tract dataset with a $where clause and join on the tract GEOID:
def soql(dataset, where, select="*", group=None, page=5000):
    rows, offset = [], 0
    while True:
        params = {"$select": select, "$where": where, "$limit": page, "$offset": offset}
        params.update({"$group": group} if group else {"$order": ":id"})          # stable paging
        part = requests.get(f"https://data.cdc.gov/resource/{dataset}.json", params=params, timeout=120).json()
        rows += part; offset += len(part)
        if len(part) < page:
            return pd.DataFrame(rows)

dia = soql("cwsq-ngmh", "countyfips = '17031' AND measureid = 'DIABETES'",
           "locationname, data_value, low_confidence_limit, high_confidence_limit, totalpop18plus, year")
dia = dia.astype({"data_value": float, "low_confidence_limit": float, "high_confidence_limit": float, "totalpop18plus": int})
gdf = TRACTS.merge(dia, left_on="GEOID", right_on="locationname", how="left")
print(f"{len(dia)} tract estimates for {dia.year.iloc[0]}; joined {gdf.data_value.notna().sum()} of {len(TRACTS)} tracts")
print(f"diagnosed diabetes among adults: {dia.data_value.min():.1f}% to {dia.data_value.max():.1f}%, median {dia.data_value.median():.1f}%")
1328 tract estimates for 2023; joined 1328 of 1331 tracts
diagnosed diabetes among adults: 2.0% to 32.3%, median 11.4%
Find measure codes, examine missing tracts, read the intervals
1. Find the measures and their codes
The dataset is long: one row per tract and measure. Ask the API what is there instead of guessing codes:
m = soql("cwsq-ngmh", "countyfips = '17031'", "measureid, measure, count(*) as n", group="measureid, measure")
print(f"{len(m)} measures, for example:")
print(m.sort_values("measureid").head(6)[["measureid", "measure"]].to_string(index=False))
40 measures, for example:
measureid measure
ACCESS2 Current lack of health insurance among adults aged 18-64 years
ARTHRITIS Arthritis among adults
BINGE Binge drinking among adults
BPHIGH High blood pressure among adults
BPMED Taking medicine to control high blood pressure among adults with high blood pressure
CANCER Cancer (non-skin) or melanoma among adults
2. Look at the tracts with no estimate
A few tracts in the boundary file have no row in PLACES:
missing = gdf[gdf.data_value.isna()]
print(f"{len(missing)} tracts without an estimate; their land area: {missing.ALAND.sum() / 1e6:.1f} km²; tract IDs: {missing.GEOID.tolist()}")
3 tracts without an estimate; their land area: 23.1 km²; tract IDs: ['17031381700', '17031980100', '17031980000']
Tracts with no or very few residents, such as parks, airports and water, get no estimate. Leave them blank on the map rather than filling them with zero.
3. Read the confidence intervals
Every estimate has a 95% interval. Its width shows how precisely the model pins down each tract, and decides which differences are meaningful:
dia["ci_width"] = dia.high_confidence_limit - dia.low_confidence_limit
print(f"interval width: median {dia.ci_width.median():.1f} points, range {dia.ci_width.min():.1f}–{dia.ci_width.max():.1f}")
pairs = dia.sample(2000, replace=True, random_state=1).reset_index(drop=True).join(dia.sample(2000, replace=True, random_state=2).reset_index(drop=True), rsuffix="_b")
overlap = (pairs.low_confidence_limit <= pairs.high_confidence_limit_b) & (pairs.low_confidence_limit_b <= pairs.high_confidence_limit)
print(f"random pairs of tracts whose intervals overlap: {overlap.mean():.0%}")
interval width: median 2.8 points, range 0.5–6.3
random pairs of tracts whose intervals overlap: 35%
Two PLACES measures on the same tracts
The data used on this page
CDC PLACES census tract data (dataset cwsq-ngmh on data.cdc.gov, 2025 release), model-based estimates from the Behavioral Risk Factor Surveillance System (BRFSS) and Census data, and the 2023 Census cartographic boundary file of Illinois tracts (2020 vintage), Cook County only.
from pathlib import Path

import geopandas as gpd
import numpy as np
import pandas as pd
import requests

Path("data").mkdir(exist_ok=True)
F = Path("data/cb_2023_17_tract_500k.zip")
if not F.exists():
    F.write_bytes(requests.get("https://www2.census.gov/geo/tiger/GENZ2023/shp/cb_2023_17_tract_500k.zip", timeout=300).content)
TRACTS = gpd.read_file(F).query("COUNTYFP == '031'").to_crs(3435)                  # Illinois East state plane, feet
print(f"{len(TRACTS)} Cook County tracts (2020 vintage)")
1331 Cook County tracts (2020 vintage)
Example 1: two measures on the same tracts
ob = soql("cwsq-ngmh", "countyfips = '17031' AND measureid = 'OBESITY'", "locationname, data_value").astype({"data_value": float})
both = dia.merge(ob, on="locationname", suffixes=("_diabetes", "_obesity"))
print(f"{len(both)} tracts; correlation of diabetes and obesity estimates: {both.data_value_diabetes.corr(both.data_value_obesity):.2f}")
1328 tracts; correlation of diabetes and obesity estimates: 0.90
PLACES models what it does not survey
PLACES does not survey every tract. It fits a multilevel model to the BRFSS telephone survey, relating each health outcome to age, sex, race and ethnicity and to county and state effects, and then applies the model to each tract's Census population. The estimates are therefore predictions: they inherit the tract's demographic make-up and the survey's patterns, and they are smooth where the population is similar. The confidence intervals express the model's uncertainty, not sampling error in the tract itself.
That makes PLACES excellent for seeing broad patterns and for planning, and weak for ranking individual tracts or for studying how a health outcome relates to the demographics that went into the model. Two neighbouring tracts a point or two apart are usually not distinguishable. Classes on the map should be wide enough that tracts within a class are comparable, and the interval width belongs in the legend or a companion map.
Tract vintage, crude rates and Socrata limits
- Tract vintage: the 2025 release uses 2020 tracts; older releases used 2010 tracts, which do not join to 2020 boundaries without a crosswalk.
- Crude and age-adjusted: the dataset carries crude prevalence at tract level; county-level data also offer age-adjusted values.
- Socrata limits: page with
$limitand$offset, and order by:idso pages do not overlap. - Numbers as text: the JSON API returns numbers as strings; cast them before arithmetic.
- Year: the measure year (here survey year 2023) differs from the release year.
Internal links
- Why do my health estimates look like a poverty map? — what model-based estimates contain
- Small area rates explained — why small areas need special methods
FAQ
How do I download CDC PLACES data in Python?
Query https://data.cdc.gov/resource/cwsq-ngmh.json with Socrata parameters ($where, $select, $limit, $offset) using requests, and build a DataFrame from the JSON.
Are PLACES tract estimates measured or modelled?
Modelled: they are small area estimates from the BRFSS survey and Census data, not counts from each tract.
Which census tracts does PLACES use?
The 2025 release uses 2020 census tracts, so it joins directly to current Census tract boundaries on the 11-digit GEOID.
How should I show PLACES confidence intervals on a map?
Use classes wider than typical interval widths, show interval width in a companion map, or mark tracts whose intervals overlap the county value.