
How to Map Life Expectancy by Census Tract in Python
On this page
Problem statement
Life expectancy at birth summarises a population's mortality in one number, and between neighbourhoods of the same city it can differ by decades. The US Small-Area Life Expectancy Estimates Project (USALEEP) published it for almost every census tract for 2010–2015, with a standard error for each, as one CSV file. Mapping it is a join to tract boundaries, with three details that decide whether the map is right: the tract IDs need their leading zeros, the boundaries must be the 2010 tracts the estimates were made for, and the standard errors are large enough to change which differences are real.
This page maps USALEEP life expectancy for Cook County, Illinois, and measures the gap between its tracts and how much of it survives the uncertainty.
Quick answer
Read the tract IDs as text, restore the leading zero, and join to 2010-vintage tracts:
le = pd.read_csv(USALEEP, dtype={"Tract ID": str})
le["GEOID"] = le["Tract ID"].str.zfill(11)
cook = le[le.GEOID.str.startswith("17031")]
gdf = TRACTS_2010.merge(cook[["GEOID", "e(0)", "se(e(0))"]], on="GEOID", how="left")
print(f"{len(cook)} Cook County estimates; {gdf['e(0)'].notna().sum()} of {len(TRACTS_2010)} 2010 tracts have one")
print(f"life expectancy at birth: {cook['e(0)'].min():.1f} to {cook['e(0)'].max():.1f} years, median {cook['e(0)'].median():.1f}")
1200 Cook County estimates; 1200 of 1318 2010 tracts have one
life expectancy at birth: 59.9 to 90.0 years, median 78.5
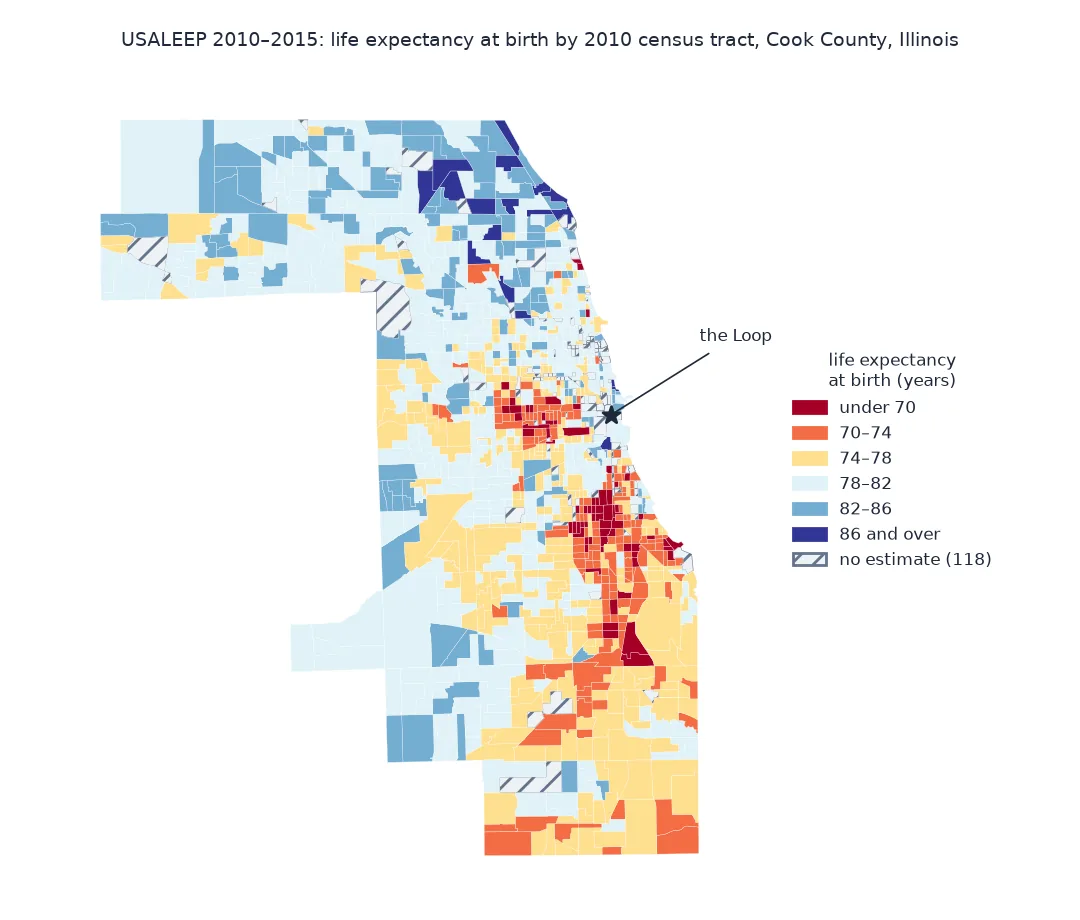
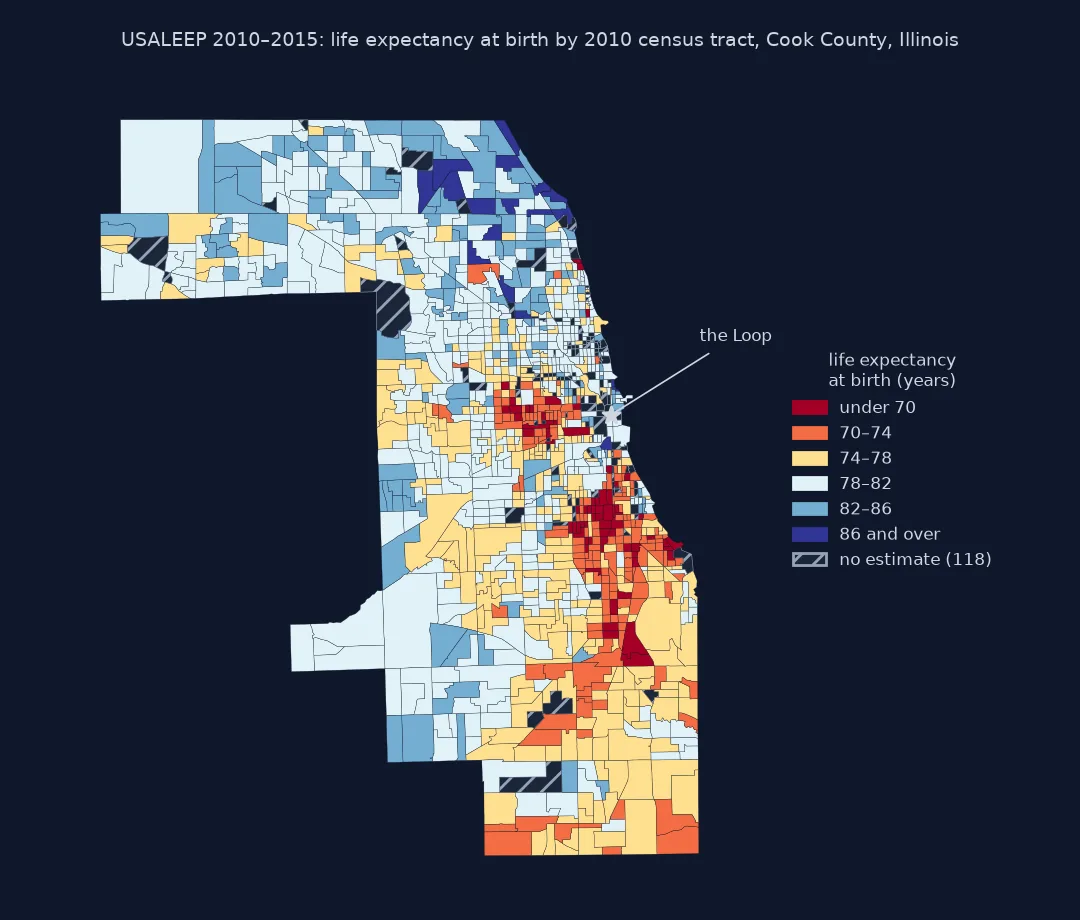
Keep leading zeros, use the estimates' own boundaries, read errors
1. Keep the leading zeros
A tract GEOID is 11 digits, starting with the two-digit state code. Read as a number, Alabama's 01001020100 becomes 1001020100, which matches nothing:
raw = pd.read_csv(USALEEP)
print(f"read as numbers, the first ID is {raw['Tract ID'].iloc[0]} ({len(str(raw['Tract ID'].iloc[0]))} digits); "
      f"IDs that are not 11 digits: {(raw['Tract ID'].astype(str).str.len() != 11).sum():,} of {len(raw):,}")
read as numbers, the first ID is 1001020100 (10 digits); IDs that are not 11 digits: 12,580 of 67,148
Cook County's IDs start with 17 and survive, but any national analysis loses every tract in states 01 to 09 unless the IDs are padded.
2. Use the boundaries the estimates were made for
USALEEP uses 2010 census tracts. Joined to 2020 tracts by ID, many match, but split and renumbered tracts do not:
t20 = gpd.read_file("data/cb_2023_17_tract_500k.zip").query("COUNTYFP == '031'")
print(f"2010 tracts with an estimate: {TRACTS_2010.GEOID.isin(cook.GEOID).sum()} of {len(TRACTS_2010)}; "
      f"2020 tracts matched by ID: {t20.GEOID.isin(cook.GEOID).sum()} of {len(t20)}")
2010 tracts with an estimate: 1200 of 1318; 2020 tracts matched by ID: 1175 of 1331
To show the estimates on current tracts, use the Census relationship file rather than the ID (see joining health data across tract vintages).
3. Read the standard errors
Each estimate comes from a few years of deaths in a few thousand people, so its standard error is often a year or more:
se = cook["se(e(0))"]
print(f"standard error: median {se.median():.1f} years, 90th percentile {se.quantile(0.9):.1f}")
lo, hi = cook.nsmallest(1, "e(0)").iloc[0], cook.nlargest(1, "e(0)").iloc[0]
print(f"lowest tract {lo['e(0)']:.1f} ± {1.96 * lo['se(e(0))']:.1f}; highest {hi['e(0)']:.1f} ± {1.96 * hi['se(e(0))']:.1f} (95% intervals)")
standard error: median 1.8 years, 90th percentile 3.0
lowest tract 59.9 ± 4.3; highest 90.0 ± 5.8 (95% intervals)
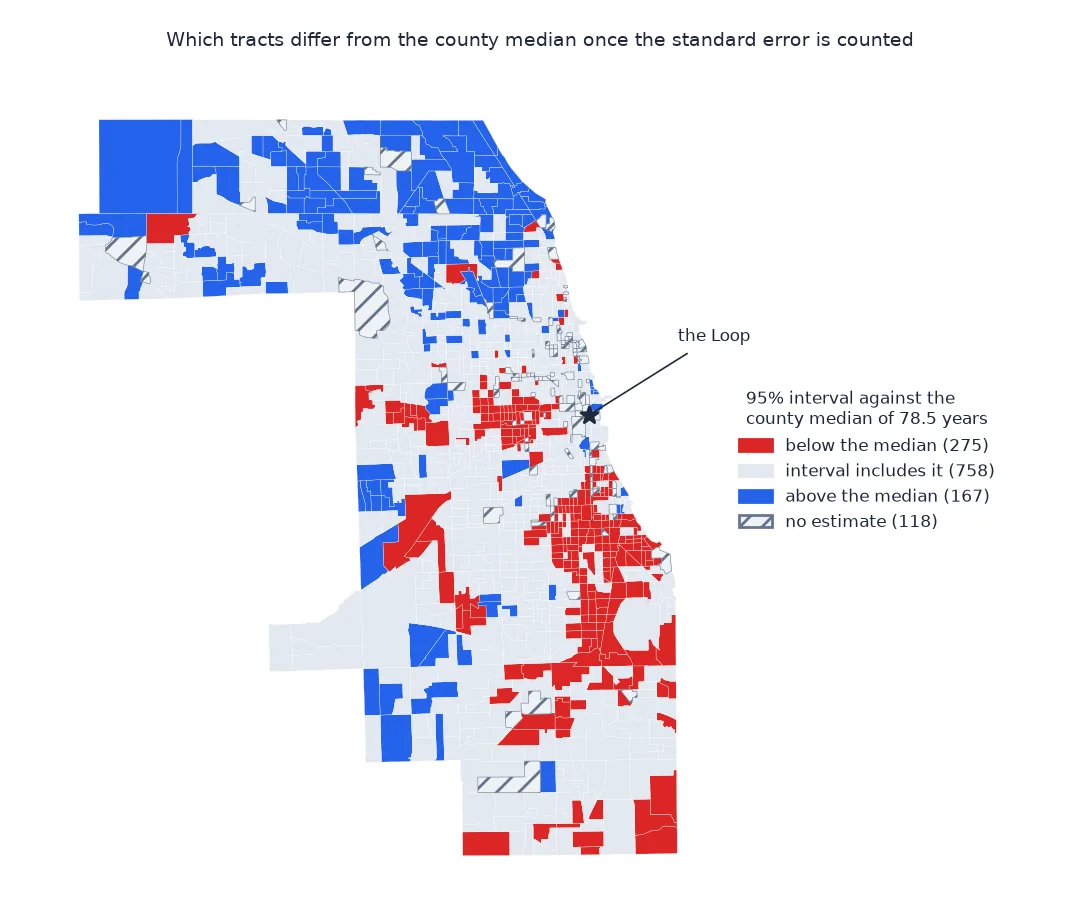
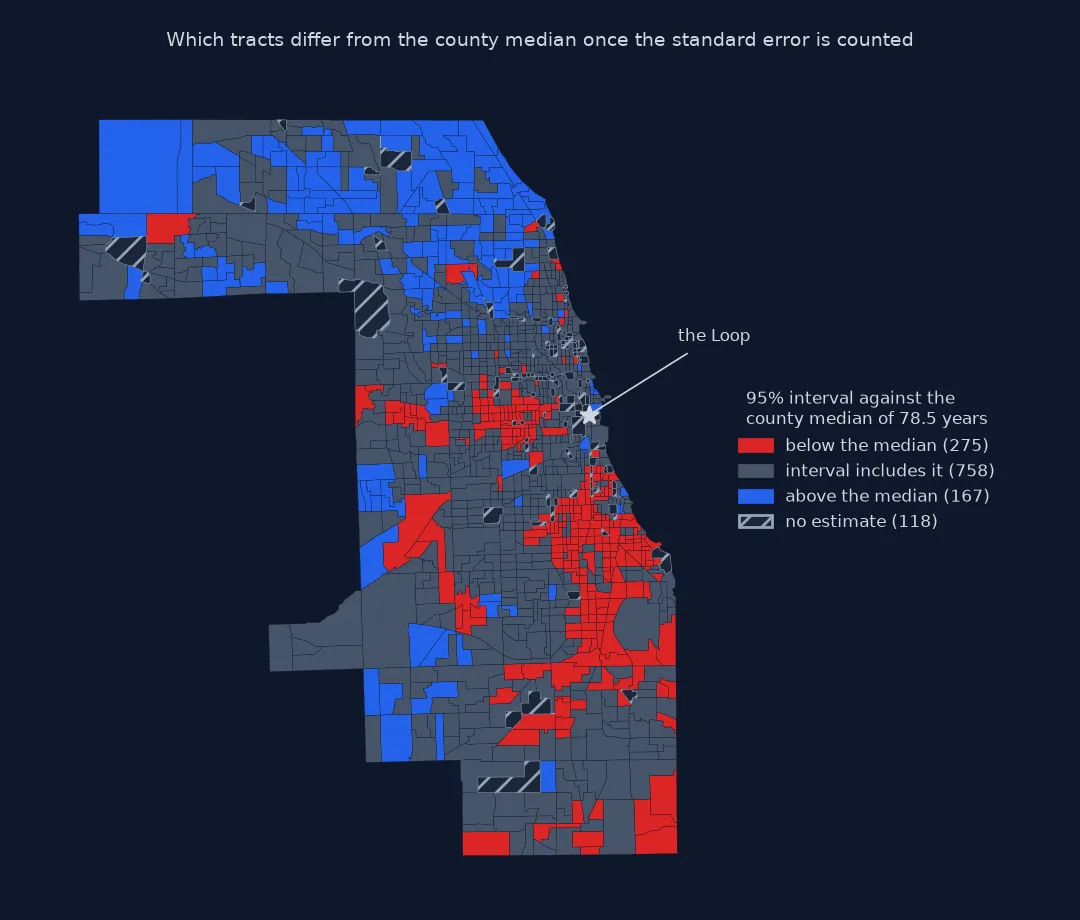
The gap between the longest- and shortest-lived tenths
The data used on this page
The US Small-Area Life Expectancy Estimates Project (NCHS, NAPHSIS and the Robert Wood Johnson Foundation), life expectancy at birth for 2010–2015 by 2010 census tract (US_A.CSV), and Census cartographic boundary files for Illinois tracts: 2019 (2010 vintage) and 2023 (2020 vintage).
from pathlib import Path

import geopandas as gpd
import numpy as np
import pandas as pd
import requests

Path("data").mkdir(exist_ok=True)
SRC = {"US_A.CSV": "https://ftp.cdc.gov/pub/Health_Statistics/NCHS/Datasets/NVSS/USALEEP/CSV/US_A.CSV",
       "cb_2019_17_tract_500k.zip": "https://www2.census.gov/geo/tiger/GENZ2019/shp/cb_2019_17_tract_500k.zip",
       "cb_2023_17_tract_500k.zip": "https://www2.census.gov/geo/tiger/GENZ2023/shp/cb_2023_17_tract_500k.zip"}
for name, url in SRC.items():
    if not Path("data", name).exists():
        Path("data", name).write_bytes(requests.get(url, timeout=300).content)
USALEEP = "data/US_A.CSV"
TRACTS_2010 = gpd.read_file("data/cb_2019_17_tract_500k.zip").query("COUNTYFP == '031'").to_crs(3435)
print(f"{len(TRACTS_2010)} Cook County tracts, 2010 vintage")
1318 Cook County tracts, 2010 vintage
Example 1: the gap between the longest- and shortest-lived tenths
q = cook["e(0)"].quantile([0.1, 0.9])
print(f"10th percentile {q[0.1]:.1f} years, 90th percentile {q[0.9]:.1f}; gap {q[0.9] - q[0.1]:.1f} years")
sig = ((cook["e(0)"] - cook["e(0)"].median()).abs() > 1.96 * cook["se(e(0))"]).mean()
print(f"tracts whose 95% interval excludes the county median: {sig:.0%}")
10th percentile 71.8 years, 90th percentile 82.7; gap 10.9 years
tracts whose 95% interval excludes the county median: 37%
Example 2: how much of each estimate was observed
The flag records where each tract's age-specific death rates came from: 1 observed for every age group, 2 predicted for every age group, 3 a mix:
flag = cook["Abridged life table flag"].map({1: "all observed", 2: "all predicted", 3: "observed and predicted"})
print(flag.value_counts().to_string())
print(cook.groupby(flag)["se(e(0))"].median().round(2).to_string())
Abridged life table flag
observed and predicted 922
all predicted 202
all observed 76
Abridged life table flag
all observed 1.90
all predicted 1.68
observed and predicted 1.84
Only 76 of the 1,200 Cook County estimates rest entirely on observed death rates. The standard errors are much the same in all three groups, so the flag tells you how much of an estimate came from a model, not how precise it is.
What life expectancy at birth means
Life expectancy at birth is the average number of years a newborn would live if it experienced, at every age, the death rates observed in the area over the period. It is a summary of current mortality, not a forecast for anyone born there, and it is independent of the area's age structure, which makes it comparable across tracts with very different populations. USALEEP built abridged life tables for each tract from deaths in 2010–2015 and population estimates. Where a tract had too few deaths in an age group to give a usable rate, the rate was predicted by a model instead of observed, and the file's flag says which tracts that applies to.
Two kinds of difference show up on a tract map. Large ones, such as the fifteen years and more between tracts on Chicago's West and South Sides and tracts on the northern lakefront and in the northern suburbs, are robust to the uncertainty: 275 tracts are clearly below the county median and 167 clearly above it. Small ones, between neighbouring tracts a year or two apart, are usually within the standard errors. Classing the map in wide intervals, or showing the standard error alongside, keeps readers from over-reading the small ones.
Missing tracts, periods and abridged tables
- Missing tracts: tracts with too few residents or deaths have no estimate; leave them blank.
- Period: estimates describe 2010–2015; neighbourhoods have changed since, and the data were not updated.
- Abridged life table flag: 1 means every age group's death rate was observed, 2 that every one was predicted, 3 a mix; most tracts are 3.
- Leading zeros: also affect county FIPS (5 digits) and state FIPS (2 digits) in any health dataset.
- Comparisons with PLACES: PLACES uses 2020 tracts and recent years; align vintages before combining.
Internal links
- How to join health data across tract vintages — 2010 estimates on 2020 tracts
- How to map CDC PLACES health estimates by census tract — current tract-level measures
FAQ
Where can I get life expectancy by census tract?
From USALEEP, published by NCHS: life expectancy at birth for 2010–2015 for most US census tracts, as CSV files.
Why do my USALEEP tract IDs not match the shapefile?
Either the IDs lost their leading zeros (read them as text and pad to 11 digits) or you are joining to 2020 tracts; USALEEP uses 2010 tracts.
How precise are tract-level life expectancy estimates?
In Cook County the median standard error is 1.8 years and one tract in ten has 3.0 or more, so neighbouring tracts a year apart are often not distinguishable.
Is there a newer tract-level life expectancy dataset?
USALEEP has not been updated beyond 2010–2015; county-level life expectancy is available for later years from other sources.