
Disease Clusters Explained
On this page
Problem statement
Health departments receive reports of suspected disease clusters every year: several cancers on one street, a run of birth defects in one town. Most turn out to be chance. The reason is not that people imagine them, but that random events are clumpy, small areas produce extreme rates from a handful of cases, and a cluster noticed first and tested afterwards is almost certain to look significant. A statistical cluster is real only if it survives a test that allows for all the places a cluster could have appeared, and even then it says where cases are concentrated, not why.
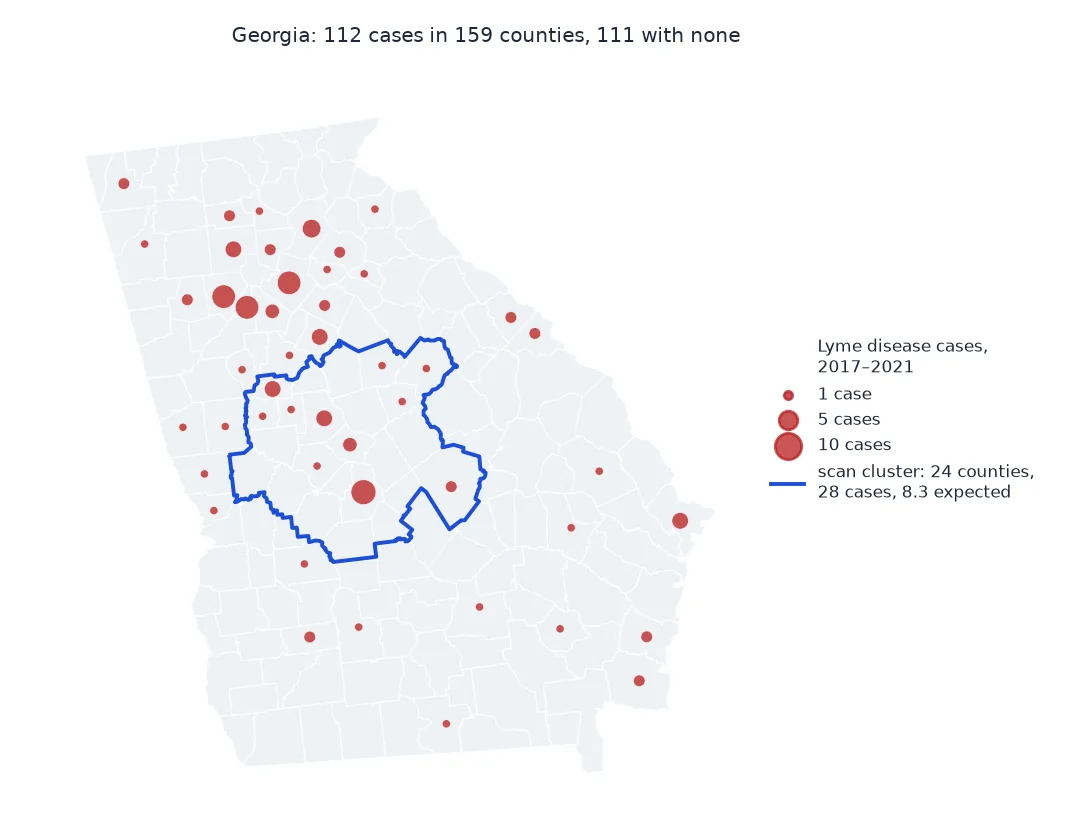
This page shows each of these effects with real surveillance data: Lyme disease cases in Georgia's 159 counties for 2017–2021, 112 cases in a state where the disease is rare.
Quick answer
Test every county on its own and compare the number flagged with the number expected by chance alone:
expected = CASES.sum() * POP / POP.sum()
p_each = poisson.sf(CASES - 1, expected)                       # P(at least this many cases)
flagged = (p_each < 0.05).sum()
rng = np.random.default_rng(0)
null = [(poisson.sf(rng.multinomial(int(CASES.sum()), POP / POP.sum()) - 1, expected) < 0.05).sum() for _ in range(1000)]
print(f"{len(CASES)} counties tested at p < 0.05: {flagged} flagged; random maps with the same cases flag {np.mean(null):.1f} on average "
      f"(90% of them between {np.percentile(null, 5):.0f} and {np.percentile(null, 95):.0f})")
159 counties tested at p < 0.05: 5 flagged; random maps with the same cases flag 3.1 on average (90% of them between 1 and 6)
A handful of cases, clusters found then tested, proper tests
1. A handful of cases decides the ranking
With 112 cases spread over 159 counties, the highest rates rest on one to four cases each, and one more or one fewer reorders the list:
rate = CASES / POP * 1e5
top = D.assign(rate=rate, cases=CASES, pop=POP / YEARS).nlargest(5, "rate")
print(top[["NAMELSAD", "cases", "pop", "rate"]].round(1).to_string(index=False))
print(f"cases behind the five highest rates: {top.cases.sum():.0f}; a single case in Hancock County is a rate of "
      f"{1 / (POP[D.NAMELSAD == 'Hancock County'][0]) * 1e5:.1f}, in Fulton County {1 / (POP[D.NAMELSAD == 'Fulton County'][0]) * 1e5:.2f}")
NAMELSAD cases pop rate
Monroe County 4.0 27957.0 2.9
Hancock County 1.0 8733.0 2.3
Crawford County 1.0 12126.0 1.6
Pickens County 2.0 33222.0 1.2
Spalding County 4.0 67301.0 1.2
cases behind the five highest rates: 12; a single case in Hancock County is a rate of 2.3, in Fulton County 0.02
2. A cluster found first and tested afterwards always passes
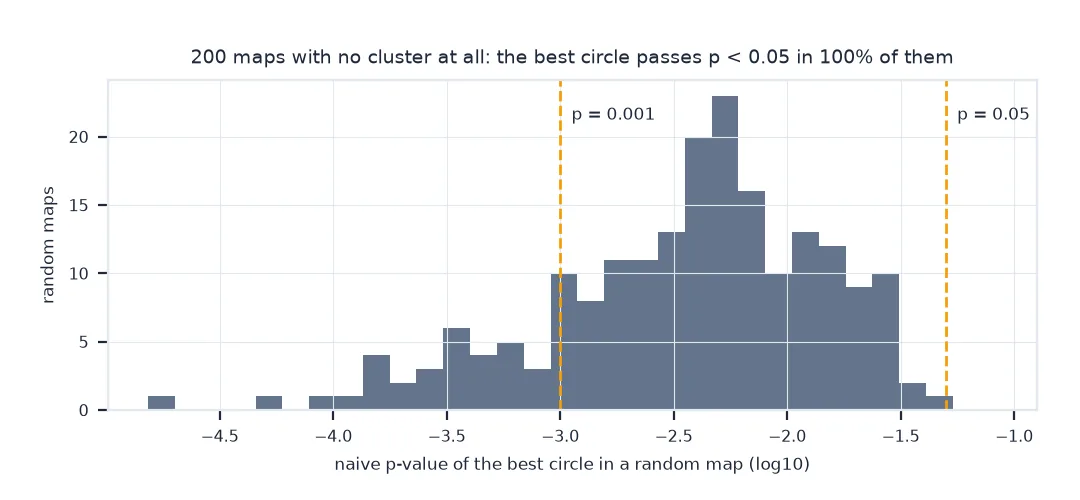
Take a random map, find its most unusual circle of counties, then test that circle as if it had been chosen in advance:
naive = []
for _ in range(200):
    sim = rng.multinomial(int(CASES.sum()), POP / POP.sum()).astype(float)
    _, c, s = scan(sim, POP, ORDER)
    m = ORDER[c][:s]
    naive.append(poisson.sf(sim[m].sum() - 1, sim.sum() * POP[m].sum() / POP.sum()))
naive = np.array(naive)
print(f"random maps whose best circle is 'significant' by a simple test: {(naive < 0.05).mean():.0%} at p < 0.05, "
      f"{(naive < 0.001).mean():.0%} at p < 0.001")
random maps whose best circle is 'significant' by a simple test: 100% at p < 0.05, 18% at p < 0.001
3. Test the search, not the cluster
The scan statistic repeats the search on every random map, so its p-value allows for having looked everywhere:
llr, centre, size = scan(CASES, POP, ORDER)
members = ORDER[centre][:size]
sims = np.array([scan(rng.multinomial(int(CASES.sum()), POP / POP.sum()).astype(float), POP, ORDER)[0] for _ in range(999)])
print(f"most likely cluster: {size} counties around {D.NAMELSAD.iloc[centre]}; {CASES[members].sum():.0f} cases against "
      f"{CASES.sum() * POP[members].sum() / POP.sum():.1f} expected; p = {(1 + (sims >= llr).sum()) / 1000:.3f}")
most likely cluster: 24 counties around Bibb County; 28 cases against 8.3 expected; p = 0.001
What a Lyme disease cluster is made of
The data used on this page
Lyme disease case counts by county from the CDC for 2017–2021, before the 2022 change in the surveillance case definition, with the Census Bureau's 2020 population estimates base and 2021 county boundaries. Georgia is classed in the file as a low-incidence state, where some reported cases are acquired elsewhere.
from pathlib import Path

import geopandas as gpd
import numpy as np
import pandas as pd
import requests
from scipy.stats import poisson

Path("data").mkdir(exist_ok=True)
SRC = {"LD_Case_Counts_by_County_2023.csv": "https://www.cdc.gov/lyme/media/files/2025/02/LD_Case_Counts_by_County_2023_updated.csv",
       "co-est2024-alldata.csv": "https://www2.census.gov/programs-surveys/popest/datasets/2020-2024/counties/totals/co-est2024-alldata.csv",
       "cb_2021_us_county_5m.zip": "https://www2.census.gov/geo/tiger/GENZ2021/shp/cb_2021_us_county_5m.zip"}
for name, url in SRC.items():
    if not Path("data", name).exists():
        Path("data", name).write_bytes(requests.get(url, timeout=300).content)

lyme = pd.read_csv("data/LD_Case_Counts_by_County_2023.csv", encoding="latin-1")
lyme["GEOID"] = lyme.stcode.astype(str).str.zfill(2) + lyme.ctycode.astype(str).str.zfill(3)
YEAR_COLS = ["Cases2017", "Cases2018", "Cases2019", "Cases2020", "cases2021"]
YEARS = len(YEAR_COLS)
lyme["cases"] = lyme[YEAR_COLS].sum(axis=1)
est = pd.read_csv("data/co-est2024-alldata.csv", encoding="latin-1", dtype={"STATE": str, "COUNTY": str}).query("SUMLEV == 50")
est["GEOID"] = est.STATE + est.COUNTY
D = (gpd.read_file("data/cb_2021_us_county_5m.zip").query("STATEFP == '13'").to_crs(5070)
       .merge(lyme[lyme.stname == "Georgia"][["GEOID", "cases"] + YEAR_COLS], on="GEOID")
       .merge(est[["GEOID", "ESTIMATESBASE2020"]], on="GEOID"))
CASES = D.cases.to_numpy(float)
POP = D.ESTIMATESBASE2020.to_numpy(float) * YEARS                         # person-years
xy = np.column_stack([D.centroid.x, D.centroid.y])
ORDER = np.argsort(np.linalg.norm(xy[:, None] - xy[None], axis=2), axis=1)

def scan(cases, pop, order, max_share=0.5):
    C, P = cases.sum(), pop.sum()
    best = (0.0, None, None)
    for i in range(len(pop)):
        cp, cc = np.cumsum(pop[order[i]]), np.cumsum(cases[order[i]])
        k = np.searchsorted(cp, max_share * P, side="right")
        if k == 0:
            continue
        E = C * cp[:k] / P
        with np.errstate(divide="ignore", invalid="ignore"):
            llr = np.where(cc[:k] > E, cc[:k] * np.log(cc[:k] / E) + (C - cc[:k]) * np.log((C - cc[:k]) / (C - E)), 0.0)
        j = int(np.nanargmax(llr))
        if llr[j] > best[0]:
            best = (float(llr[j]), i, j + 1)
    return best

print(f"Georgia: {len(D)} counties, {CASES.sum():.0f} cases in {YEARS} years; counties with none: {(CASES == 0).sum()}")
Georgia: 159 counties, 112 cases in 5 years; counties with none: 111
Example 1: what the cluster is made of
A statistical cluster is a starting point for questions. One is whether it is steady over time or a single year's burst, which can point to a change in reporting:
print(D.iloc[members][YEAR_COLS].sum().rename(lambda c: c[-4:]).to_string())
print(f"share of the cluster's cases in its largest county ({D.NAMELSAD.iloc[members].iloc[np.argmax(CASES[members])]}): "
      f"{CASES[members].max() / CASES[members].sum():.0%}")
2017 1.0
2018 3.0
2019 1.0
2020 14.0
2021 9.0
share of the cluster's cases in its largest county (Houston County): 32%
Twenty-three of the cluster's 28 cases were reported in 2020 and 2021, after three years with one to three a year. A burst like that is what a real change in transmission would produce, and also what a new laboratory, a new clinician or a change in how a health district reports would produce. The data cannot separate them; a phone call can.
Why chance clusters are common
Three mechanisms make chance clusters common. Random events clump: scatter cases at random and some neighbourhoods get several, by chance alone, more often than intuition expects. Small denominators exaggerate: one case in a county of 2,000 people is a rate fifty times that of a county of 100,000 with the same single case. And the search is invisible: a cluster is usually noticed because it looks unusual, and then the same cases are used to test it, which is the Texas sharpshooter's method of firing at a barn and painting the target around the tightest group of holes.
A valid test has to include the search. The spatial scan statistic does it by repeating the whole search on maps where the null hypothesis is true, so that a cluster is significant only if it is more extreme than the most extreme cluster of random maps. Even then, a significant cluster is a statement about where cases were reported. For Lyme disease in Georgia, where the CDC classes incidence as low and some patients are infected while travelling, a concentration of reports may reflect where people travel from, where clinicians test, or how a health district reports, as well as where ticks transmit infection. The scan cannot tell these apart; investigation can.
Pre-specified hypotheses and investigation
- Pre-specified hypotheses: a test of an area chosen before looking at the data, such as a town near a known source, needs no correction for the search.
- Multiple tests: with many areas tested separately, expect about 5% to pass at p < 0.05 by chance; count them before believing them.
- Time: space-time scans look for clusters in both, and need the same correction.
- Reporting: surveillance counts record diagnosis and report, not infection; changes in either create clusters.
- Investigation: CDC guidance on investigating suspected cancer clusters starts by asking whether the cases are of the same type and could share a cause, before any statistics.
Internal links
- How to find disease clusters with a spatial scan statistic — the method, applied to Virginia
- Small area rates explained — why small denominators mislead
FAQ
What is a disease cluster?
An unusual concentration of cases of a disease in a place and time, beyond what the population would lead you to expect.
Why are most suspected disease clusters not real?
Random cases clump, small areas give extreme rates, and testing a cluster with the same data that drew attention to it makes almost any group look significant.
What is the Texas sharpshooter fallacy?
Drawing the target after the shots: defining a cluster's boundaries around observed cases and then treating the concentration as evidence.
How do I test whether a cluster is real?
Use a method that accounts for the search, such as the spatial scan statistic with Monte Carlo testing, or test an area defined before the data were seen.