
How to Make a Time-Slider Web Map in Python
On this page
Problem statement
An animation plays at its own pace. A time slider lets the reader stop, step back and look at one moment for as long as they like, and in a web map they can also zoom and click. folium's TimestampedGeoJson builds one from Python: each GeoJSON feature carries a time, and a Leaflet plugin adds a slider and play button. Three things decide whether the slider tells the truth. The first is how long each feature stays visible. The second is where the slider's steps fall. The third is whether the browser really shows what the data says it should, and that last one can be tested.
This page builds a slider map of the 1,052 magnitude 3 and larger earthquakes in the July 2019 Ridgecrest sequence. It then opens the map in a headless browser, moves the slider, and counts the markers on screen against pandas.
Quick answer
Give every feature a time property in ISO 8601 UTC, then set the slider step (period) and how long each feature stays on (duration):
features = [{"type": "Feature",
             "geometry": {"type": "Point", "coordinates": [r.longitude, r.latitude]},
             "properties": {"time": r.time.strftime("%Y-%m-%dT%H:%M:%SZ"), "icon": "circle",
                            "iconstyle": {"radius": 2 + 1.5 * (r.mag - 3), "fillColor": "#d7301f", "fillOpacity": 0.7, "stroke": False},
                            "popup": f"M{r.mag} {r.time:%d %b %H:%M} UTC"}}
            for r in q3.itertuples()]
m = folium.Map(location=[35.75, -117.6], zoom_start=9, tiles="OpenStreetMap")
TimestampedGeoJson({"type": "FeatureCollection", "features": features},
                   period="PT6H", duration="P1D", add_last_point=False, auto_play=False).add_to(m)
m.save("data/ridgecrest_slider.html")
print(f"{len(features):,} features, {Path('data/ridgecrest_slider.html').stat().st_size / 1e3:,.0f} kB of HTML")
1,052 features, 314 kB of HTML
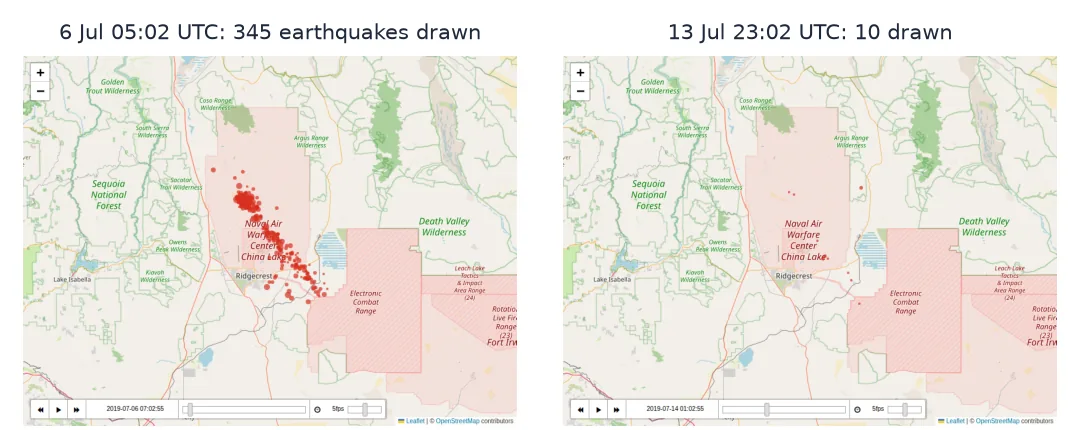
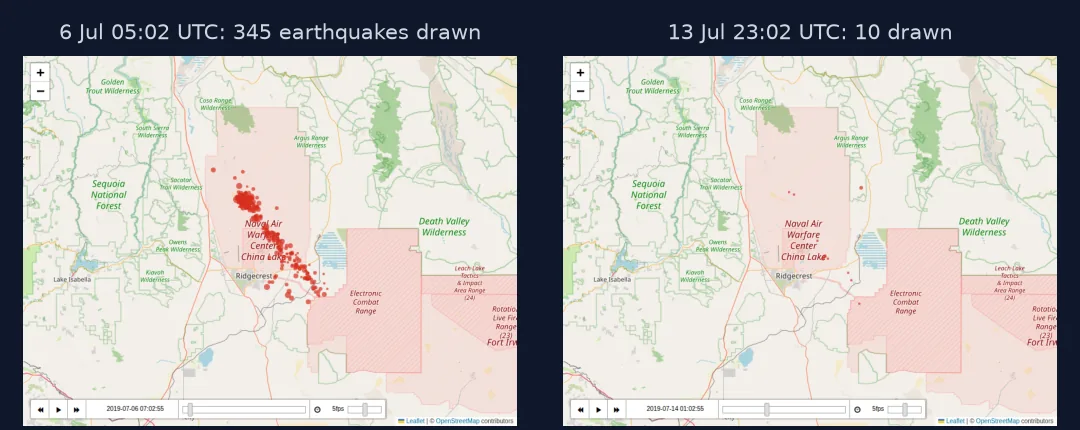
How long features stay on, where steps fall, test in a browser
1. Decide how long a feature stays on
duration is an ISO 8601 period. With P1D each earthquake shows for one day after its time and then disappears. Without it, features stay on from their time onwards, so the map accumulates. Count what each choice shows at one moment:
t = pd.Timestamp("2019-07-06T05:02:55Z")
window = q3[(q3.time > t - pd.Timedelta("1D")) & (q3.time <= t)]
so_far = q3[q3.time <= t]
print(f"at {t:%d %b %H:%M} UTC: duration P1D shows {len(window)}, no duration shows {len(so_far)}")
m_all = folium.Map(location=[35.75, -117.6], zoom_start=9, tiles="OpenStreetMap")
TimestampedGeoJson({"type": "FeatureCollection", "features": features},
                   period="PT6H", add_last_point=False, auto_play=False).add_to(m_all)  # no duration: cumulative
m_all.save("data/ridgecrest_slider_cumulative.html")
at 06 Jul 05:02 UTC: duration P1D shows 345, no duration shows 464
A one-day window shows the sequence's current activity; the cumulative view shows the whole sequence so far. Step 3 checks both counts in a browser. Pick the one the reader needs and say so in the map's title.
2. Know where the slider's steps fall
The plugin builds its list of times from the features themselves, starting at the earliest one and stepping by period until it passes the last. Rebuild that list in pandas:
first = q3.time.min().floor("s")
steps = pd.date_range(first, q3.time.max() + pd.Timedelta("6h"), freq="6h")
print(f"first event {first:%d %b %H:%M:%S} UTC -> {len(steps)} slider steps at {', '.join(f'{s:%H:%M:%S}' for s in steps[:4])} ...")
first event 04 Jul 17:02:55 UTC -> 105 slider steps at 17:02:55, 23:02:55, 05:02:55, 11:02:55 ...
The steps land at 17:02:55, 23:02:55 and so on, because the first earthquake struck at 17:02:55 UTC. To put them on round hours, bin each feature's time to the period, and keep the exact time in the popup:
binned = [dict(f, properties=dict(f["properties"], time=pd.Timestamp(f["properties"]["time"]).floor("6h").strftime("%Y-%m-%dT%H:%M:%SZ")))
          for f in features]
m2 = folium.Map(location=[35.75, -117.6], zoom_start=9, tiles="OpenStreetMap")
TimestampedGeoJson({"type": "FeatureCollection", "features": binned},
                   period="PT6H", duration="P1D", add_last_point=False, auto_play=False).add_to(m2)
m2.save("data/ridgecrest_slider_binned.html")
print("first binned step:", binned[0]["properties"]["time"])
first binned step: 2019-07-04T12:00:00Z
3. Test the map in a browser
The HTML is only correct if the browser shows the right markers at each step. Open it in headless Chromium, set the slider with the plugin's own API, and count the circles Leaflet drew:
from playwright.sync_api import sync_playwright

checks = ["2019-07-04T23:02:55Z", "2019-07-06T05:02:55Z", "2019-07-13T23:02:55Z"]
with sync_playwright() as p:
    browser = p.chromium.launch()
    page = browser.new_page(viewport={"width": 800, "height": 600})
    page.goto(Path("data/ridgecrest_slider.html").resolve().as_uri()); page.wait_for_timeout(4000)
    name = page.evaluate("Object.keys(window).find(k => k.startsWith('map_'))")
    print("slider steps in the browser:", page.evaluate(f"{name}.timeDimension.getAvailableTimes().length"))
    for i, ts in enumerate(checks):
        page.evaluate(f"{name}.timeDimension.setCurrentTime(Date.parse('{ts}'))"); page.wait_for_timeout(1500)
        drawn = page.evaluate("document.querySelectorAll('.leaflet-overlay-pane path').length")
        t = pd.Timestamp(ts)
        expected = ((q3.time > t - pd.Timedelta("1D")) & (q3.time <= t)).sum()
        print(f"{t:%d %b %H:%M} UTC: browser drew {drawn}, pandas expects {expected}")
        page.screenshot(path=f"data/slider_{i}.png")
    page.goto(Path("data/ridgecrest_slider_cumulative.html").resolve().as_uri()); page.wait_for_timeout(4000)
    name = page.evaluate("Object.keys(window).find(k => k.startsWith('map_'))")
    page.evaluate(f"{name}.timeDimension.setCurrentTime(Date.parse('{checks[1]}'))"); page.wait_for_timeout(1500)
    drawn = page.evaluate("document.querySelectorAll('.leaflet-overlay-pane path').length")
    print(f"cumulative map at {checks[1][:16]}: browser drew {drawn}, pandas expects {(q3.time <= pd.Timestamp(checks[1])).sum()}")
    browser.close()
slider steps in the browser: 105
04 Jul 23:02 UTC: browser drew 99, pandas expects 99
06 Jul 05:02 UTC: browser drew 345, pandas expects 345
13 Jul 23:02 UTC: browser drew 10, pandas expects 10
cumulative map at 2019-07-06T05:02: browser drew 464, pandas expects 464
4. Know where the bytes go
TimestampedGeoJson writes every feature, with its own style, into the HTML. Measure which parts cost the most before trimming anything:
size = lambda fs: len(json.dumps({"type": "FeatureCollection", "features": fs})) / 1e3
parts = {"as built": features,
         "without popups": [dict(f, properties={k: v for k, v in f["properties"].items() if k != "popup"}) for f in features],
         "coordinates and radius rounded": [dict(f, geometry={"type": "Point", "coordinates": [round(c, 4) for c in f["geometry"]["coordinates"]]},
                                                 properties=dict(f["properties"], iconstyle=dict(f["properties"]["iconstyle"], radius=round(f["properties"]["iconstyle"]["radius"], 1))))
                                            for f in features]}
for label, fs in parts.items():
    print(f"{label:32s}: {size(fs):5.0f} kB ({size(fs) / len(fs) * 1000:.0f} bytes per feature)")
print("style object alone:", len(json.dumps(features[0]["properties"]["iconstyle"])), "bytes, repeated in every feature")
as built : 307 kB (292 bytes per feature)
without popups : 270 kB (257 bytes per feature)
coordinates and radius rounded : 295 kB (281 bytes per feature)
style object alone: 91 bytes, repeated in every feature
The style object is almost a third of every feature, and the popups another eighth; rounding numbers saves 4%. A thousand features make a 300 kB page, which is fine. Ten thousand would make a 3 MB one.
A legend and title for the slider map
The data used on this page
Earthquakes of magnitude 3 and above from the USGS ComCat catalogue for the Ridgecrest area (35.3–36.2° N, 118.0–117.2° W) in July 2019; basemap tiles from OpenStreetMap.
import json
from pathlib import Path

import folium
import pandas as pd
import requests
from folium.plugins import TimestampedGeoJson

Path("data").mkdir(exist_ok=True)
CAT = Path("data/ridgecrest_2019.csv")
if not CAT.exists():
    params = dict(format="csv", starttime="2019-07-01", endtime="2019-08-01", minlatitude=35.3, maxlatitude=36.2,
                  minlongitude=-118.0, maxlongitude=-117.2, minmagnitude=2.5, orderby="time-asc")
    CAT.write_text(requests.get("https://earthquake.usgs.gov/fdsnws/event/1/query", params=params, timeout=120).text)
q = pd.read_csv(CAT)
q["time"] = pd.to_datetime(q.time, utc=True)
q3 = q[(q.type == "earthquake") & (q.mag >= 3)].reset_index(drop=True)
q3["time"] = q3.time.dt.floor("s")                   # the slider works in whole seconds, as the features will
print(f"{len(q3):,} earthquakes of M3 or more, {q3.time.min():%d %b %H:%M} to {q3.time.max():%d %b %H:%M} UTC")
1,052 earthquakes of M3 or more, 04 Jul 17:02 to 30 Jul 16:30 UTC
Example 1: add a legend and title
title = ("<div style='position:fixed;top:10px;left:50px;z-index:9999;background:white;padding:6px 10px;"
         "font:14px sans-serif;border-radius:4px'>Ridgecrest 2019, M3+ earthquakes in the past 24 hours (UTC)</div>")
m.get_root().html.add_child(folium.Element(title))
m.save("data/ridgecrest_slider.html")
print("title added:", "past 24 hours" in Path("data/ridgecrest_slider.html").read_text())
title added: True
A time slider is an animation the reader controls
A time slider is an animation the reader controls, built from three settings. time on each feature says when it happens. duration says how long it stays visible, which decides whether the map shows the present or the history. period says how far each click moves, and the plugin anchors those steps at the earliest feature. Each setting changes what the map claims, so each belongs in the title or legend.
Testing in a real browser closes the loop. The page is generated by Python but rendered by JavaScript, and a wrong time format, a missing Z or an off-by-one window would all produce a map that looks plausible. Counting markers in headless Chromium against the same window in pandas turns "it looks right" into a check that can run every time the page is rebuilt.
Time zones, polygons and large datasets
- Time zones: write times in UTC with a trailing
Z; the slider label shows them in the browser's local zone unless told otherwise. - Lines and polygons take a
timeslist in their properties (one per coordinate for lines), so a track can grow vertex by vertex. - Large datasets make heavy HTML, about 290 bytes per feature here; above a few thousand features, serve vector tiles and filter by time in MapLibre instead.
- Tiles come from a third-party server; respect its usage policy, and use your own tiles for heavy traffic.
add_last_pointdraws an extra marker at the end of each line; turn it off for point data.
Internal links
- How to animate an earthquake sequence — the same catalogue as a video
- How to export a map animation — when a file is better than a slider
FAQ
How do I add a time slider to a folium map?
Use folium.plugins.TimestampedGeoJson with a FeatureCollection whose features each have a time property, and set period (the slider step) and duration (how long each feature stays visible).
Why are my time slider steps at odd times?
The steps start at the earliest feature and advance by period. Bin feature times to the period to put them on round hours.
How can I test a folium map automatically?
Open the saved HTML in headless Chromium with Playwright, drive the map through its JavaScript API, and count the drawn elements against the data.
Should features accumulate or fade?
Use duration for a moving window of recent events and no duration for a cumulative map. State which in the title.