
How to Download and Map City Crime Data in Python
On this page
Problem statement
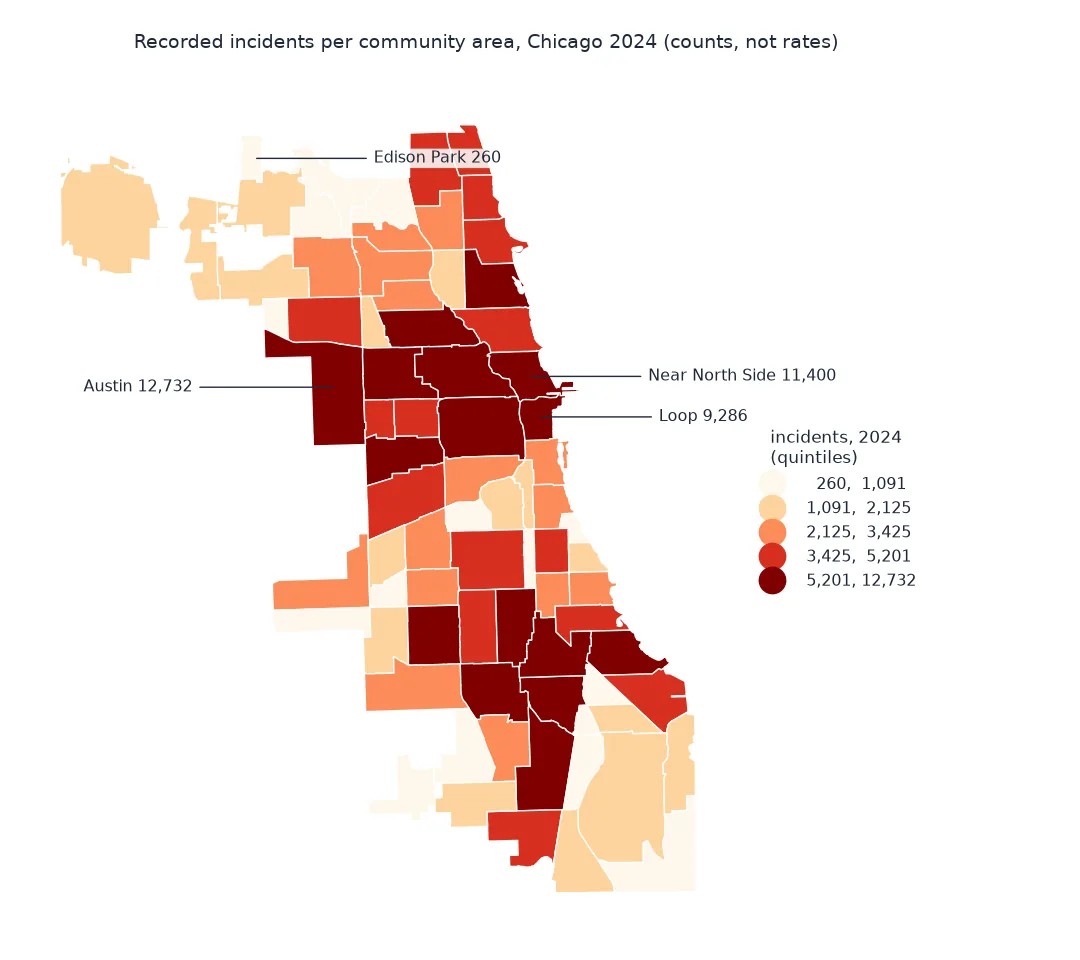
Many large cities publish their recorded crime as open data, usually through a Socrata or ArcGIS portal: one row per incident, with a date, an offence type, a block-level address and coordinates. Chicago's dataset is one of the largest, every reported incident since 2001, and a good model for the rest. Getting from the portal to a map takes paging through the API, keeping the columns you need, and checking what the coordinates do and do not cover before counting anything by area.
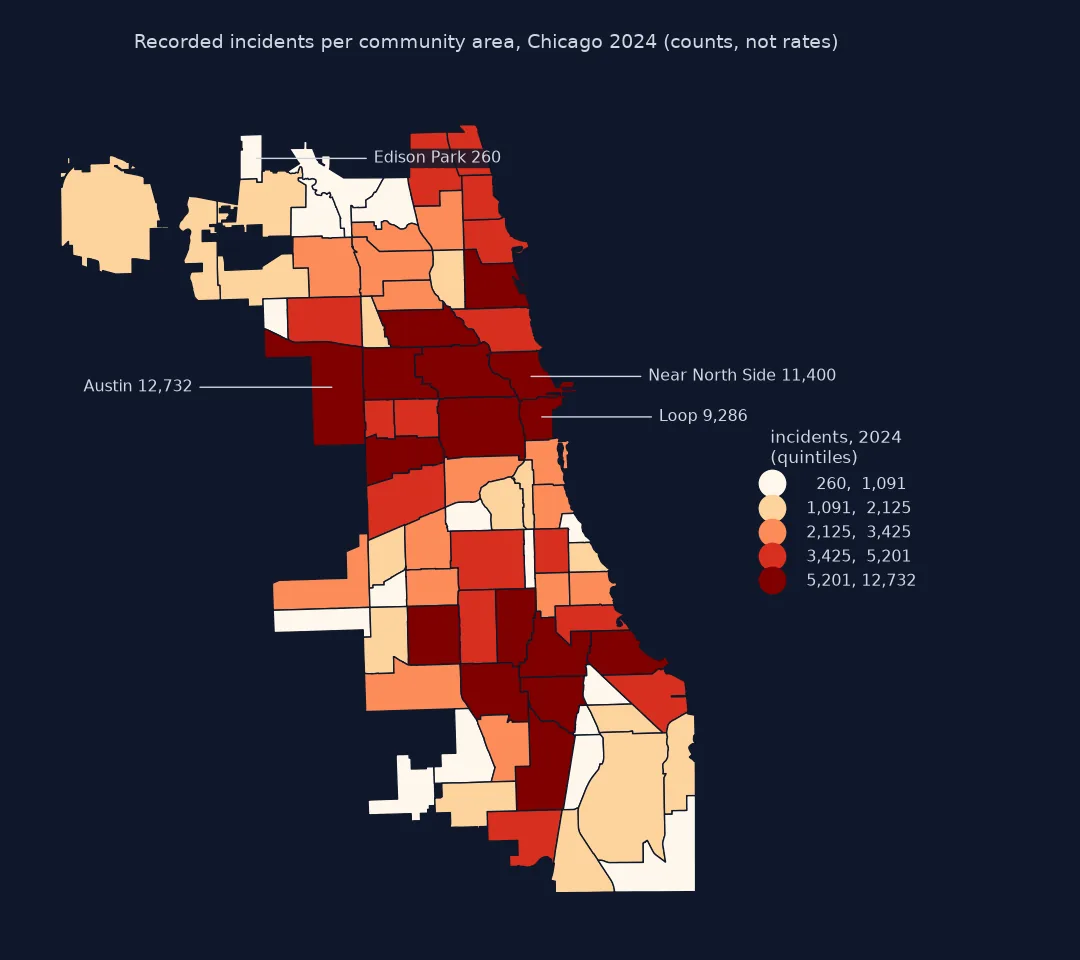
This page downloads every incident recorded in Chicago in 2024 through the Socrata API, summarises it by offence type, counts incidents in the city's 77 community areas, and measures how many records have no location.
Quick answer
Page through the API with $limit, $offset and a stable $order, then count:
def socrata(where, select, page=50_000):
    rows, offset = [], 0
    while True:
        part = requests.get(URL, timeout=300, params={"$where": where, "$select": select,
                                                     "$limit": page, "$offset": offset, "$order": "id"}).json()
        rows += part
        offset += len(part)
        if len(part) < page:
            return pd.DataFrame(rows)

print(f"{len(CRIMES):,} incidents recorded in 2024")
print(CRIMES.primary_type.value_counts().head(6).to_string())
print(f"without coordinates: {CRIMES.latitude.isna().sum():,} ({CRIMES.latitude.isna().mean():.1%})")
259,638 incidents recorded in 2024
primary_type
THEFT 60559
BATTERY 46187
CRIMINAL DAMAGE 28557
ASSAULT 23488
MOTOR VEHICLE THEFT 21713
OTHER OFFENSE 17169
without coordinates: 2,114 (0.8%)
Read the dataset's description, make points, count by area
1. Read the dataset's own description
The portal's description is part of the data. Chicago's says that addresses are given at block level, that the most recent seven days are withheld, and that classifications can change after investigation:
meta = requests.get("https://data.cityofchicago.org/api/views/ijzp-q8t2.json", timeout=60).json()
for phrase in ("block level", "most recent seven days", "may be changed at a later date", "comparison purposes over time"):
    print(f"'{phrase}': {'yes' if phrase in meta['description'] else 'no'}")
print(f"last updated: {pd.Timestamp(meta['rowsUpdatedAt'], unit='s'):%Y-%m-%d}")
'block level': yes
'most recent seven days': yes
'may be changed at a later date': yes
'comparison purposes over time': yes
last updated: 2026-10-01
2. Turn the rows into points
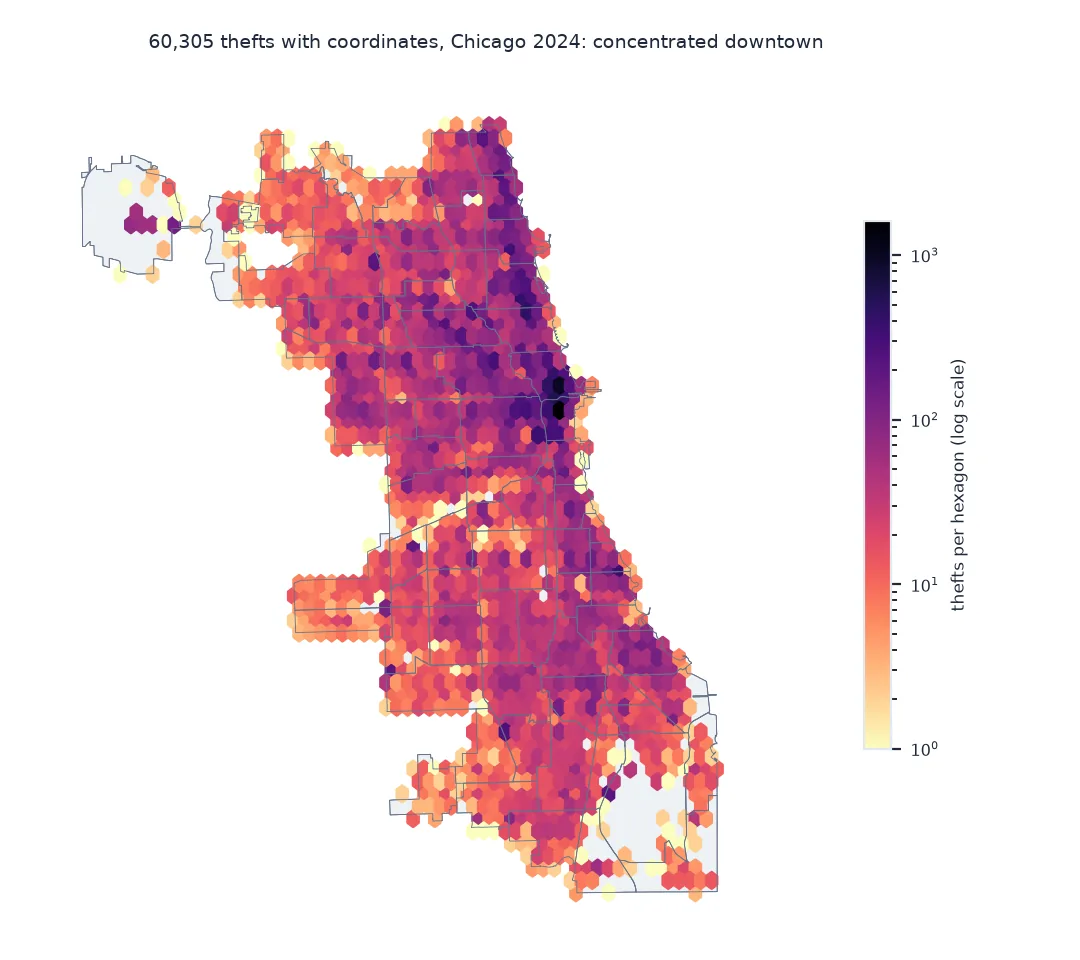
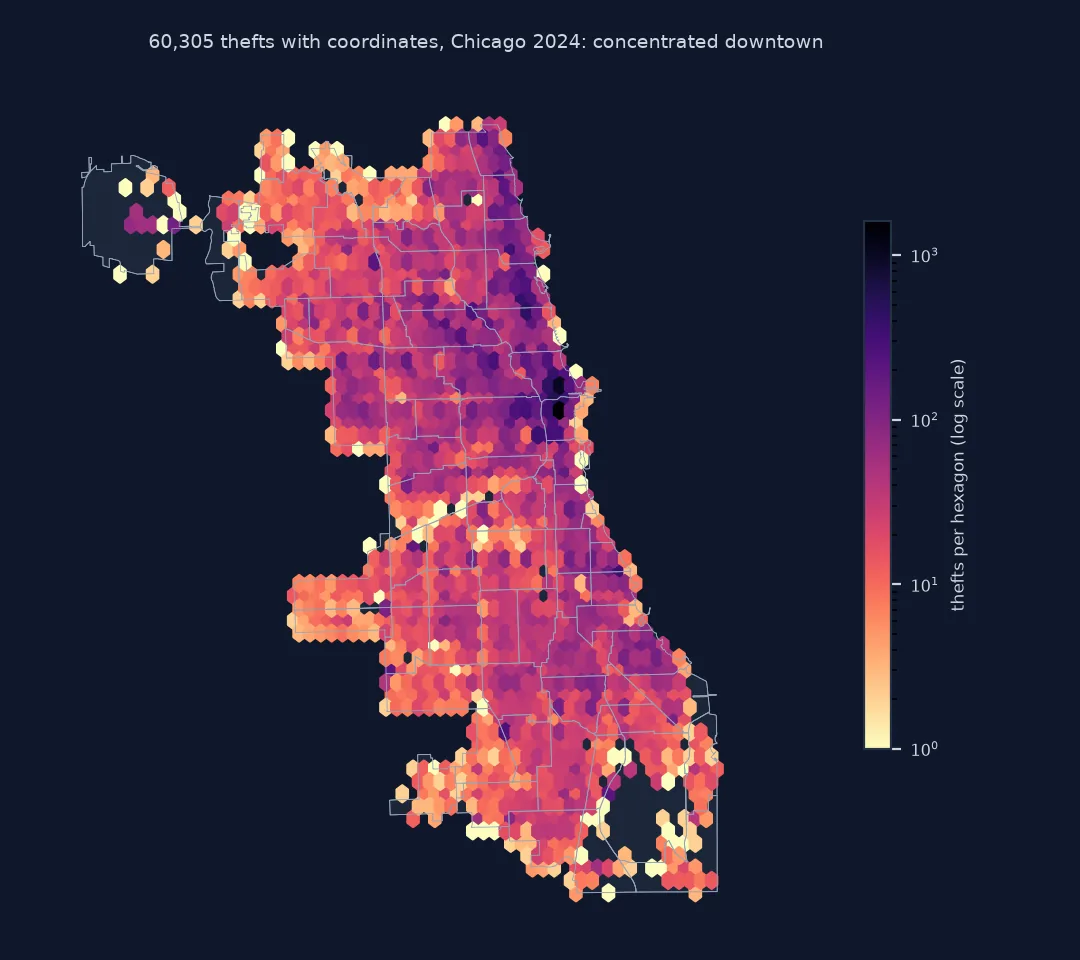
Coordinates come as strings. Records without them are not errors to delete silently; count them first, by type, because they are not spread evenly:
pts = CRIMES.dropna(subset=["latitude", "longitude"]).astype({"latitude": float, "longitude": float})
pts = gpd.GeoDataFrame(pts, geometry=gpd.points_from_xy(pts.longitude, pts.latitude), crs=4326)
missing = CRIMES[CRIMES.latitude.isna()].primary_type.value_counts()
share = (missing / CRIMES.primary_type.value_counts()).dropna().sort_values(ascending=False)
print(f"{len(pts):,} points; types most often without a location:")
print(share.head(4).map("{:.0%}".format).to_string())
257,524 points; types most often without a location:
primary_type
HUMAN TRAFFICKING 17%
CRIMINAL SEXUAL ASSAULT 10%
OFFENSE INVOLVING CHILDREN 8%
SEX OFFENSE 7%
3. Count by community area
The records carry a community area number, but it is worth checking it against a spatial join with the official boundaries:
joined = gpd.sjoin(pts, CA[["area_numbe", "community", "geometry"]], predicate="within", how="left")
agree = (joined.community_area.astype("Int64") == joined.area_numbe.astype("Int64")).mean()
counts = joined.groupby("community").size().sort_values(ascending=False)
print(f"recorded community area matches the spatial join for {agree:.1%} of points")
print(counts.head(5).to_string())
recorded community area matches the spatial join for 97.6% of points
community
AUSTIN 12732
NEAR NORTH SIDE 11400
NEAR WEST SIDE 10943
LOOP 9286
SOUTH SHORE 8518
Arrests and domestic incidents in Chicago
The data used on this page
The City of Chicago's Crimes - 2001 to Present dataset (ijzp-q8t2), from the Chicago Police Department's CLEAR system, for incidents dated 2024, and the city's community area boundaries.
from pathlib import Path

import geopandas as gpd
import pandas as pd
import requests

Path("data").mkdir(exist_ok=True)
URL = "https://data.cityofchicago.org/resource/ijzp-q8t2.json"
F = Path("data/chicago_crimes_2024.parquet")
if not F.exists():
    rows, offset = [], 0
    while True:
        part = requests.get(URL, timeout=300, params={
            "$where": "year=2024", "$limit": 50_000, "$offset": offset, "$order": "id",
            "$select": "id,date,primary_type,arrest,domestic,community_area,latitude,longitude,location_description,block,updated_on"}).json()
        rows += part; offset += len(part)
        if len(part) < 50_000:
            break
    pd.DataFrame(rows).to_parquet(F)
CRIMES = pd.read_parquet(F)
G = Path("data/chicago_community_areas.geojson")
if not G.exists():
    G.write_bytes(requests.get("https://data.cityofchicago.org/resource/igwz-8jzy.geojson?$limit=100", timeout=120).content)
CA = gpd.read_file(G)
print(f"{len(CRIMES):,} rows, {CRIMES.columns.size} columns; {len(CA)} community areas")
259,638 rows, 11 columns; 77 community areas
Example 1: arrests and domestic incidents
for col in ("arrest", "domestic"):
    print(f"{col}: {CRIMES[col].astype(bool).mean():.1%} of incidents")
by_type = CRIMES.assign(arrest=CRIMES.arrest.astype(bool)).groupby("primary_type").arrest.agg(["mean", "size"])
print(by_type[by_type["size"] > 5000].sort_values("mean").round(3).to_string())
arrest: 13.8% of incidents
domestic: 18.4% of incidents
mean size
primary_type
MOTOR VEHICLE THEFT 0.028 21713
DECEPTIVE PRACTICE 0.033 16462
CRIMINAL DAMAGE 0.039 28557
BURGLARY 0.055 8437
THEFT 0.068 60559
ROBBERY 0.083 9120
ASSAULT 0.108 23488
BATTERY 0.171 46187
OTHER OFFENSE 0.192 17169
WEAPONS VIOLATION 0.613 7841
NARCOTICS 0.963 5998
Arrest shares range from 3% for motor vehicle theft to 96% for narcotics. Narcotics offences are recorded almost only when police find them, which is why their map is partly a map of policing.
What a city crime dataset records
A city crime dataset is a record of what police were told about or found, classified by an officer, located to a block, and published with a delay. Each of those steps shapes the map. Offences that are rarely reported, such as many frauds, or that are discovered mainly through policing, such as drug offences, appear where reporting and patrols are, not only where they happen. Locations are moved to the block level to protect victims, and some offences are published with no location at all.
None of this makes the data unusable; it makes the description part of the method. A count by area is a count of recorded incidents with coordinates, in the classifications current at download time. Saying so, and keeping the download date, lets the next analysis reproduce or explain differences.
Socrata limits, homicides and the seven-day lag
- Socrata limits: page in 50,000-row chunks and order by
idso pages do not overlap. - Types as strings:
arrestanddomesticarrive as booleans in JSON; latitude and longitude as strings. - Homicides: the crimes table has one row per incident; the city's separate violence dataset has one row per victim.
- Seven-day lag: recent counts are incomplete; leave the last weeks out of trends.
- Other cities: field names differ, but the same checks apply: description, missing locations, area codes against boundaries.
Internal links
- How to aggregate tract health estimates to neighbourhoods — Chicago's community areas
- How to make a kernel density map of disease cases — density surfaces from points
FAQ
How do I download Chicago crime data in Python?
Query https://data.cityofchicago.org/resource/ijzp-q8t2.json with Socrata parameters, paging with $limit, $offset and $order=id, and build a DataFrame.
Why do some crime records have no coordinates?
Some offences are published without a location to protect victims, and some reports cannot be located; in Chicago's 2024 data it is under 1% overall but much higher for some types.
Are crime locations exact?
No; Chicago publishes them at the block level, and maps should be treated as approximate.
Can I compare crime counts between years?
With care: classifications change after investigation, and the police department warns against using the data for comparisons over time.