
Why Are Coordinates Missing from My Crime Data?
On this page
Problem statement
You download a city's recent crime records to map them, convert latitude and longitude to points, and most of the rows disappear. Or a few hundred go missing every year and nobody notices. Chicago's crime data shows both. In any year a small share of records is published without a location on purpose, concentrated in a few sensitive offence types. And from October 2025 almost every new record has been published without coordinates at all, while still carrying the block, beat, ward and community area. Dropping rows without coordinates silently removes the first group and, for recent months, nearly everything.
This page measures both kinds of missing location in Chicago's data, shows that the community area field still supports counts by area, and recovers approximate points for 2026 records from their block addresses, using the 2024 records that do have coordinates as a lookup, after testing the lookup on held-out 2024 records.
Quick answer
Count the missing coordinates by month before mapping, and fall back to the fields that remain:
for m in ("2025-08", "2025-09", "2025-10", "2026-08"):
    r = MONTHLY.loc[m]
    print(f"{m}: {r.n:,} records, {r.missing:,} without coordinates ({r.missing / r.n:.1%})")
print(f"2026 records with a community area: {R26.community_area.notna().mean():.2%}; with a block: {R26.block.notna().mean():.2%}")
2025-08: 21,386 records, 46 without coordinates (0.2%)
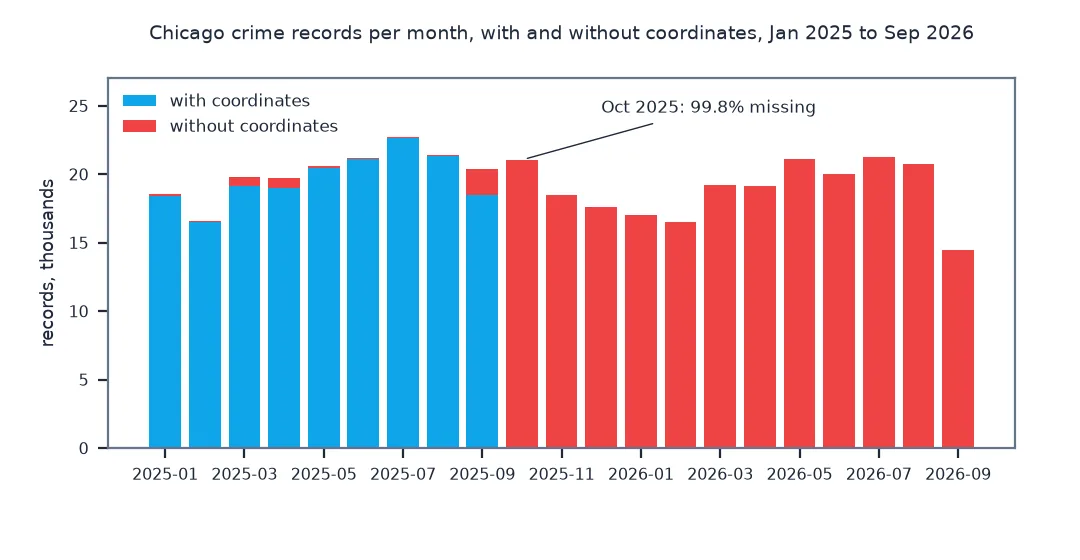
2025-09: 20,406 records, 1,906 without coordinates (9.3%)
2025-10: 21,049 records, 21,014 without coordinates (99.8%)
2026-08: 20,745 records, 20,703 without coordinates (99.8%)
2026 records with a community area: 100.00%; with a block: 100.00%
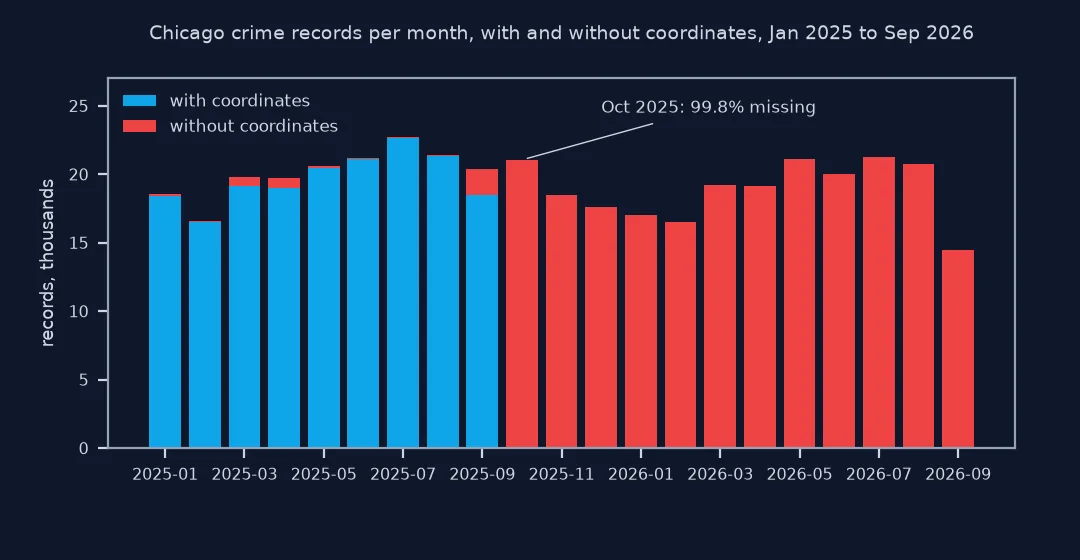
The change happens within two months: 0.2% of August 2025's records lack coordinates, 9.3% of September's and 99.8% of October's, and it has held since. Every 2026 record still has a community area and a block.
Withheld records against a publication change, a block lookup
1. Separate withheld records from the publication change
Before October 2025, records without coordinates are a small group, much more common for some offence types than others:
m24 = R24[R24.latitude.isna()]
print(f"2024: {len(m24):,} of {len(R24):,} without coordinates ({len(m24) / len(R24):.1%})")
print(f"their block is an 'UNKNOWN' placeholder: {m24.block.str.contains('UNKNOWN').mean():.0%}; community area 0: {(m24.community_area.astype(float) == 0).mean():.0%}")
share = (m24.primary_type.value_counts() / R24.primary_type.value_counts()).dropna().sort_values(ascending=False)
print(share.head(3).map("{:.0%}".format).to_string())
2024: 2,114 of 259,638 without coordinates (0.8%)
their block is an 'UNKNOWN' placeholder: 16%; community area 0: 16%
primary_type
HUMAN TRAFFICKING 17%
CRIMINAL SEXUAL ASSAULT 10%
OFFENSE INVOLVING CHILDREN 8%
In 2024 the 2,114 records without coordinates were 0.8% of the total. Only a sixth carry the 'UNKNOWN' placeholder block and community area 0; the rest name a real block. By share of their type, human trafficking, criminal sexual assault and offences involving children are withheld most often.
2. Build a block lookup and test it
The 2024 records with coordinates give, for each block address, where its incidents were placed. Hold out a fifth of them, build the lookup from the rest, and measure how far the looked-up point is from the published one:
pts = R24.dropna(subset=["latitude", "longitude"]).copy()
xy = gpd.GeoSeries(gpd.points_from_xy(pts.longitude.astype(float), pts.latitude.astype(float)), crs=4326).to_crs(3435)
pts["x"], pts["y"], pts["B"] = xy.x.values, xy.y.values, pts.block.str.upper()
test = np.random.default_rng(0).random(len(pts)) < 0.2
lookup = pts[~test].groupby("B")[["x", "y"]].median()
t = pts[test].join(lookup, on="B", rsuffix="_lookup")
hit = t.x_lookup.notna()
err = np.hypot(t.x - t.x_lookup, t.y - t.y_lookup)[hit]
print(f"held-out records found in the lookup: {hit.mean():.1%}; error median {err.median():.0f} ft, 90th percentile {err.quantile(0.9):.0f} ft")
held-out records found in the lookup: 97.6%; error median 34 ft, 90th percentile 230 ft
97.6% of held-out blocks appear in the lookup, and half the looked-up points are within 34 feet of the published ones, nine in ten within 230 feet: less than a block.
3. Recover points for the 2026 records
Build the lookup from all of 2024 and apply it to 2026, then check the recovered points against the community area each record carries:
LOOKUP = pts.groupby("B")[["x", "y"]].median()
r = R26.assign(B=R26.block.str.upper()).join(LOOKUP, on="B")
found = r.x.notna()
print(f"2026 records placed from their block: {found.mean():.1%} of {len(r):,}; blocks in the lookup: {len(LOOKUP):,}")
g = gpd.GeoDataFrame(r[found], geometry=gpd.points_from_xy(r.x[found], r.y[found]), crs=3435)
j = gpd.sjoin(g, CA[["area_numbe", "geometry"]], predicate="within", how="left")
agree = (j.community_area.astype(float) == j.area_numbe.astype(float)).mean()
print(f"recovered point falls in the record's own community area: {agree:.1%}")
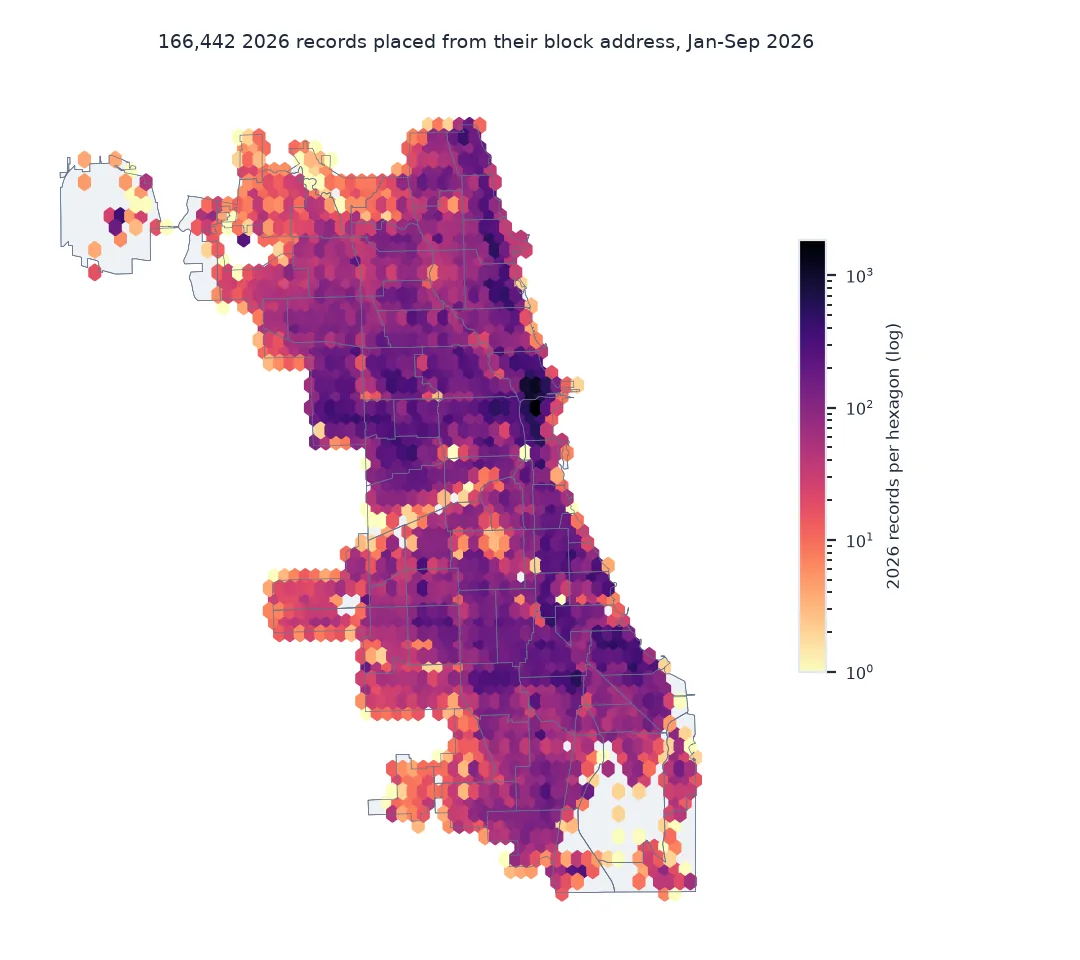
2026 records placed from their block: 98.2% of 169,496; blocks in the lookup: 27,199
recovered point falls in the record's own community area: 97.4%
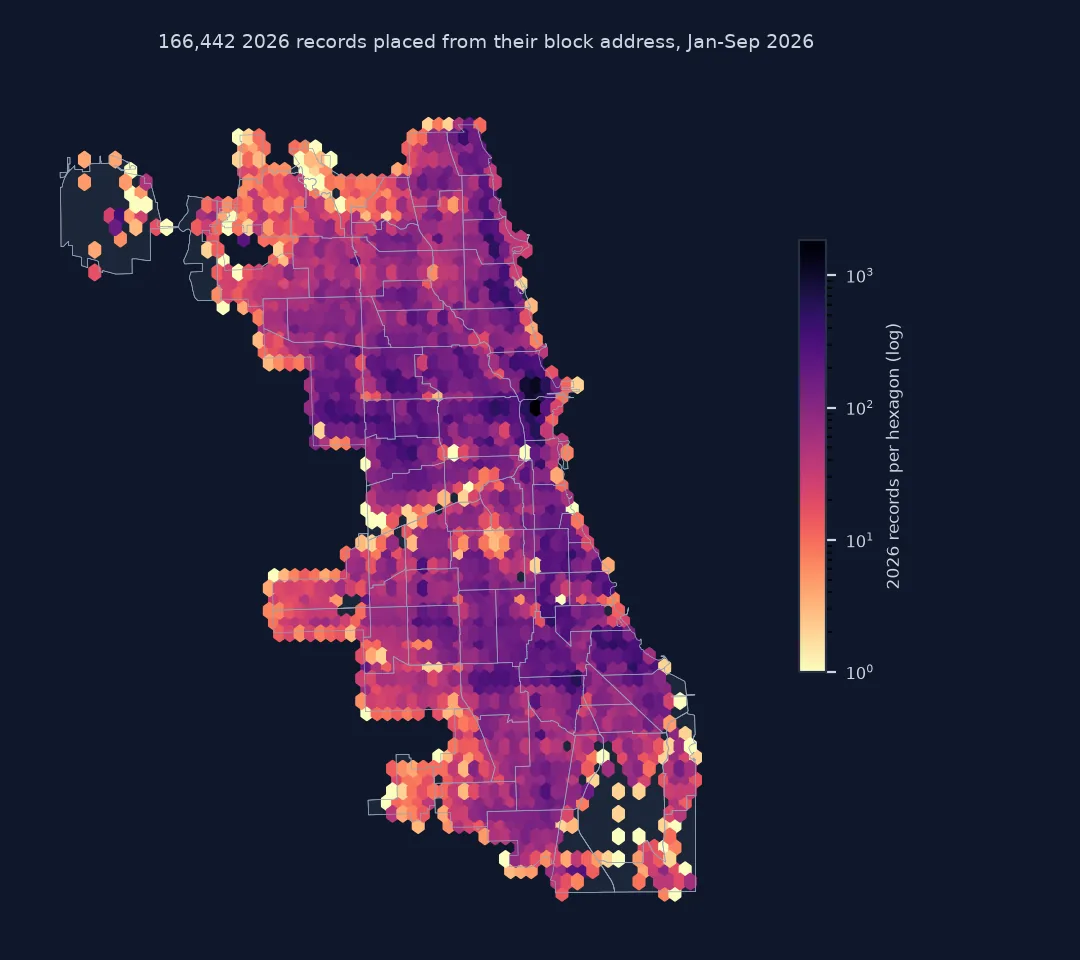
98.2% of the 2026 records can be placed from 27,199 known blocks, and 97.4% of the recovered points fall inside the community area the record names, close to the 97.6% agreement between recorded areas and published points in 2024.
Counts by area need no coordinates
The data used on this page
The City of Chicago's Crimes - 2001 to Present (ijzp-q8t2): monthly counts of records with and without coordinates from January 2025, aggregated on the server; all records dated 2024 and 2026, as downloaded on the date the page was run; and the community area boundaries.
from pathlib import Path

import geopandas as gpd
import numpy as np
import pandas as pd
import requests

Path("data").mkdir(exist_ok=True)
URL = "https://data.cityofchicago.org/resource/ijzp-q8t2.json"


def year_rows(year, select):
    f = Path(f"data/chicago_crimes_{year}.parquet")
    if not f.exists():
        rows, offset = [], 0
        while True:
            part = requests.get(URL, timeout=300, params={"$where": f"year={year}", "$limit": 50_000, "$offset": offset,
                                                         "$order": "id", "$select": select}).json()
            rows += part; offset += len(part)
            if len(part) < 50_000:
                break
        pd.DataFrame(rows).to_parquet(f)
    return pd.read_parquet(f)


R24 = year_rows(2024, "id,date,primary_type,arrest,domestic,community_area,latitude,longitude,location_description,block,updated_on")
R26 = year_rows(2026, "id,date,primary_type,community_area,beat,block,latitude,longitude")
f = Path("data/monthly_missing.json")
if not f.exists():
    f.write_bytes(requests.get(URL, timeout=300, params={
        "$select": "date_trunc_ym(date) AS month, count(*) AS n, sum(case(latitude IS NULL, 1, true, 0)) AS missing",
        "$where": "year >= 2025", "$group": "month", "$order": "month"}).content)
MONTHLY = pd.read_json(f).assign(month=lambda d: pd.to_datetime(d.month).dt.strftime("%Y-%m")).set_index("month")
G = Path("data/chicago_community_areas.geojson")
if not G.exists():
    G.write_bytes(requests.get("https://data.cityofchicago.org/resource/igwz-8jzy.geojson?$limit=100", timeout=120).content)
CA = gpd.read_file(G).to_crs(3435)
print(f"2024: {len(R24):,} records; 2026 so far: {len(R26):,}; {len(MONTHLY)} months of counts")
2024: 259,638 records; 2026 so far: 169,496; 21 months of counts
Example 1: counts by area need no coordinates
For counts by community area, the recorded field is enough. Compare 2026 counts from the field with counts from the recovered points:
by_field = R26.community_area.astype(float).value_counts()
by_point = j.area_numbe.astype(float).value_counts()
both = pd.DataFrame({"field": by_field, "points": by_point}).dropna()
print(f"areas: {len(both)}; correlation of the two counts: {both.field.corr(both.points):.3f}")
print(f"largest difference: {(both.points / both.field - 1).abs().max():.1%}; median {(both.points / both.field - 1).abs().median():.1%}")
areas: 77; correlation of the two counts: 0.999
largest difference: 33.5%; median 3.7%
Counts by area from the recorded field and from recovered points correlate at 0.999, with a median difference of 3.7%. In one area the two differ by a third, so for counts by area the recorded field is the more direct source.
Two causes, two responses
Missing coordinates have two different causes here, and they call for different responses. The first is long-standing: under 1% of records a year are published without a location, with the highest shares in human trafficking, sexual assault and offences involving children, and a sixth of them with a placeholder block and community area 0. They are a small, non-random share, so dropping them biases maps of those offences; the right response is to count them by type and say so.
The second is a change in how the data is published. From October 2025 the coordinate fields are simply absent on almost every new record, while the block, beat, district, ward and community area remain. The dataset's description does not mention it, and nothing fails: a script that drops rows without coordinates runs cleanly and maps a few dozen points a month. Checking the missing share by month is the only way to see it.
The block address is the bridge. Chicago places each incident on the street centreline of its block, so the median position of a block's earlier incidents is a good stand-in for a new one: within 34 feet for half of the held-out records. Recovered points are approximate, like the originals, and blocks with no earlier incidents cannot be placed; for counts by area, the recorded fields need no coordinates at all.
Changing practice and anonymisation
- Keep checking: publication practice can change again, in either direction; put the monthly missing-share check in the pipeline, not in a one-off notebook.
- Older lookups: a block lookup from one year covers most blocks; combining several years covers more.
- Geocoding instead: block addresses can be geocoded against the city's address points or TIGER address ranges, which also covers blocks with no history.
- Other cities: locations are often withheld for sexual offences; look for placeholder values, such as an 'UNKNOWN' street, as well as nulls.
- Do not reverse the anonymisation: recovering the block a record already names is fine; trying to recover more precise locations than published is not, and Chicago's terms prohibit deriving specific addresses.
Internal links
- How to download and map city crime data in Python — the dataset and its withheld records
- How to count crime on street segments in Python — why points sit on centrelines
- How to analyse crime trends over time in Python — counts that need no coordinates
FAQ
Why do some crime records have no latitude and longitude?
Some are published without a location, most often for trafficking and sexual offences; and in Chicago, records from October 2025 onward are published without coordinates almost entirely.
How can I map crime records without coordinates?
Count them by the area fields they carry, such as community area or beat, or recover approximate points from their block address using earlier records or a geocoder.
Is it safe to drop crime records with missing coordinates?
Only after counting them: they are not random, and in recent Chicago data they are almost all records.
When did Chicago stop publishing crime coordinates?
In the data as downloaded for this page, the share of records without coordinates rose from under 1% in August 2025 to over 99% from October 2025.