
Why Is the First of the Month the Busiest Day in My Crime Data?
On this page
Problem statement
You count crime by day and the busiest day of the year is 1 January, followed by the first days of other months. A New Year's Eve effect is plausible, but the first of September and the first of November have no such excuse. The cause is in the timestamps: when the date of an offence is unknown, a record can carry a default, and the defaults land on midnight at the start of a month. Fraud discovered weeks later, an offence reported long after it happened, a range of dates reduced to its first day: all of them pile onto 00:00 on the 1st.
This page finds these placeholder dates in Chicago's 2024 incident records, measures how much they inflate the first of each month and which offence types they come from, and recounts the busiest days with them flagged.
Quick answer
Flag records timed exactly 00:00 on the first of a month, then compare day-of-month counts with and without them:
first_midnight = (C.time.dt.day == 1) & C.midnight
by_day = C[C.midnight].time.dt.day.value_counts().sort_index()
print(f"records at exactly 00:00: {C.midnight.sum():,}; on the 1st of a month: {by_day[1]:,}, other days average {by_day.drop(1).loc[:28].mean():.0f}")
daily = C.groupby(C.time.dt.date).size()
print("busiest days as recorded:", ", ".join(f"{d:%d %b} ({n:,})" for d, n in daily.nlargest(5).items()))
clean = C[~first_midnight].groupby(C.time.dt.date).size()
print("with first-of-month midnights set aside:", ", ".join(f"{d:%d %b} ({n:,})" for d, n in clean.nlargest(5).items()))
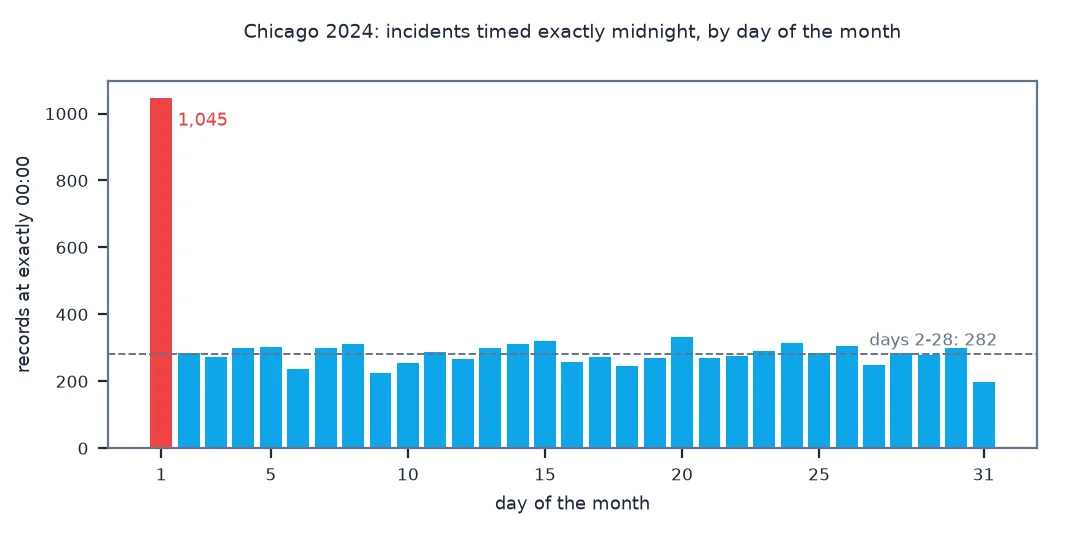
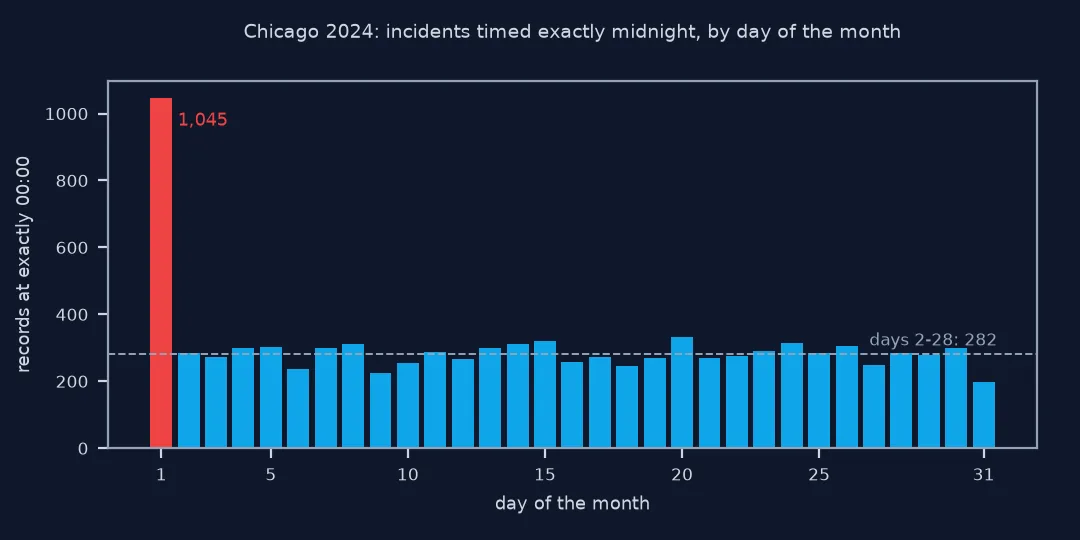
records at exactly 00:00: 9,443; on the 1st of a month: 1,045, other days average 282
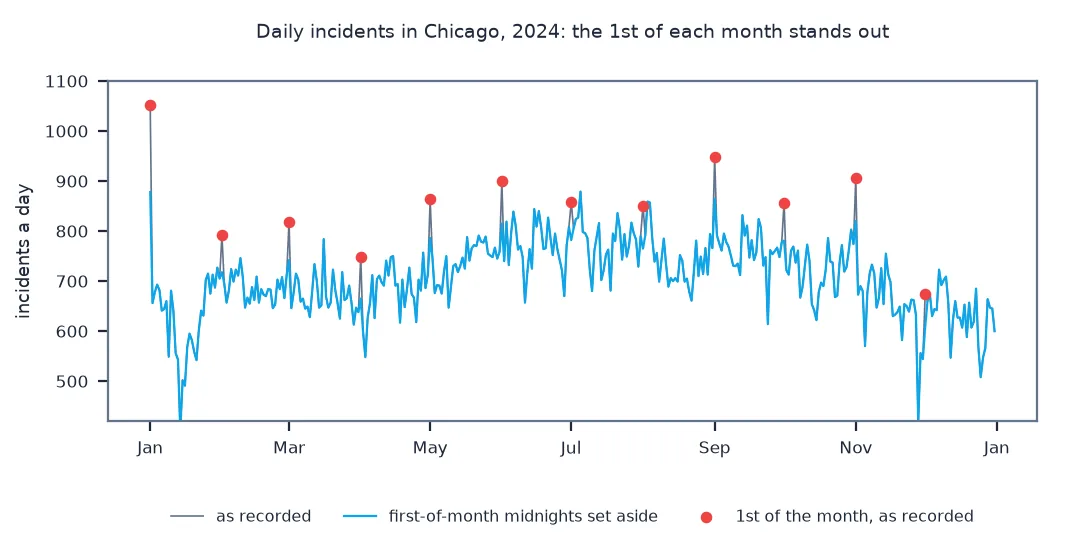
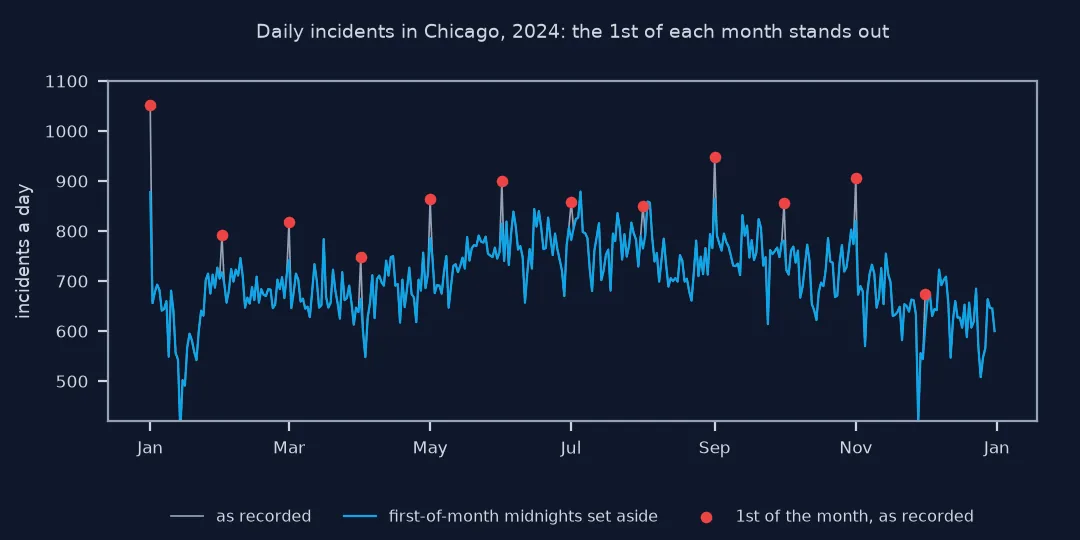
busiest days as recorded: 01 Jan (1,052), 01 Sep (948), 01 Nov (906), 01 Jun (900), 05 Jul (879)
with first-of-month midnights set aside: 05 Jul (879), 01 Jan (878), 01 Sep (865), 03 Aug (859), 04 Aug (857)
As recorded, four of the five busiest days of 2024 are firsts of the month. With the 1,045 first-of-month midnights set aside, 5 July, after the Independence Day holiday, tops the list, and two August weekend days join it; 1 January and 1 September stay in the top five, for reasons the next steps look at.
Find placeholders, see which offences carry them, measure
1. Find the placeholders
Real offences at midnight are spread over every day; placeholder dates are not. Compare the 1st with the other days, and 1 January with 2 January:
jan1 = ((C.time.dt.month == 1) & (C.time.dt.day == 1) & C.midnight).sum()
jan2 = ((C.time.dt.month == 1) & (C.time.dt.day == 2) & C.midnight).sum()
print(f"midnight records on the 1st: {by_day[1] / by_day.drop(1).loc[:28].mean():.1f} times the other days")
print(f"1 Jan 00:00: {jan1}; 2 Jan 00:00: {jan2}")
print(f"first-of-month midnights by month: {C[first_midnight].time.dt.month.value_counts().sort_index().to_dict()}")
midnight records on the 1st: 3.7 times the other days
1 Jan 00:00: 174; 2 Jan 00:00: 14
first-of-month midnights by month: {1: 174, 2: 74, 3: 77, 4: 84, 5: 78, 6: 85, 7: 76, 8: 86, 9: 83, 10: 76, 11: 86, 12: 66}
Midnight on the 1st has 3.7 times as many records as midnight on other days, every month of the year, and 1 January has 174 against 14 on 2 January. A real midnight effect would not single out one day of every month.
2. See which offences carry them
share = (C[first_midnight].primary_type.value_counts() / C.primary_type.value_counts()).dropna()
counts = C[first_midnight].primary_type.value_counts()
print(pd.DataFrame({"records": counts, "share of the type": share.map("{:.1%}".format)}).sort_values("records", ascending=False).head(6).to_string())
excess = by_day[1] - by_day.drop(1).loc[:28].mean()
print(f"excess over a normal day's midnight count: about {excess:,.0f} records a year, {excess / first_midnight.sum():.0%} of the first-of-month midnights")
records share of the type
primary_type
DECEPTIVE PRACTICE 310 1.9%
OTHER OFFENSE 153 0.9%
THEFT 152 0.3%
OFFENSE INVOLVING CHILDREN 76 4.3%
CRIMINAL DAMAGE 70 0.2%
BATTERY 58 0.1%
excess over a normal day's midnight count: about 763 records a year, 73% of the first-of-month midnights
Deceptive practice contributes the most, 310 records, 1.9% of all deceptive practice; offences involving children have the highest share, 4.3%. About 763 of the 1,045 first-of-month midnights are excess over a normal day, so roughly three in four are placeholders.
3. Measure the effect on daily counts
is_first = pd.Series(pd.to_datetime(daily.index).day == 1, index=daily.index)
print(f"average day: {daily[~is_first].mean():.0f}; average 1st of the month: {daily[is_first].mean():.0f} as recorded, "
      f"{clean[is_first.values].mean():.0f} with first-of-month midnights set aside")
print(f"1 January: {daily.loc[pd.Timestamp('2024-01-01').date()]:,} as recorded, {clean.loc[pd.Timestamp('2024-01-01').date()]:,} set aside")
rest = C[~first_midnight]
d1, other = rest[rest.time.dt.day == 1], rest[rest.time.dt.day != 1]
ratio = (d1.primary_type.value_counts() / 12) / (other.primary_type.value_counts() / (366 - 12))
print(f"still on the 1st: deceptive practice {ratio['DECEPTIVE PRACTICE']:.2f} times its usual daily count; "
      f"records at exactly 12:00 {((d1.time.dt.hour == 12) & (d1.time.dt.minute == 0)).mean():.1%} against {((other.time.dt.hour == 12) & (other.time.dt.minute == 0)).mean():.1%} on other days")
average day: 704; average 1st of the month: 856 as recorded, 769 with first-of-month midnights set aside
1 January: 1,052 as recorded, 878 set aside
still on the 1st: deceptive practice 1.63 times its usual daily count; records at exactly 12:00 3.8% against 2.3% on other days
The average first of the month falls from 856 to 769 incidents, still above the 704 of other days. Part of the rest is a second layer: deceptive practice runs at 1.63 times its usual daily level on the 1st even outside midnight, and more of the 1st's records sit at exactly noon. Whether that is defaults at other times or frauds tied to monthly billing, the data alone cannot say.
Flagging rather than deleting
The data used on this page
The City of Chicago's Crimes - 2001 to Present (ijzp-q8t2), every incident dated 2024, with its recorded date and time in Chicago local time.
from pathlib import Path

import pandas as pd
import requests

Path("data").mkdir(exist_ok=True)
URL = "https://data.cityofchicago.org/resource/ijzp-q8t2.json"
F = Path("data/chicago_crimes_2024.parquet")
if not F.exists():
    rows, offset = [], 0
    while True:
        part = requests.get(URL, timeout=300, params={
            "$where": "year=2024", "$limit": 50_000, "$offset": offset, "$order": "id",
            "$select": "id,date,primary_type,arrest,domestic,community_area,latitude,longitude,location_description,block,updated_on"}).json()
        rows += part; offset += len(part)
        if len(part) < 50_000:
            break
    pd.DataFrame(rows).to_parquet(F)
C = pd.read_parquet(F)
C["time"] = pd.to_datetime(C.date)
C["midnight"] = (C.time.dt.hour == 0) & (C.time.dt.minute == 0) & (C.time.dt.second == 0)
print(f"{len(C):,} incidents in 2024; timestamps to the second, {(C.time.dt.second != 0).sum()} with non-zero seconds")
259,638 incidents in 2024; timestamps to the second, 1 with non-zero seconds
Example 1: a flag rather than a deletion
Keep the records, add a column saying how much of their timestamp to trust, and let each analysis choose:
C["time_quality"] = "minute"
C.loc[C.time.dt.minute.isin([0, 30]), "time_quality"] = "rounded"
C.loc[C.midnight, "time_quality"] = "midnight"
C.loc[first_midnight, "time_quality"] = "first of month"
print(C.time_quality.value_counts().to_string())
print(f"for daily counts drop 'first of month' ({first_midnight.mean():.1%}); for hourly counts drop 'midnight' too ({C.midnight.mean():.1%})")
time_quality
minute 141076
rounded 109119
midnight 8398
first of month 1045
for daily counts drop 'first of month' (0.4%); for hourly counts drop 'midnight' too (3.6%)
Four quality levels cover every record: 141,076 timed to the minute, 109,119 on the hour or half hour, 8,398 at midnight and 1,045 at midnight on the 1st.
Unknown dates still need a value
A record needs a date, and when the date of the offence is not known, something has to go in the field. Police systems differ in how they handle this: some record a start and end of a range, some the date of the report, some a default. In Chicago's published data, the trace of a default is unmistakable: records timed exactly 00:00 on the first of a month are several times as common as at midnight on any other day, and 1 January at 00:00 has about twelve times as many as 2 January. They come disproportionately from offence types that are discovered or reported after the fact, such as fraud and offences involving children.
Their effect depends on the question. In a yearly or monthly count they do no harm: the month is probably right, or at least no worse than the record. In daily counts they create a spike on the 1st, which can be mistaken for a pay-day effect, a New Year effect or a calendar artefact of the analysis. In hourly counts they add to the midnight peak that placeholder times already create. A flag, set once and documented, lets each analysis decide.
Real midnights, year boundaries and range fields
- Not all of them are placeholders: some offences really happen at midnight on the 1st, and the New Year is busy; the excess over other days, not the total, is the placeholder share.
- Year boundaries: placeholders on 1 January can belong to offences from the previous year, which also affects yearly totals at the margin.
- Other cities: look for spikes at midnight on the 1st, on 1 January, and on the first of the year's quarters; also at noon.
- Range fields: datasets that publish a start and end date let you measure uncertainty directly; Chicago's publishes one timestamp.
- Updates: dates can be corrected after investigation; the placeholder share in recent months can shrink as records are updated.
Internal links
- How to analyse crime by hour and day of week in Python — midnight and noon as placeholder times
- How to analyse crime trends over time in Python — monthly counts, where placeholders matter little
- How to download and map city crime data in Python — the dataset
FAQ
Why are so many crimes recorded on the first of the month?
Because records whose date is unknown are often given a default of 00:00 on the first; in Chicago's 2024 data, midnight records on the 1st were 3.7 times as common as on other days.
Why is 1 January the busiest day for crime?
Partly the New Year, but in Chicago's data mostly placeholder dates: 174 records at exactly 00:00 on 1 January, against 14 on 2 January.
Should I delete crimes recorded at midnight on the first?
No; flag them and leave them out of daily and hourly analyses, while keeping them in monthly and yearly counts.
How do I detect placeholder dates in a dataset?
Count records by day of month and by exact time; real events spread evenly, placeholders pile onto round values such as midnight on the 1st.