
Dual-Polarisation Radar Explained: ZDR, ρhv and ΦDP
On this page
Problem statement
Since 2013 every US NEXRAD radar, and most national networks elsewhere, transmits and receives in two polarisations at once — horizontal and vertical. Alongside reflectivity, a volume file now carries differential reflectivity (ZDR), the correlation coefficient (ρhv) and differential phase (ΦDP). These fields answer questions reflectivity cannot: is that echo rain, hail, birds or the ground; are the drops large or small; how much rain is attenuating the beam? They are also unfamiliar, and read without their physics they are easy to misinterpret.
This page reads the four lowest-tilt fields from the KHGX radar during Hurricane Beryl's landfall on 8 July 2024 and shows what each one says about the storm.
Quick answer
Read the sweep, keep gates with echo, and summarise each polarimetric field where the echo is meteorological:
sw = dt["sweep_0"].ds
echo = sw.DBZH.values > 5
rain = echo & (sw.RHOHV.values >= 0.95)
print(f"echo gates {echo.sum():,}; with rho_hv >= 0.95 (meteorological): {rain.sum() / echo.sum():.1%}; "
      f"below 0.85 (not rain): {(echo & (sw.RHOHV.values < 0.85)).sum() / echo.sum():.1%}")
for lo, hi in ((20, 35), (35, 45), (45, 70)):
    m = rain & (sw.DBZH.values >= lo) & (sw.DBZH.values < hi)
    print(f"{lo}-{hi} dBZ: median ZDR {np.nanmedian(sw.ZDR.values[m]):.2f} dB ({m.sum():,} gates)")
echo gates 486,134; with rho_hv >= 0.95 (meteorological): 92.6%; below 0.85 (not rain): 3.7%
20-35 dBZ: median ZDR 0.47 dB (252,231 gates)
35-45 dBZ: median ZDR 0.53 dB (127,276 gates)
45-70 dBZ: median ZDR 0.84 dB (17,566 gates)
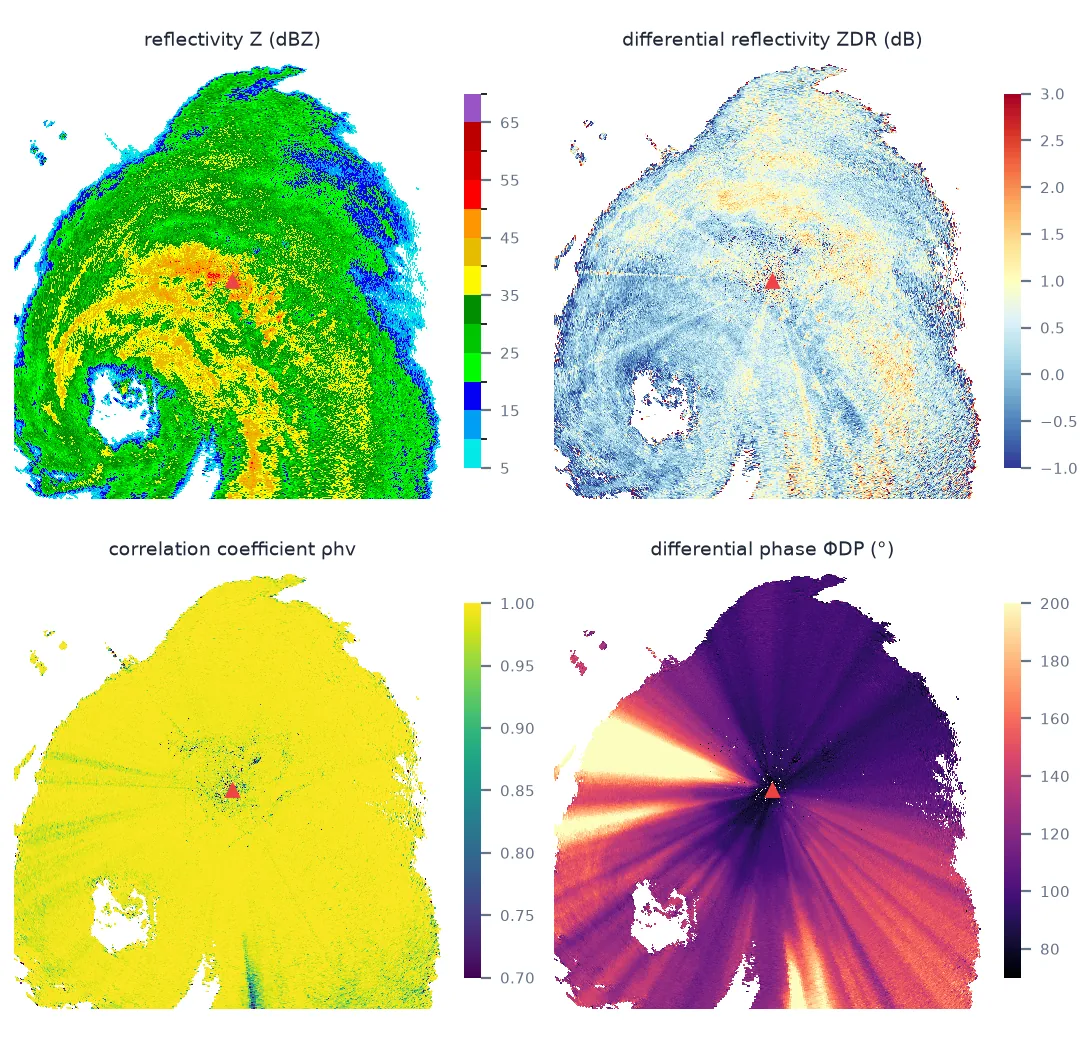
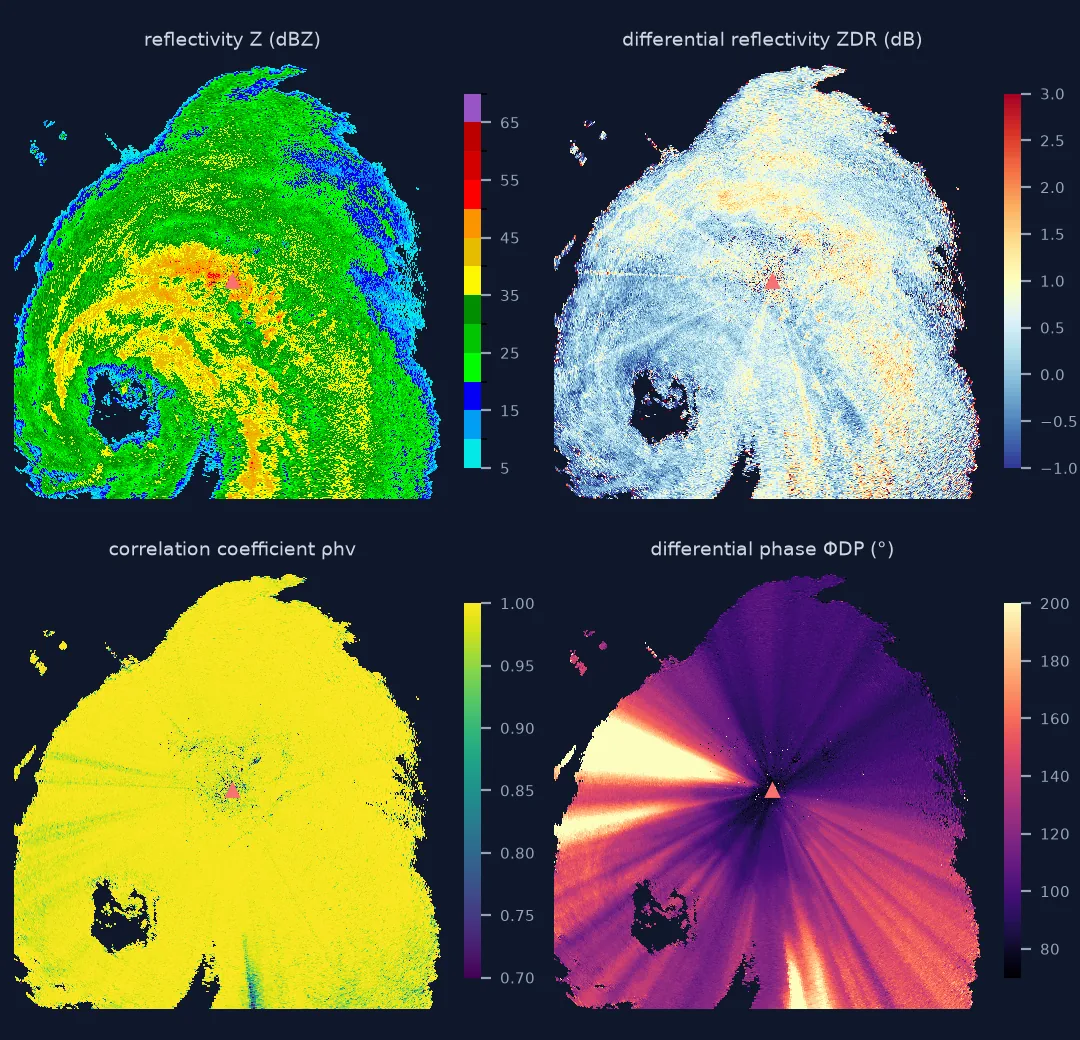
ZDR, the correlation coefficient and differential phase
1. Differential reflectivity: the shape of the drops
ZDR is the ratio of horizontal to vertical reflectivity, in decibels. Small raindrops are nearly spherical (ZDR ≈ 0 dB); large ones flatten as they fall (2–4 dB); tumbling hail looks spherical on average (ZDR ≈ 0) despite high reflectivity.
In Beryl's rain, even the heaviest echoes have a median ZDR under 1 dB — many small drops rather than a few large ones. That is the drop-size signature of tropical rain, and it is why a tropical Z–R relationship fitted the radar rainfall so much better than the continental ones.
2. Correlation coefficient: is it rain?
ρhv measures how similarly the horizontal and vertical returns vary from pulse to pulse. Uniform targets — rain — give values above about 0.97; mixtures of shapes — hail with rain, melting snow — lower it to 0.9; and non-meteorological targets — ground clutter, insects, birds, debris — scatter far below:
r = sw.range.values[None, :] * np.ones_like(sw.DBZH.values)
for lo, hi in ((0, 30e3), (30e3, 100e3), (100e3, 230e3)):
    m = echo & (r >= lo) & (r < hi)
    print(f"{lo / 1000:3.0f}-{hi / 1000:3.0f} km: share of echo with rho_hv < 0.85: {(m & (sw.RHOHV.values < 0.85)).sum() / m.sum():.1%}")
0- 30 km: share of echo with rho_hv < 0.85: 4.9%
30-100 km: share of echo with rho_hv < 0.85: 0.2%
100-230 km: share of echo with rho_hv < 0.85: 1.0%
Low-ρhv echo is 25 times more common within 30 km of the radar than at 30–100 km: close in, the beam is low enough to hit buildings, towers and trees, and the ρhv map shows them as a speckled ring around the site. Beyond 100 km the share rises again, to 1%, as signal weakens at the ragged edge of the rain shield. A ρhv threshold is the simplest effective clutter filter a dual-pol radar offers.
3. Differential phase: how much rain the beam has crossed
ΦDP accumulates along each ray as the horizontally polarised wave is slowed more than the vertical one by flattened drops. It starts at a system offset and grows with the amount of rain traversed:
az = sw.azimuth.values
ray = sw.PHIDP.values[np.argmin(np.abs(az - 180))]
rng = sw.range.values
print(f"PHIDP due south: {np.nanmean(ray[(rng > 18e3) & (rng < 22e3)]):.0f} deg at 20 km, "
      f"{np.nanmean(ray[(rng > 148e3) & (rng < 152e3)]):.0f} deg at 150 km")
PHIDP due south: 93 deg at 20 km, 122 deg at 150 km
Its range derivative, the specific differential phase KDP, is proportional to rain rate and immune to calibration errors and partial beam blockage — which is why operational rainfall algorithms use it in heavy rain.
4. Combine them
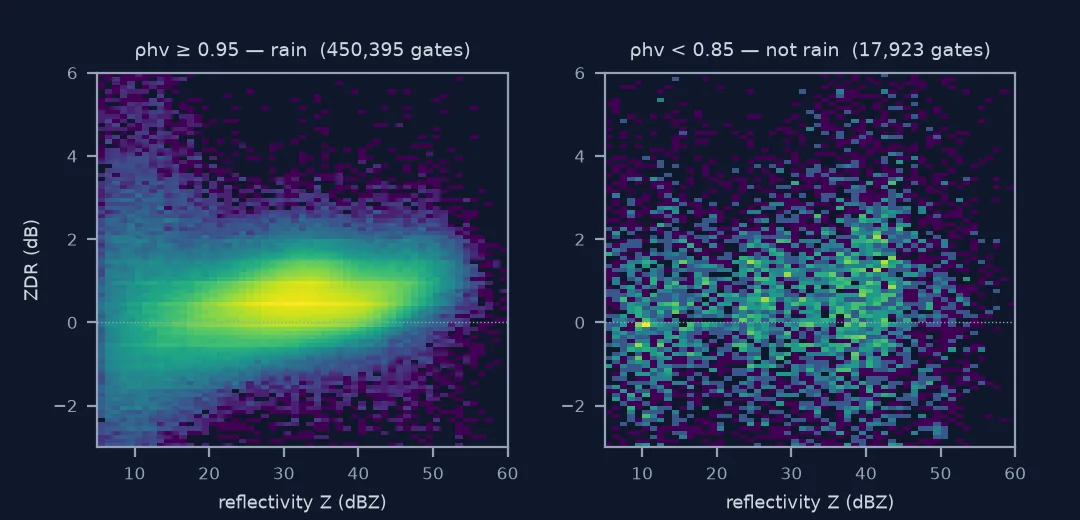
No single field classifies an echo. A hydrometeor classification combines all of them: high Z, ZDR near zero and ρhv slightly reduced suggests hail; low Z, very high ZDR and low ρhv suggests insects; moderate Z, positive ZDR, ρhv above 0.97 is rain. The scatter of ZDR against Z in Beryl shows the rain cluster on its own:
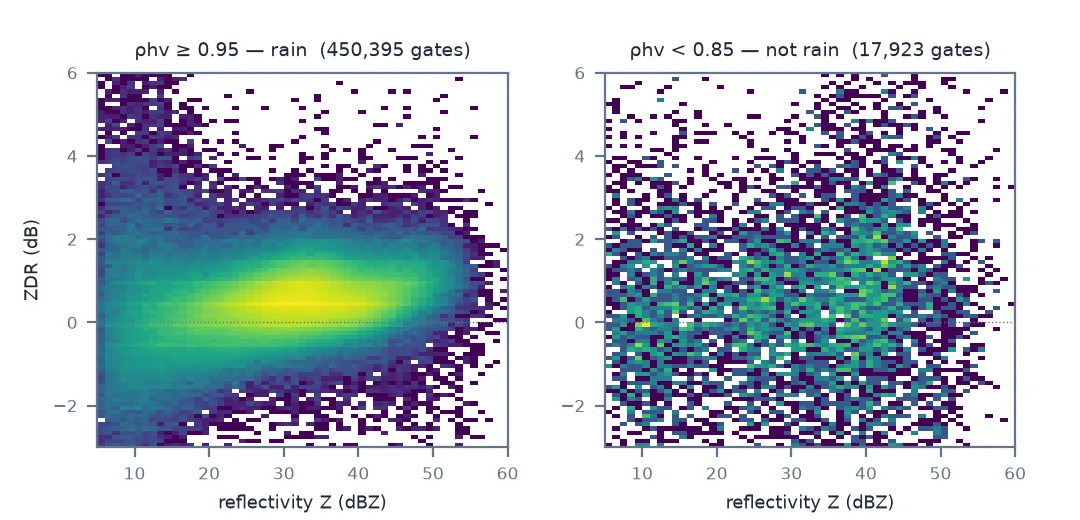
A clutter mask and KDP along a ray
The data used on this page
NOAA NEXRAD Level II, KHGX (Houston/Galveston), volume 2024-07-08 09:01:25 UTC, from the Unidata NEXRAD Level II archive on AWS.
from pathlib import Path

import numpy as np
import requests
import xradar as xd

Path("data").mkdir(exist_ok=True)
KEY = "2024/07/08/KHGX/KHGX20240708_090125_V06"
path = Path("data") / KEY.split("/")[-1]
if not path.exists():
    path.write_bytes(requests.get("https://unidata-nexrad-level2.s3.amazonaws.com/" + KEY, timeout=300).content)
dt = xd.io.open_nexradlevel2_datatree(str(path))
print([v for v in dt["sweep_0"].ds.data_vars if dt["sweep_0"].ds[v].ndim == 2])
['DBZH', 'ZDR', 'PHIDP', 'RHOHV', 'CCORH']
Example 1: a ρhv clutter mask and what it removes
z = sw.DBZH.values
mask = echo & (sw.RHOHV.values < 0.85)
print(f"removed {mask.sum():,} gates; their median reflectivity {np.median(z[mask]):.0f} dBZ "
      f"against {np.median(z[rain]):.0f} dBZ in rain; {(mask & (z >= 40)).sum():,} of them at 40 dBZ or more")
removed 17,923 gates; their median reflectivity 21 dBZ against 31 dBZ in rain; 2,127 of them at 40 dBZ or more
Most of what the mask removes is weak echo, but not all of it: 2,127 gates at 40 dBZ or more fall below the threshold too. Some are strong ground targets; others are real rain mixed with something else at the edge of a beam, which is why operational classification uses several fields at once rather than a single ρhv cut.
Example 2: estimate KDP along a ray
from scipy.ndimage import uniform_filter1d
phi = np.where(rain, sw.PHIDP.values, np.nan)
ray = phi[np.argmin(np.abs(az - 180))]
good = np.isfinite(ray)
smooth = uniform_filter1d(np.interp(rng, rng[good], ray[good]), 41)          # 10 km window
kdp = np.gradient(smooth, rng / 1000) / 2                                      # deg/km, two-way
print(f"KDP due south: median {np.nanmedian(kdp[(rng > 20e3) & (rng < 150e3)]):.2f} deg/km, "
      f"95th percentile {np.nanpercentile(kdp[(rng > 20e3) & (rng < 150e3)], 95):.2f} deg/km")
KDP due south: median 0.10 deg/km, 95th percentile 0.34 deg/km
A median of 0.1°/km corresponds to light-to-moderate rain over most of that ray; the upper tail marks the bands. Operational KDP uses more careful filtering, but even this rough estimate shows the steady accumulation. The map above shows where ΦDP climbs fastest: on rays to the west and south-west, which cross the eyewall and the heaviest bands.
What two polarisations add
A single-polarisation radar measures how much power comes back. A dual-polarisation radar also measures how the returns in two orthogonal polarisations differ in strength, in timing and in coherence — and those differences depend on the shape, orientation, size distribution and mixture of whatever reflected them.
Reflectivity says how much is there; ZDR says what shape it is; ρhv says how uniform it is; ΦDP says how much rain lies along the path. Together they make it possible to remove clutter and biological echo, to identify hail and melting layers, to choose rainfall relationships, and to correct for attenuation. In Beryl, the low ZDR of heavy rain and the high ρhv across the rain shield describe a classic tropical rain field — and the low-ρhv gates near the radar mark the clutter that inflated the radar totals.
Calibration, low signal and hail
- ZDR needs calibration; a 0.2 dB bias matters for drop-size estimates.
- ρhv drops at low signal-to-noise, at the edges of echo and at long range.
- ΦDP has a system offset and folds at 360°; work with its range derivative.
- Hail gives high Z with ZDR near zero and reduced ρhv.
- Insects and birds give low ρhv and high, noisy ZDR, mostly at night and near the ground.
- Attenuation at S band is small; at C and X band ΦDP-based correction is essential.
Internal links
- How to read NEXRAD Level II — the file these fields come from
- Weather radar reflectivity explained — the first field
- How to estimate rainfall from radar — drop sizes and Z–R
- Radar beam blockage and clutter — ρhv as a filter
- Radar rainfall too high: hail and bright band — what ZDR and ρhv reveal
FAQ
What is ZDR on weather radar?
Differential reflectivity: horizontal over vertical reflectivity in dB. Near 0 for small round drops and hail, positive for large flattened drops.
What does the correlation coefficient show?
How uniform the targets are. Rain is above about 0.97; mixed precipitation lower; clutter, insects and debris much lower.
What is differential phase used for?
Its range derivative, KDP, estimates rain rate in heavy rain and corrects attenuation, independent of calibration and partial beam blockage.
Why was ZDR low in Hurricane Beryl's heavy rain?
Tropical rain contains many small drops rather than a few large ones; even at 45 dBZ and above the median ZDR was under 1 dB.