
How to Read MRMS Rainfall Estimates from GRIB2 in Python
On this page
Problem statement
NOAA's Multi-Radar Multi-Sensor system (MRMS) merges every radar in the United States with rain gauges, satellite and model data into rainfall grids at 1 km every hour, and publishes them free on AWS. It is the quickest way to get a defensible rainfall map for any US storm. The files are GRIB2, gzipped, on a 7,000 × 3,500 grid with longitudes from 230° to 300°; xarray opens them only to call the variable "unknown"; negative values are codes; and the product names hide differences — radar-only against gauge-corrected, which 24 hours — that change the answer by a factor of two.
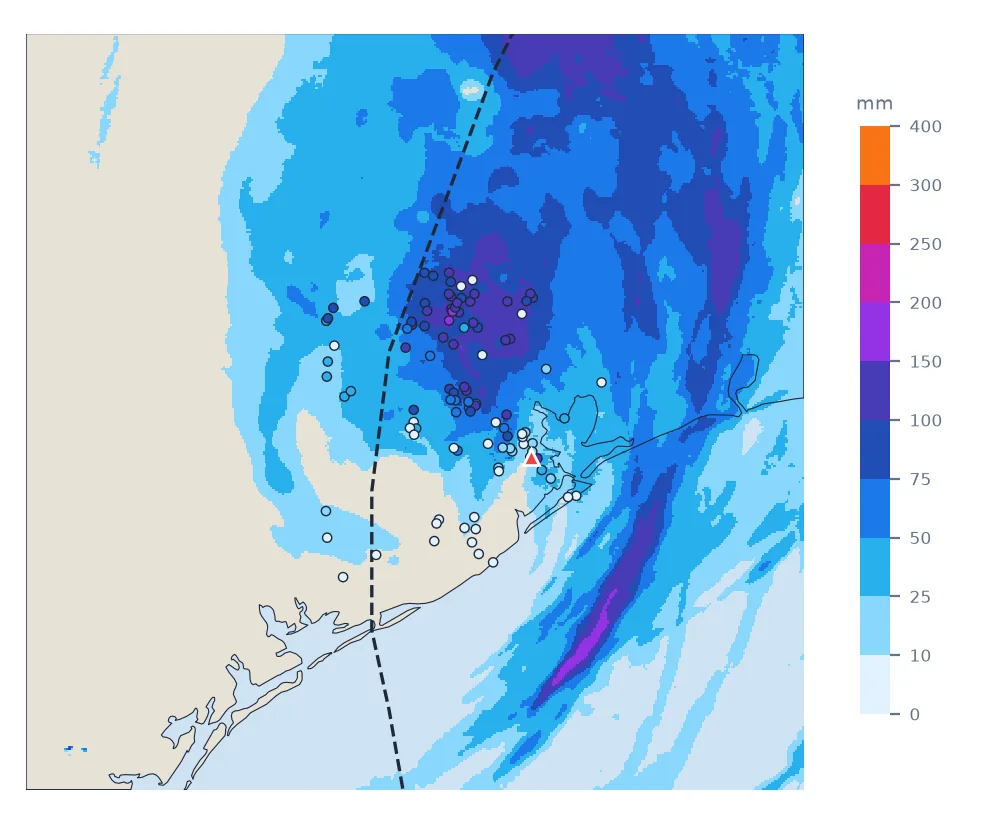
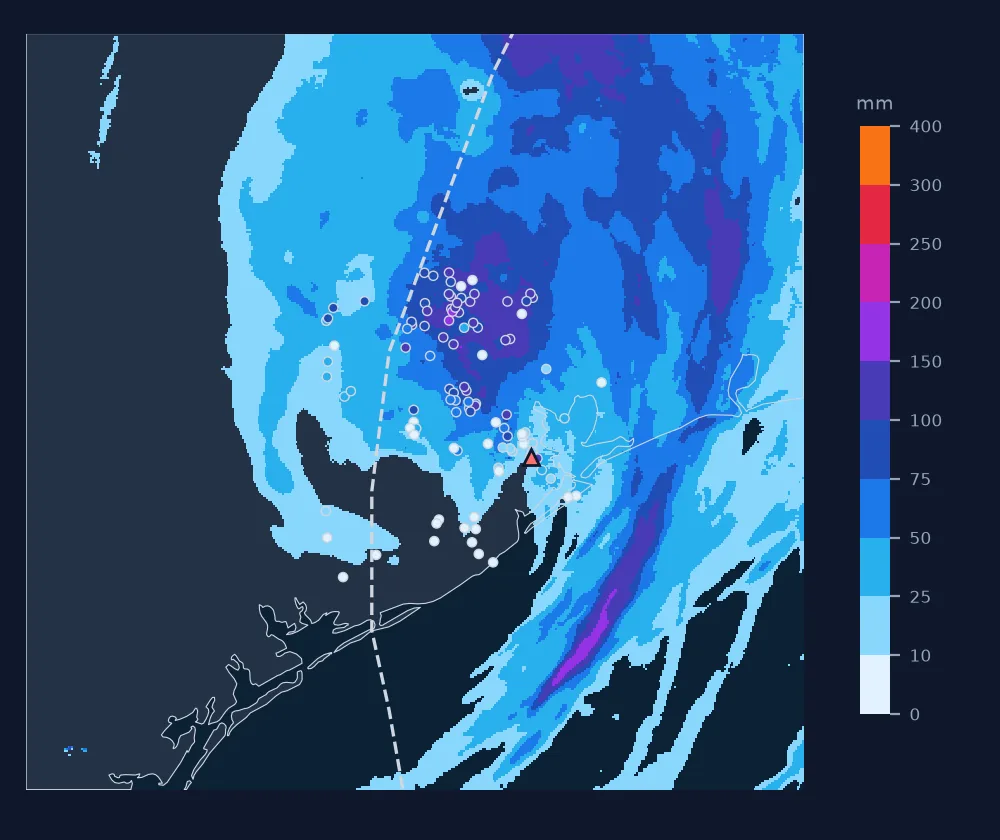
This page reads the MRMS 24-hour estimates for Hurricane Beryl's landfall in Texas on 8 July 2024 and shows how to get the field, the units and the time window right.
Quick answer
Download the gzipped GRIB2 from the public bucket, decompress, open with cfgrib, mask the negative codes and convert longitudes:
key = "CONUS/MultiSensor_QPE_24H_Pass2_00.00/20240709/MRMS_MultiSensor_QPE_24H_Pass2_00.00_20240709-000000.grib2.gz"
grib = fetch_mrms(key)
ds = xr.open_dataset(grib, engine="cfgrib", decode_timedelta=True, backend_kwargs={"indexpath": ""})
qpe = ds["unknown"].where(ds["unknown"] >= 0)                       # -3 = no coverage
qpe = qpe.assign_coords(longitude=qpe.longitude - 360)
tx = qpe.sel(latitude=slice(31.6, 27.8), longitude=slice(-98, -93.5))
top = tx.where(tx == tx.max(), drop=True)
print(ds["unknown"].shape, "grid;", f"24 h ending {str(ds.valid_time.values)[:16]} UTC: max {float(tx.max()):.0f} mm at "
      f"{float(top.latitude[0]):.2f} N, {float(top.longitude[0]):.2f} E")
(3500, 7000) grid; 24 h ending 2024-07-09T00:00 UTC: max 369 mm at 28.44 N, -94.87 E
Find the product, open it, mask the codes, pick the window
1. Find the product
The bucket noaa-mrms-pds is organised as CONUS/<product>/<YYYYMMDD>/MRMS_<product>_<YYYYMMDD-HHMMSS>.grib2.gz. For rainfall, the main choices are:
listing = requests.get("https://noaa-mrms-pds.s3.amazonaws.com/", params={"list-type": 2, "prefix": "CONUS/", "delimiter": "/"}, timeout=60).text
products = re.findall(r"<Prefix>CONUS/([^<]*QPE[^<]*)/</Prefix>", listing)
print(len(products), "QPE products, e.g.", [p for p in products if "24H" in p])
34 QPE products, e.g. ['FLASH_QPE_ARI24H_00.00', 'MultiSensor_QPE_24H_Pass1_00.00', 'MultiSensor_QPE_24H_Pass2_00.00', 'RadarOnly_QPE_24H_00.00']
RadarOnly is radar with no gauge correction; MultiSensor Pass1 adds gauges available about an hour after the fact, Pass2 those available after two. The hour in the file name is the end of the accumulation window.
2. Open it, and know why the variable is "unknown"
MRMS uses a local GRIB2 parameter table that eccodes does not ship, so the variable name comes out as unknown. The metadata still tells you what it is:
a = ds["unknown"]
print({"centre": ds.attrs.get("GRIB_centre"), "grid": a.attrs.get("GRIB_gridType"), "step": a.attrs.get("GRIB_iDirectionIncrementInDegrees")})
print(f"latitude {float(a.latitude.min()):.3f}-{float(a.latitude.max()):.3f}, longitude {float(a.longitude.min()):.3f}-{float(a.longitude.max()):.3f}")
{'centre': '161', 'grid': 'regular_ll', 'step': 0.01}
latitude 20.005-54.995, longitude 230.005-299.995
Centre 161 is NOAA/OAR; the grid is regular latitude–longitude at 0.01°, longitudes 0–360. Units are millimetres for the QPE products — the file says "unknown" for those too.
3. Mask the codes
Negative values are not rain:
vals, counts = np.unique(a.values[a.values < 0], return_counts=True)
print(dict(zip(vals.tolist(), (counts / a.size).round(3).tolist())), "of the grid")
{-3.0: 0.062} of the grid
−3 marks cells with no radar coverage; left in, they turn a total into a deficit wherever they fall in an average.
4. Get the window right
A "24-hour" total ending at 00 UTC and one ending at 12 UTC on the same date are different storms' worth of rain when the heaviest falls cross either boundary. For Beryl, which made landfall at about 08:40 UTC on 8 July:
for stamp in ("20240709-000000", "20240709-120000"):
    f = fetch_mrms(f"CONUS/MultiSensor_QPE_24H_Pass2_00.00/{stamp[:8]}/MRMS_MultiSensor_QPE_24H_Pass2_00.00_{stamp}.grib2.gz")
    q = xr.open_dataset(f, engine="cfgrib", decode_timedelta=True, backend_kwargs={"indexpath": ""})["unknown"]
    q = q.where(q >= 0).sel(latitude=slice(31.6, 27.8), longitude=slice(262, 266.5))
    print(f"24 h ending {stamp[:8]} {stamp[9:11]} UTC: max {float(q.max()):5.0f} mm, cells at 150 mm or more: {int((q >= 150).sum()):6,}")
24 h ending 20240709 00 UTC: max 369 mm, cells at 150 mm or more: 12,345
24 h ending 20240709 12 UTC: max 182 mm, cells at 150 mm or more: 262
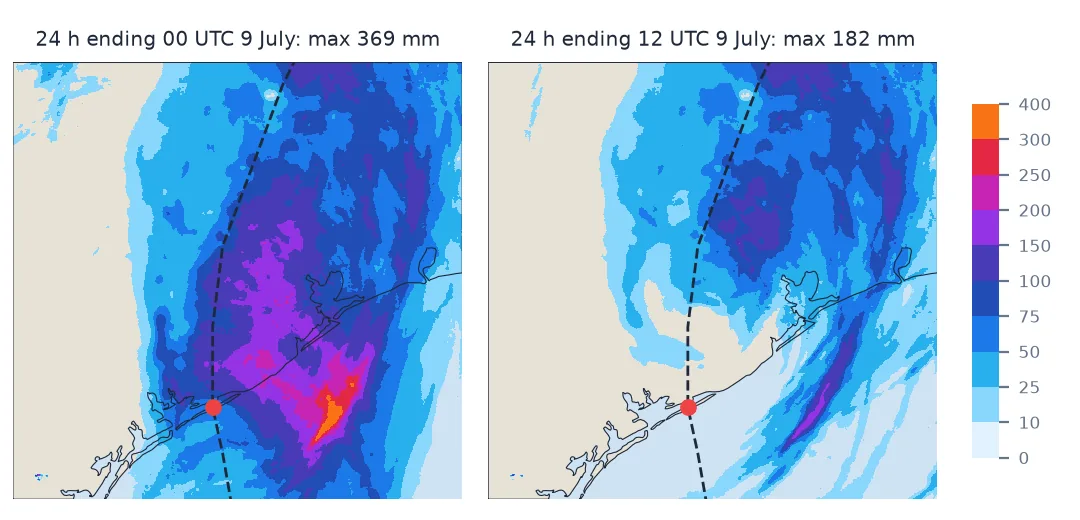
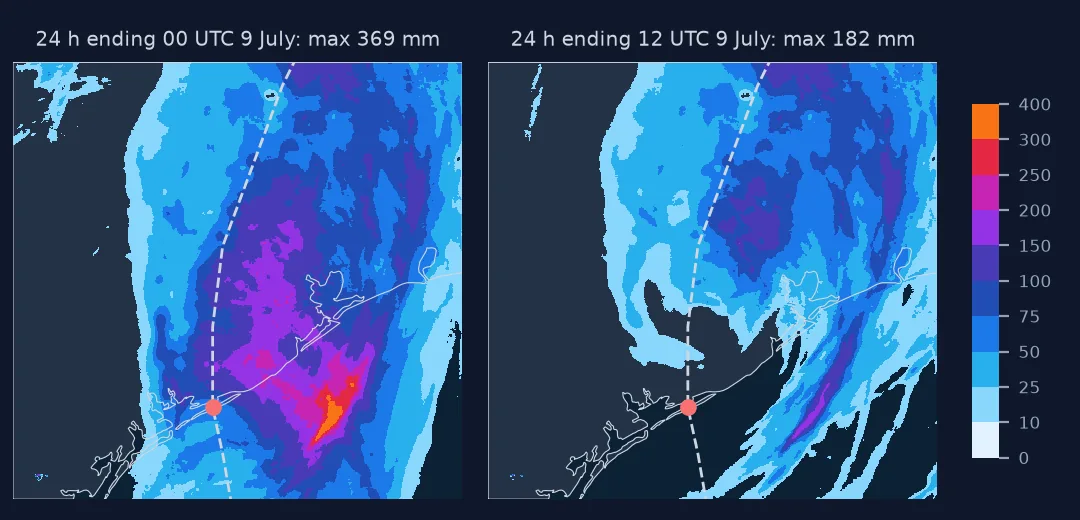
The window ending at 00 UTC holds the landfall; the one ending at 12 UTC begins three hours after it and holds almost none of the heaviest totals — 262 cells at 150 mm or more against 12,345. Match the window to the question — and to the gauges you compare with, which usually report a day ending at 7 am local time.
5. Radar-only or gauge-corrected?
ro = xr.open_dataset(fetch_mrms("CONUS/RadarOnly_QPE_24H_00.00/20240709/MRMS_RadarOnly_QPE_24H_00.00_20240709-000000.grib2.gz"),
                     engine="cfgrib", decode_timedelta=True, backend_kwargs={"indexpath": ""})["unknown"]
ro = ro.where(ro >= 0).sel(latitude=slice(31.6, 27.8), longitude=slice(262, 266.5))
ms = qpe.sel(latitude=slice(31.6, 27.8), longitude=slice(-98, -93.5))
top = ro.where(ro == ro.max(), drop=True)
print(f"radar-only max {float(ro.max()):.0f} mm at {float(top.latitude[0]):.2f} N, {float(top.longitude[0]) - 360:.2f} E; "
      f"multi-sensor max {float(ms.max()):.0f} mm")
radar-only max 551 mm at 28.02 N, -97.75 E; multi-sensor max 369 mm
Radar-only places its maximum far from the storm's centre, at a value the gauge-corrected product does not support — the kind of artefact (bright band, hail, anomalous propagation) that the gauge correction exists to remove. For totals, use MultiSensor Pass2 unless you need radar alone.
A clipped GeoTIFF and area above a threshold
The data used on this page
NOAA Multi-Radar Multi-Sensor (MRMS) 24-hour QPE, MultiSensor Pass2 and RadarOnly, ending 00 and 12 UTC on 9 July 2024, from the NOAA MRMS archive on AWS; Beryl's landfall time from IBTrACS v04r01.
import gzip
import re
import shutil
from pathlib import Path

import numpy as np
import requests
import xarray as xr

Path("data").mkdir(exist_ok=True)

def fetch_mrms(key):
    """Download a gzipped MRMS GRIB2 from AWS and return the path of the decompressed file."""
    gz = Path("data") / key.split("/")[-1]
    out = gz.with_suffix("")
    if not out.exists():
        gz.write_bytes(requests.get("https://noaa-mrms-pds.s3.amazonaws.com/" + key, timeout=300).content)
        with gzip.open(gz) as f, open(out, "wb") as o:
            shutil.copyfileobj(f, o)
    return str(out)

print("ready")
ready
Example 1: save a clipped GeoTIFF
import rioxarray  # noqa: F401  (registers .rio)
clip = tx.rename({"longitude": "x", "latitude": "y"}).rio.write_crs("EPSG:4326")
clip.rio.to_raster("data/beryl_mrms_24h_20240709_00z.tif", compress="deflate")
print(clip.shape, round(Path("data/beryl_mrms_24h_20240709_00z.tif").stat().st_size / 1e6, 2), "MB")
(380, 450) 0.32 MB
Example 2: area above a threshold
On a 0.01° grid, cell area shrinks with latitude; for area statistics, weight by it:
cell_km2 = (111.32 * 0.01) ** 2 * np.cos(np.radians(tx.latitude))
area = float((cell_km2 * (tx >= 150)).sum())
print(f"area with 150 mm or more in the 24 h ending 00 UTC 9 July: {area:,.0f} km²")
area with 150 mm or more in the 24 h ending 00 UTC 9 July: 13,373 km²
MRMS is a mosaic of every radar
MRMS is not one radar's rainfall estimate but a mosaic: every radar's reflectivity, quality-controlled and merged onto one grid, converted to rain rate with relationships chosen by precipitation type, accumulated over time and — in the MultiSensor products — adjusted towards rain gauges. The GRIB2 files carry the result with minimal metadata, because the parameter definitions live in a local table rather than the WMO one.
That leaves three things for the user. Identify the field from the product name, because the file calls it "unknown". Treat negative values as codes, because −3 is "no coverage", not "minus three millimetres". And read the time stamp as the end of the window, choosing the window to match the event and any data it will be compared with. Beryl shows how much the last one matters: the same "24-hour" product gave a maximum of 369 mm or 182 mm depending only on when the 24 hours ended.
Unknown variable names, coverage codes and 0-360 longitudes
- The variable is called
unknown; it is the product named in the file. - −3 means no coverage; mask negatives.
- Longitudes run 230–300; subtract 360.
- The time stamp is the window's end.
- Pass2 over Pass1 over RadarOnly for totals; radar-only can carry large artefacts.
- Cell area varies with latitude on the 0.01° grid.
Internal links
- How to compare radar and gauge rainfall — the 7 am problem
- How to map storm-total rainfall — building a total
- GRIB file won't open with cfgrib — when it fails
- Radar rainfall too high: hail and bright band — what radar-only gets wrong
- How to plot a hurricane track from IBTrACS — Beryl's path
FAQ
How do I open MRMS GRIB2 files in Python?
Download the .grib2.gz from the noaa-mrms-pds bucket, decompress it, and open with xarray.open_dataset(path, engine="cfgrib"); the field appears as unknown.
Why is the MRMS variable called unknown?
MRMS uses a local GRIB2 parameter table that eccodes does not include, so cfgrib cannot name it. The product name in the file name tells you what it is.
What does -3 mean in MRMS data?
No radar coverage. Mask all negative values before computing statistics.
Which MRMS rainfall product should I use?
MultiSensor QPE Pass2 for gauge-corrected totals; RadarOnly when you need a radar-only estimate; and the accumulation window whose end time matches your question.