
Storm Track Crosses the Dateline: Lines Across the Whole Map
On this page
Problem statement
You turn a Pacific typhoon track into a LineString and plot it, and a straight line runs across the entire world map. Or you measure its length in a projected CRS and get 93,000 km for a storm that travelled 13,000. Or the bounding box of a small storm is the whole globe. All three are the same problem: a track that crosses the 180° meridian, the antimeridian, jumps from +179.9° to −179.9° between two points, and anything that treats coordinates as flat numbers draws or measures the long way round.
It is not rare. From 1980 to 2024, IBTrACS — the global best-track archive — holds 366 storms that crossed 180°, and the archive itself stores their longitudes in a way that defeats a naive normalisation. This page shows the symptoms with Hurricane Dora of 2023, which crossed the dateline from the eastern Pacific, and fixes each one.
Quick answer
Find the crossers, and never wrap their longitudes to −180…180 before you have dealt with the crossing:
span = tracks.groupby("SID").LON.agg(["min", "max"])
crossers = span[(span["min"] < 180) & (span["max"] > 180)]
print(f"IBTrACS since 1980: {tracks.SID.nunique():,} storms, longitudes {tracks.LON.min()} to {tracks.LON.max()}; "
      f"{len(crossers)} cross 180 deg")
dora = tracks[tracks.SID == "2023213N14257"]
print(f"Dora 2023: {len(dora)} points, longitude {dora.LON.iloc[0]} -> {dora.LON.min()} -> {dora.LON.iloc[-1]}")
print(f"geodesic length {GEOD.line_length(dora.LON.values, dora.LAT.values) / 1000:,.0f} km")
IBTrACS since 1980: 4,793 storms, longitudes -179.8 to 266.9; 366 cross 180 deg
Dora 2023: 175 points, longitude 257.4 -> 166.0 -> 181.2
geodesic length 12,994 km
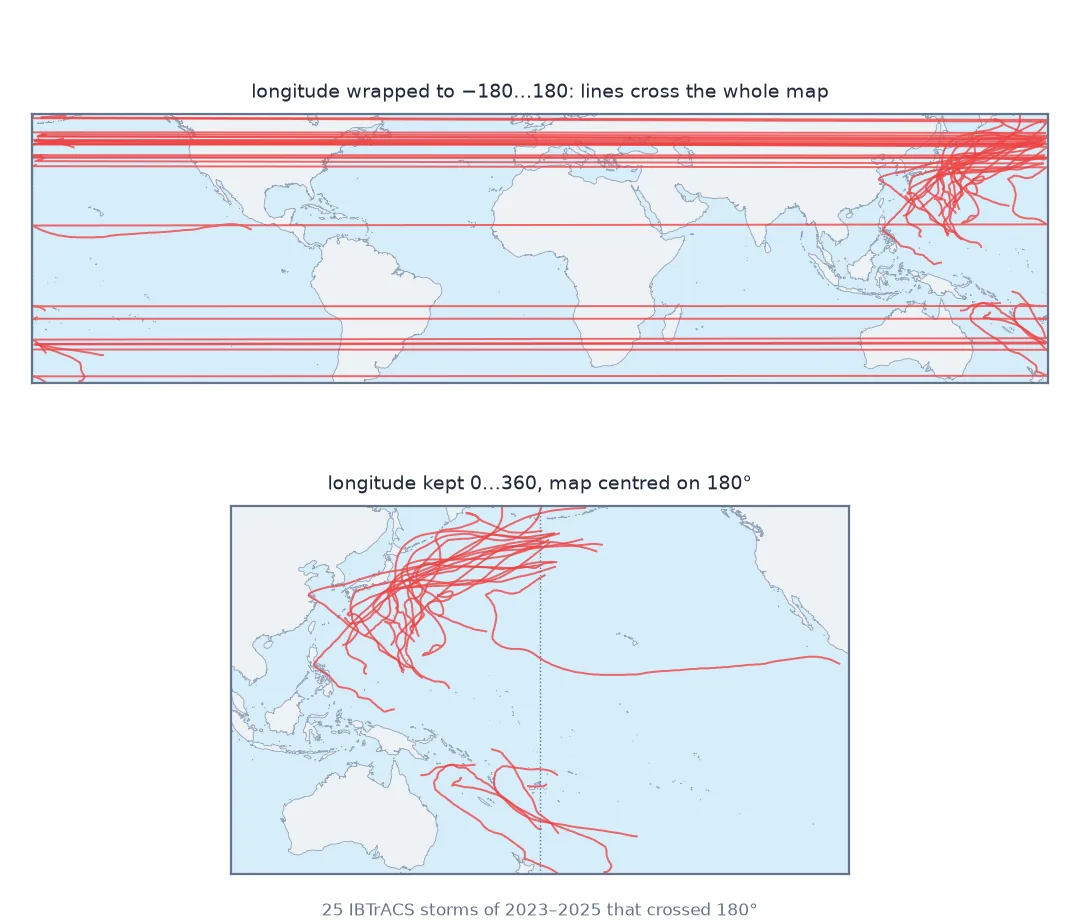
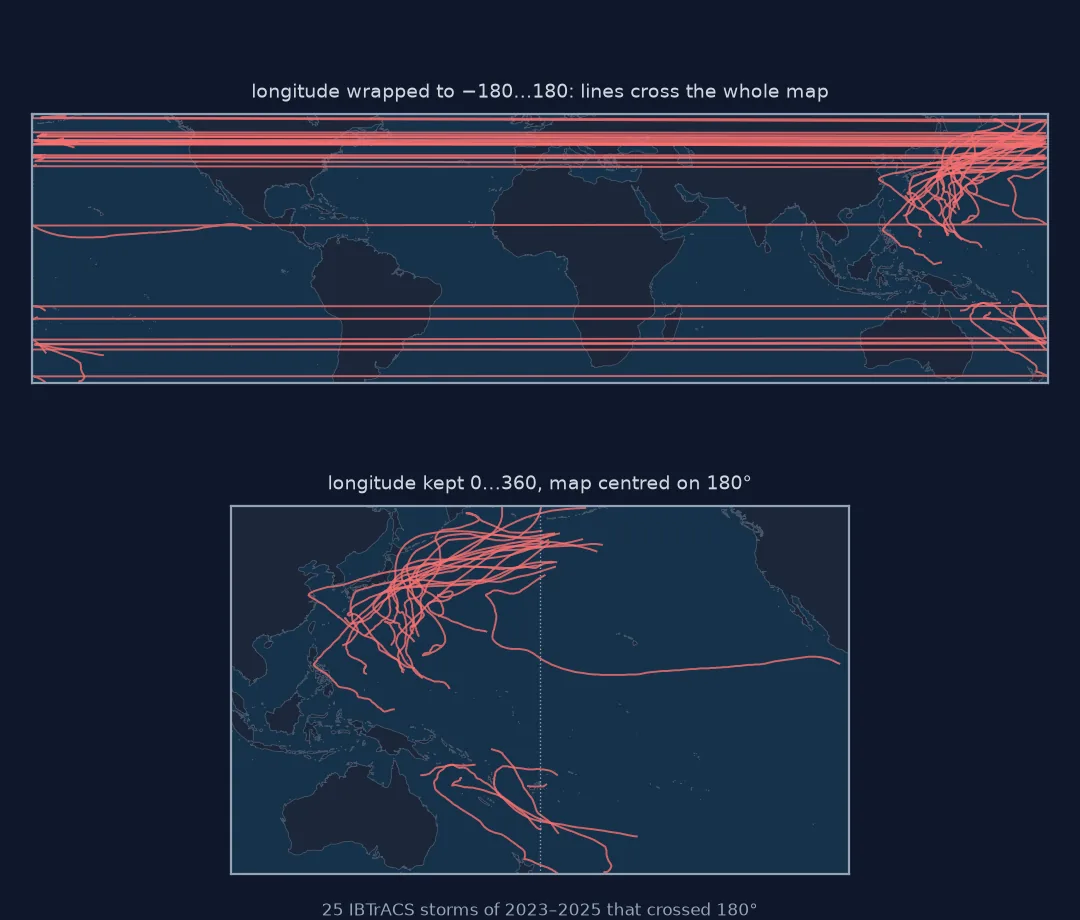
See the symptoms, IBTrACS longitudes, measure on the Earth
1. See the symptoms
Normalise Dora's longitudes to the usual −180…180 and build a LineString:
lon180 = ((dora.LON + 180) % 360) - 180
naive = gpd.GeoSeries([LineString(zip(lon180, dora.LAT))], crs=4326)
print("bounds:", naive.total_bounds.round(1))
print(f"length in EPSG:3857: {naive.to_crs(3857).length[0] / 1000:,.0f} km")
jumps = np.nonzero(np.abs(np.diff(lon180.values)) > 180)[0]
print("jumps between points:", [(round(float(lon180.values[j]), 1), round(float(lon180.values[j + 1]), 1)) for j in jumps])
bounds: [-179.9 11.4 179.6 37.1]
length in EPSG:3857: 93,666 km
jumps between points: [(-179.9, 179.6), (179.6, -179.7)]
Two jumps: Dora crossed westward in August 2023 and, as a remnant low, drifted back east across 180° at the end of her track. Each jump becomes a segment 359.5° long. The bounding box spans the globe and the projected length is seven times the real one.
2. Understand how IBTrACS stores longitude
IBTrACS keeps each storm's longitude continuous rather than wrapping it. A storm that starts in the western Pacific keeps counting past 180; Dora, starting in the eastern Pacific, is written in 0…360 from her first point, while eastern Pacific storms that never cross use negative longitudes:
first = tracks.groupby("SID").LON.first()
print(f"storms with any longitude > 180: {(span['max'] > 180).sum()}; with any < 0: {(span['min'] < 0).sum()}")
print("Dora's first point:", first["2023213N14257"], "| a non-crossing EP storm, Hilary 2023:",
      first[tracks[(tracks.NAME == "HILARY") & (tracks.SEASON == 2023)].SID.iloc[0]])
storms with any longitude > 180: 371; with any < 0: 1703
Dora's first point: 257.4 | a non-crossing EP storm, Hilary 2023: -100.8
So one file mixes two conventions, chosen per storm. Plot the raw values and Dora is fine; wrap them all to −180…180 to put every storm on one map, and every crosser breaks.
3. Measure along the Earth, not in a plane
A geodesic calculation takes the short way round between any two points, whatever their longitude convention, so it is the robust way to measure a track:
for label, lons in (("raw 0-360", dora.LON.values), ("wrapped -180..180", lon180.values)):
    print(f"{label:18s}: {GEOD.line_length(lons, dora.LAT.values) / 1000:,.0f} km")
cont = gpd.GeoSeries([LineString(zip(dora.LON, dora.LAT))], crs=4326)
print(f"raw 0-360 projected to EPSG:3857: {cont.to_crs(3857).length[0] / 1000:,.0f} km")
raw 0-360 : 12,994 km
wrapped -180..180 : 12,994 km
raw 0-360 projected to EPSG:3857: 93,666 km
Note the last line: keeping 0…360 does not save you once you project, because PROJ wraps longitudes to the projection's own range first.
4. Split at the antimeridian for GeoJSON and reprojection
RFC 7946, the GeoJSON standard, says a line crossing the antimeridian should be cut into a MultiLineString. Interpolate the crossing latitude and split:
def split_antimeridian(lons, lats):
    lons = ((np.asarray(lons) + 180) % 360) - 180
    parts = [[(lons[0], lats[0])]]
    for (x0, y0), (x1, y1) in zip(zip(lons[:-1], lats[:-1]), zip(lons[1:], lats[1:])):
        if abs(x1 - x0) > 180:
            edge = 180.0 if x0 > 0 else -180.0
            x1u = x1 + 360 if x0 > 0 else x1 - 360
            y = y0 + (y1 - y0) * (edge - x0) / (x1u - x0)
            parts[-1].append((edge, y))
            parts.append([(-edge, y)])
        parts[-1].append((x1, y1))
    return MultiLineString(parts)

fixed = gpd.GeoSeries([split_antimeridian(dora.LON.values, dora.LAT.values)], crs=4326)
print(f"{len(fixed[0].geoms)} parts; EPSG:3857 length {fixed.to_crs(3857).length[0] / 1000:,.0f} km; "
      f"geodesic {GEOD.geometry_length(fixed[0]) / 1000:,.0f} km")
3 parts; EPSG:3857 length 13,817 km; geodesic 12,994 km
The split track no longer has a 360° segment. Its Web Mercator length is still longer than the geodesic one — Mercator stretches distances by about 6% at 20° latitude — which is a projection effect, not the bug.
5. Map and measure in a Pacific-centred CRS
For maps and areas over the Pacific, use a projection whose central meridian is 180°, so the crossing is in the middle, not at the edge:
for crs in ("EPSG:3832", "+proj=eqearth +lon_0=180 +datum=WGS84"):
    print(f"{crs:40s}: {naive.to_crs(crs).length[0] / 1000:,.0f} km, from the wrapped line")
EPSG:3832 : 13,804 km, from the wrapped line
+proj=eqearth +lon_0=180 +datum=WGS84 : 11,958 km, from the wrapped line
Even the wrapped line now comes out close to its true length, because in these projections the jump from +179.9° to −179.9° is a short step across the centre of the map. The remaining differences, 6% long in Mercator and 8% short in Equal Earth, are each projection's scale at Dora's latitudes, not the bug. Draw maps here, but take distances from the geodesic.
Which basins the crossers come from
The data used on this page
IBTrACS v04r01, all storms of the 1980–2024 seasons, from NOAA NCEI; later seasons are left out because their tracks are still provisional.
from pathlib import Path

import geopandas as gpd
import numpy as np
import pandas as pd
import requests
from pyproj import Geod
from shapely.geometry import LineString, MultiLineString

Path("data").mkdir(exist_ok=True)
CSV = Path("data/ibtracs.since1980.list.v04r01.csv")
if not CSV.exists():
    CSV.write_bytes(requests.get("https://www.ncei.noaa.gov/data/international-best-track-archive-for-climate-stewardship-ibtracs/"
                                 "v04r01/access/csv/ibtracs.since1980.list.v04r01.csv", timeout=600).content)
tracks = pd.read_csv(CSV, skiprows=[1], low_memory=False, keep_default_na=False,
                     usecols=["SID", "SEASON", "NAME", "ISO_TIME", "LAT", "LON", "BASIN", "USA_WIND"])
tracks[["LAT", "LON"]] = tracks[["LAT", "LON"]].apply(pd.to_numeric, errors="coerce")
tracks["SEASON"] = tracks.SEASON.astype(int)
tracks = tracks[tracks.SEASON <= 2024]          # later seasons are provisional; NCEI rewrites the file weekly
GEOD = Geod(ellps="WGS84")
print(f"{len(tracks):,} track points, seasons {tracks.SEASON.min()}-{tracks.SEASON.max()}")
299,340 track points, seasons 1980-2024
Example 1: which basins the crossers come from
basins = tracks[tracks.SID.isin(crossers.index)].groupby("SID").BASIN.agg(lambda s: "+".join(dict.fromkeys(s)))
print(basins.value_counts().head(6).to_string())
BASIN
WP+EP 164
SP 148
EP+WP 54
Western Pacific storms recurving north-east into the central Pacific are the largest group, South Pacific cyclones the second; the 54 that went the other way, from the eastern Pacific into the western, include Dora.
Example 2: a bounding box that knows about the dateline
A box from −180 to 180 says nothing. RFC 7946 lets a bounding box run "west of east" — its west edge numerically greater than its east edge — when it crosses the antimeridian:
def bbox_dateline(lons, lats):
    lons360 = np.asarray(lons) % 360
    west, east = lons360.min(), lons360.max()
    wrap = lambda v: ((v + 180) % 360) - 180
    return [round(float(wrap(west)), 1), float(np.min(lats)), round(float(wrap(east)), 1), float(np.max(lats))]

print("naive  :", naive.total_bounds.round(1).tolist())
print("dateline-aware:", bbox_dateline(dora.LON, dora.LAT), "(west > east: it crosses 180)")
naive : [-179.9, 11.4, 179.6, 37.1]
dateline-aware: [166.0, 11.4, -102.6, 37.1] (west > east: it crosses 180)
Taking the minimum and maximum in 0…360 works for anything that spans less than half the globe on the Pacific side. For a general solution, find the largest gap in the sorted longitudes and put the box's edges on either side of it.
Longitude wraps; planar geometry does not
Longitude is an angle, and angles wrap: 179.9° east and 179.9° west are 0.2° apart, not 359.8°. Planar geometry — shapely, a LineString's bounding box, a projection's x coordinate — does not know that. Somewhere the circle has to be cut, and wherever the cut is, data crossing it breaks. The default cut at ±180° runs through the middle of the Pacific, where every typhoon and South Pacific cyclone that drifts east or west lives.
There are three defences. Measure with geodesic calculations, which work on the sphere and never see the cut. Split geometries at the cut before handing them to anything planar, which is what GeoJSON requires. Or move the cut somewhere harmless, with a projection centred on 180° or longitudes kept in 0…360, as IBTrACS does per storm. Which one fits depends on what comes next. A distance needs the first, a web map needs the second, and a Pacific map or area needs the third.
Longitudes past 180, hulls and web maps
- IBTrACS longitudes reach 266.9°, not just 180; code that assumes ≤ 180 fails silently.
- Buffers and convex hulls of a wrapped track span the globe; split first.
- Polygons crossing 180° (wind swaths, warning areas) need the same split and can turn inside out.
- Leaflet and MapLibre draw 0…360 coordinates on the next world copy, which is often what you want.
- Shapefile and GeoPackage store any numbers, but most readers assume −180…180.
- South Pacific cyclones are 148 of the 366 crossers; the cut runs straight through their basin.
Internal links
- How to plot a hurricane track from IBTrACS — the data source
- Coastline breaks at the antimeridian — the same problem for polygons
- H3 hexagons break at the antimeridian — and for grids
- Choose a projected CRS — central meridians
- How to measure distance accurately — geodesic vs planar
FAQ
Why does my storm track draw a line across the whole map?
The track crosses 180° and its longitudes jump from about +180 to −180, so the plotting library joins those points the long way round. Keep longitudes continuous, split the line, or centre the map on 180°.
How does IBTrACS store longitudes for dateline crossers?
Continuously per storm: values past 180 (up to 266.9° since 1980) or negative values, depending on where the storm started.
How do I measure a track that crosses the dateline?
Use a geodesic calculation such as pyproj.Geod.line_length, which measures on the ellipsoid regardless of the longitude convention.
How should GeoJSON represent a line crossing 180°?
As a MultiLineString split at the antimeridian, per RFC 7946 section 3.1.9.