
Rainfall Totals Come Out Wrong: Gaps, Extra Scans and Zeros That Mean Missing
On this page
Problem statement
You add up rainfall — radar scans into a day total, hourly gauge reports into a storm total — and the answer is off by a factor that no meteorology explains. Two and a half times too much from the radar. A gauge with nothing at all in the middle of a hurricane. A daily value ten times what the gauge could have held. The arithmetic is fine. The mistake is in what each record represents. Scans are not evenly spaced and some are repeats. A missing hour is not a dry hour. A zero is sometimes "not measured". And units differ between files of the same dataset.
Every example on this page comes from 8 July 2024, the day Hurricane Beryl crossed Houston: the KHGX radar's Level III scans, hourly reports from eight airport weather stations, and the daily record at Houston Intercontinental.
Quick answer
Weight each radar scan by the time until the next one, not by a fixed interval, and count what you actually have before trusting a gauge sum:
minutes = np.diff([*SCAN_TIMES, DAY_END]) / pd.Timedelta(minutes=1)
print(f"{len(SCAN_TIMES)} scans at 0.5 deg; spacing median {np.median(minutes):.2f} min, max {minutes.max():.1f} min")
print(f"area-mean total, time-weighted: {(MEAN_RATE * minutes / 60).sum():.1f} mm; "
      f"assuming 5 min per scan: {(MEAN_RATE * 5 / 60).sum():.1f} mm")
hours = asos.groupby("station").hour.nunique()
print("hours reported per station:", hours.to_dict())
745 scans at 0.5 deg; spacing median 1.65 min, max 4.6 min
area-mean total, time-weighted: 117.4 mm; assuming 5 min per scan: 302.9 mm
hours reported per station: {'CXO': 24, 'DWH': 16, 'EFD': 22, 'GLS': 24, 'HOU': 24, 'IAH': 24, 'LBX': 24, 'SGR': 17}
Weight radar by time, treat missing hours as missing, question zeros
1. Radar: weight by time, not by count
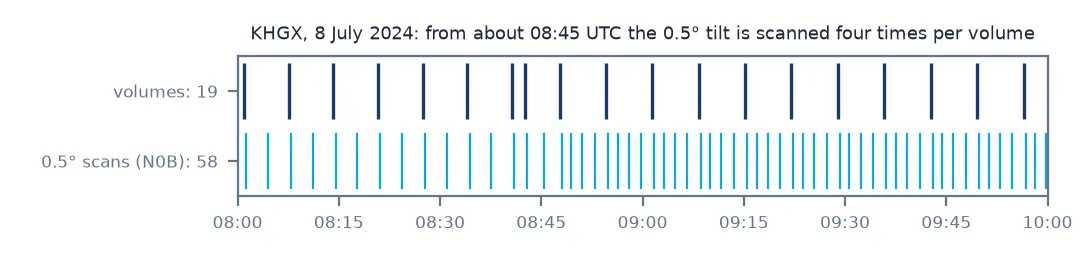
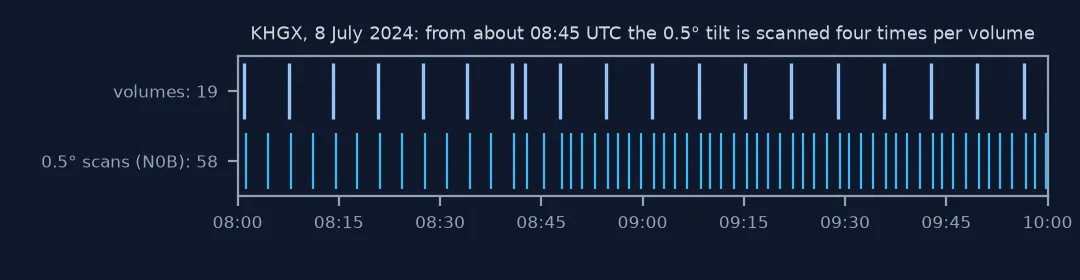
A WSR-88D volume normally takes 4–10 minutes, and many people accumulate by assuming each file is "one 5-minute scan". But in heavy weather the radar uses SAILS — Supplemental Adaptive Intra-Volume Low-Level Scans — and revisits the lowest tilt in the middle of the volume. Each revisit is published as its own Level III file:
vols = pd.Series(VOLUME_STARTS)
per_volume = pd.cut(pd.Series(SCAN_TIMES), bins=[*vols, DAY_END], right=False).value_counts().sort_index()
print(f"{len(VOLUME_STARTS)} volumes, {len(SCAN_TIMES)} 0.5-deg scans; scans per volume: "
      f"{per_volume.value_counts().sort_index().to_dict()}")
vol_minutes = np.diff([*VOLUME_STARTS, DAY_END]) / pd.Timedelta(minutes=1)
print(f"volume spacing: median {np.median(vol_minutes):.1f} min, max {vol_minutes.max():.1f} min")
231 volumes, 745 0.5-deg scans; scans per volume: {1: 1, 2: 87, 3: 3, 4: 140}
volume spacing: median 6.6 min, max 8.1 min
Most volumes that day had four 0.5° scans (MESO-SAILS, with up to three extra low-level scans per volume) and most of the rest two, so "five minutes each" counts the same rain several times over — the quick answer's 2.6× is exactly that. The opposite mistake is just as easy: keep only the volume starts and give each five minutes, and the long gaps between volumes go uncounted. Weighting each scan by the interval to the next one handles both.
2. Gauges: a missing hour is not a dry hour
Hourly reports from automated airport stations (ASOS) carry the precipitation of the past hour. Count the hours each station actually reported before summing:
day = asos.groupby("station").agg(mm=("mm", "sum"), hours=("hour", "nunique"))
day["missing"] = asos.groupby("station").hour.apply(lambda h: sorted(set(range(24)) - set(h)))
day["mrms_mm"] = [float(mrms.sel(latitude=lat, longitude=lon % 360, method="nearest"))
                  for lat, lon in asos.groupby("station")[["lat", "lon"]].first().values]
print(day.round(1).to_string())
mm hours missing mrms_mm
station
CXO 130.0 24 [] 127.4
DWH 112.8 16 [16, 17, 18, 19, 20, 21, 22, 23] 119.2
EFD 0.0 22 [5, 14] 134.9
GLS 67.1 24 [] 118.2
HOU 136.1 24 [] 181.2
IAH 118.6 24 [] 126.2
LBX 120.9 24 [] 190.2
SGR 143.5 17 [13, 14, 16, 19, 21, 22, 23] 150.9
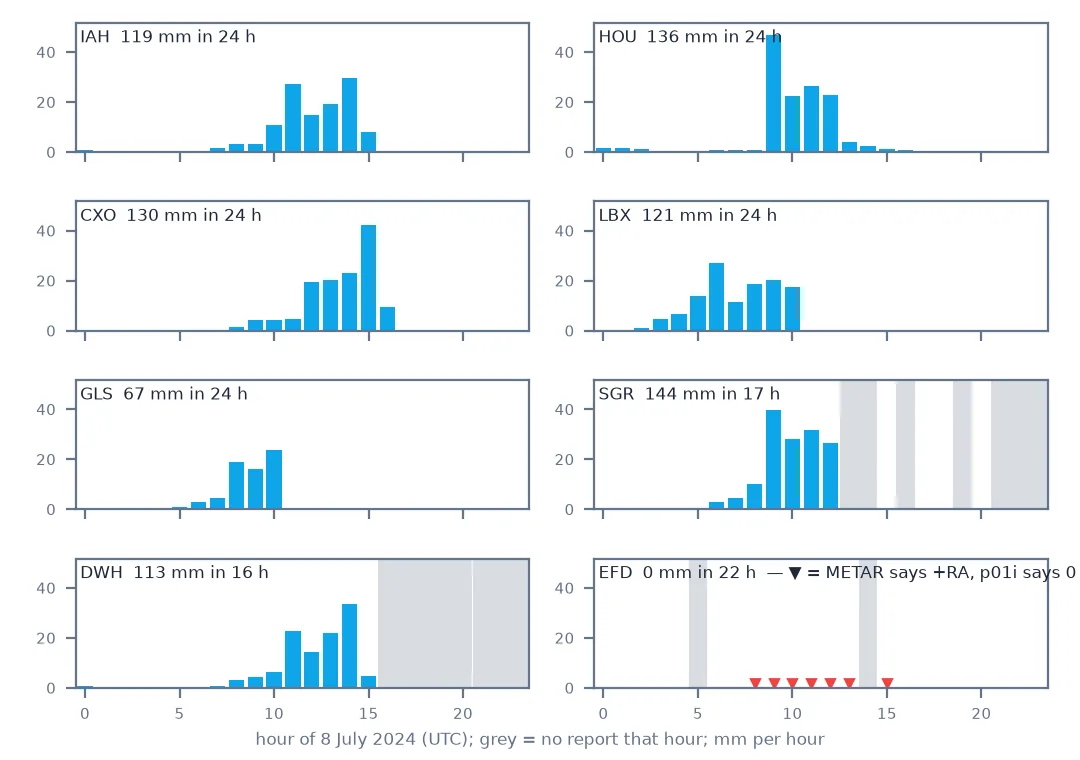
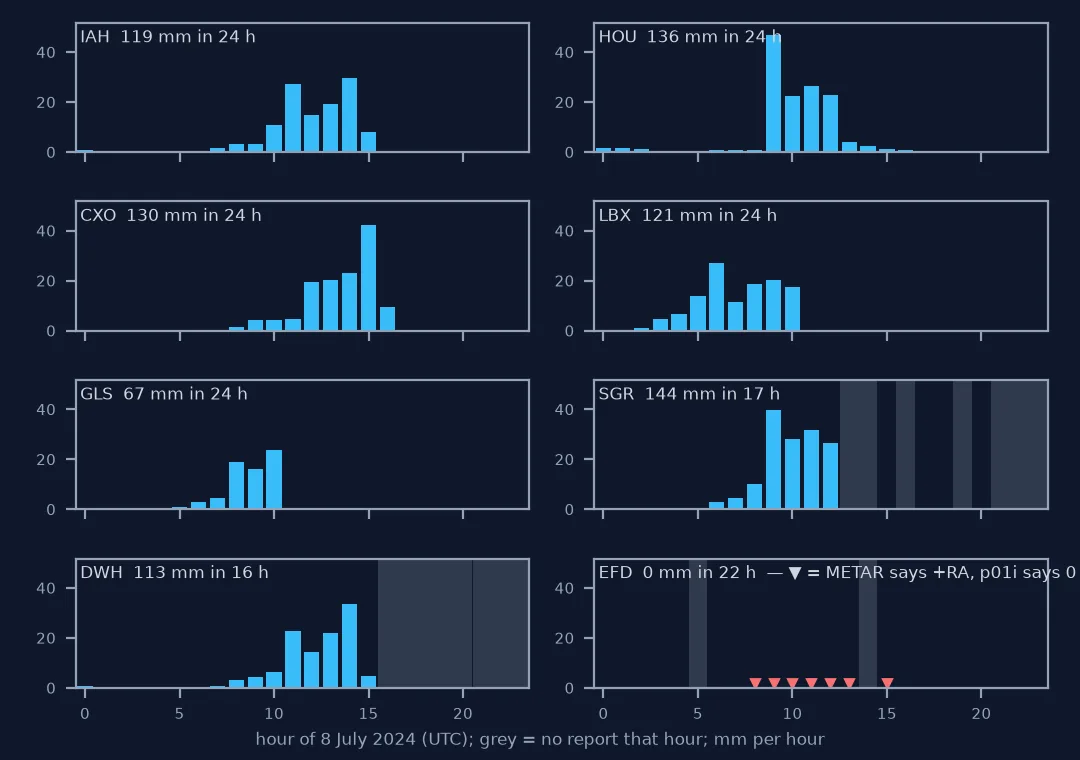
Sugar Land (SGR) and Hooks (DWH) stopped reporting for hours; the record does not say why. Their sums are lower bounds, not totals. At Hooks the gap came after the rain had largely passed; at Sugar Land it began while rain was still falling. A sum over the reported hours, with no count beside it, would read like a measurement.
3. Zero is not always zero
Ellington Field (EFD) reports 0.0 mm for every hour of the day Beryl crossed Houston. The raw reports explain why:
efd = asos[asos.station == "EFD"]
print(f"EFD hours with heavy rain (+RA) in the METAR: {efd.metar.str.contains(' [+]RA').sum()}; "
      f"with a precipitation group (Pnnnn): {efd.metar.str.contains(r' P\d{4}').sum()}; "
      f"with the AO2 automated-sensor remark: {efd.metar.str.contains(' AO2').sum()}")
print("IAH 10:53 UTC:", asos[(asos.station == "IAH") & (asos.hour == 10)].metar.iloc[0][-60:])
print("EFD 10:54 UTC:", efd[efd.hour == 10].metar.iloc[0])
EFD hours with heavy rain (+RA) in the METAR: 7; with a precipitation group (Pnnnn): 0; with the AO2 automated-sensor remark: 0
IAH 10:53 UTC: /24 A2962 RMK AO2 PK WND 05052/1023 SLP028 P0042 T02500239 $
EFD 10:54 UTC: KEFD 081054Z 09041G56KT 1SM +RA BR SQ OVC009 25/23 A2951
Ellington's reports say heavy rain and carry no precipitation group at all; the download turned "not reported" into 0.00. Whenever a gauge disagrees this badly with its neighbours, read the raw record before believing either the gauge or the radar.
4. Units differ between files of the same dataset
GHCN-Daily stores precipitation in tenths of a millimetre in its per-station CSV files; the NCEI data service returns millimetres when asked for metric units. The same day, two files:
raw = pd.read_csv("data/USW00012960.csv", usecols=["DATE", "PRCP"], parse_dates=["DATE"]).set_index("DATE").PRCP
api = pd.read_csv(io.StringIO(requests.get("https://www.ncei.noaa.gov/access/services/data/v1", timeout=120, params={
    "dataset": "daily-summaries", "stations": "USW00012960", "startDate": "2024-07-08", "endDate": "2024-07-08",
    "dataTypes": "PRCP", "format": "csv", "units": "metric"}).text))
print(f"IAH, 8 July 2024: per-station CSV PRCP = {raw['2024-07-08']}; API (metric) PRCP = {api.PRCP.iloc[0]}")
print(f"IAH hourly ASOS sum for the UTC day: {day.loc['IAH', 'mm']:.1f} mm")
IAH, 8 July 2024: per-station CSV PRCP = 1199; API (metric) PRCP = 119.9
IAH hourly ASOS sum for the UTC day: 118.6 mm
The per-station value needs dividing by ten. The ASOS sum is close but not equal: the GHCN day runs midnight to midnight local standard time (06–06 UTC), not 00–00 UTC.
Flagging incomplete gauge totals
The data used on this page
NOAA NEXRAD Level III N0B for KHGX, 8 July 2024, from the Unidata archive on AWS, with Level II volume start times from the same archive's listing; hourly ASOS reports from the Iowa Environmental Mesonet; MRMS MultiSensor QPE 24 h ending 00 UTC 9 July from the NOAA MRMS archive on AWS; GHCN-Daily USW00012960 from NOAA NCEI.
import gzip
import io
import re
import shutil
import warnings
from pathlib import Path

import numpy as np
import pandas as pd
import requests
import xarray as xr
from metpy.io import Level3File

warnings.filterwarnings("ignore")
Path("data/l3").mkdir(parents=True, exist_ok=True)
L3 = "https://unidata-nexrad-level3.s3.amazonaws.com/"
L2 = "https://unidata-nexrad-level2.s3.amazonaws.com/"


def s3_keys(base, prefix):
    out, token = [], None
    while True:
        params = {"list-type": 2, "prefix": prefix, **({"continuation-token": token} if token else {})}
        text = requests.get(base, params=params, timeout=60).text
        out += re.findall(r"<Key>([^<]+)</Key>", text)
        token = (re.findall(r"<NextContinuationToken>([^<]+)<", text) or [None])[0]
        if not token:
            return out


DAY_END = pd.Timestamp("2024-07-09")
VOLUME_STARTS = []
for key in s3_keys(L2, "2024/07/08/KHGX/"):
    if m := re.search(r"_(\d{2})(\d{2})(\d{2})_V06$", key):
        VOLUME_STARTS.append(pd.Timestamp(f"2024-07-08 {m[1]}:{m[2]}:{m[3]}"))
SCAN_TIMES, MEAN_RATE = [], []
for key in s3_keys(L3, "HGX_N0B_2024_07_08_"):
    path = Path("data/l3") / key
    if not path.exists():
        path.write_bytes(requests.get(L3 + key, timeout=60).content)
    try:
        f = Level3File(str(path))
        d = f.sym_block[0][0]
        z = np.array(f.map_data(d["data"]), float)[np.argsort(d["start_az"])]
    except Exception:
        continue
    if z.shape[0] != 720:
        continue
    z = np.nan_to_num(np.minimum(z, 53), nan=-30)[:, :600]              # within 150 km, capped at 53 dBZ
    SCAN_TIMES.append(pd.Timestamp(f.metadata["prod_time"]))
    MEAN_RATE.append(np.where(z > 5, (10 ** (z / 10) / 250) ** (1 / 1.2), 0).mean())  # tropical Z-R, mm/h
order = np.argsort(SCAN_TIMES)
SCAN_TIMES, MEAN_RATE = [SCAN_TIMES[i] for i in order], np.array(MEAN_RATE)[order]

asos = pd.read_csv(io.StringIO(requests.get("https://mesonet.agron.iastate.edu/cgi-bin/request/asos.py", timeout=120, params={
    "station": ["IAH", "HOU", "SGR", "LBX", "GLS", "EFD", "DWH", "CXO"], "data": ["metar", "p01i"],
    "year1": 2024, "month1": 7, "day1": 8, "year2": 2024, "month2": 7, "day2": 9, "tz": "Etc/UTC",
    "format": "onlycomma", "latlon": "yes", "missing": "M", "trace": "T", "direct": "no", "report_type": 3}).text))
asos["valid"] = pd.to_datetime(asos.valid)
asos = asos[asos.valid < DAY_END].copy()
asos["mm"] = pd.to_numeric(asos.p01i.replace("T", "0"), errors="coerce") * 25.4      # inches; trace -> 0
asos["hour"] = asos.valid.dt.hour

name = "MRMS_MultiSensor_QPE_24H_Pass2_00.00_20240709-000000.grib2"
if not Path("data", name).exists():
    Path("data", name + ".gz").write_bytes(requests.get("https://noaa-mrms-pds.s3.amazonaws.com/CONUS/"
                                                        f"MultiSensor_QPE_24H_Pass2_00.00/20240709/{name}.gz", timeout=300).content)
    with gzip.open(Path("data", name + ".gz")) as src, open(Path("data", name), "wb") as dst:
        shutil.copyfileobj(src, dst)
mrms = xr.open_dataset(Path("data", name), engine="cfgrib", decode_timedelta=True, backend_kwargs={"indexpath": ""})["unknown"]
if not Path("data/USW00012960.csv").exists():
    Path("data/USW00012960.csv").write_bytes(requests.get(
        "https://www.ncei.noaa.gov/data/global-historical-climatology-network-daily/access/USW00012960.csv", timeout=300).content)
print(f"{len(VOLUME_STARTS)} volumes, {len(SCAN_TIMES)} N0B scans, {asos.station.nunique()} ASOS stations, {len(asos)} reports")
231 volumes, 745 N0B scans, 8 ASOS stations, 175 reports
Example 1: flag incomplete gauge totals automatically
def gauge_total(g, hours_needed=24):
    have = g.hour.nunique()
    return pd.Series({"mm": g.mm.sum(), "hours": have,
                      "status": "complete" if have >= hours_needed and g.metar.str.contains(" AO2").any()
                      else ("not measured" if not g.metar.str.contains(r" P\d{4}").any() else "lower bound")})

print(asos.groupby("station")[["mm", "hour", "metar"]].apply(gauge_total).to_string())
mm hours status
station
CXO 130.048 24 complete
DWH 112.776 16 lower bound
EFD 0.000 22 not measured
GLS 67.056 24 complete
HOU 136.144 24 complete
IAH 118.618 24 complete
LBX 120.904 24 complete
SGR 143.510 17 lower bound
Example 2: how the error grows with the interval you assume
for assumed in (1, 2, 5, 10):
    print(f"assume {assumed:2d} min per scan: {(MEAN_RATE * assumed / 60).sum():6.1f} mm "
          f"({(MEAN_RATE * assumed / 60).sum() / (MEAN_RATE * minutes / 60).sum():.2f} x the time-weighted total)")
assume 1 min per scan: 60.6 mm (0.52 x the time-weighted total)
assume 2 min per scan: 121.2 mm (1.03 x the time-weighted total)
assume 5 min per scan: 302.9 mm (2.58 x the time-weighted total)
assume 10 min per scan: 605.8 mm (5.16 x the time-weighted total)
Two minutes happens to land within 3% here, but only by luck: no fixed interval is right for the whole day, because the scan strategy changed during it.
Every term carries an interval
An accumulation is a sum of rate × duration, or of amounts over intervals, and every term carries an assumption about the interval it covers. Radar files do not say "I represent five minutes". They have a timestamp, and the interval is the time until the next scan of the same tilt, which changes with the volume coverage pattern and with SAILS. Gauge records do not say "this hour was dry" when they are missing. They are simply absent, and a sum over what is present reads as complete.
The fix is the same in each case: make the interval and the completeness explicit before summing. Weight by time. Count the hours, and report the count beside the total. Treat a zero from a station whose reports carry no precipitation group as missing. Check the units of each file, not of the dataset. On a quiet day these errors are small and hide easily. On the day of a hurricane, when the totals matter most, stations drop out and scan strategies change at once.
Traces, ASOS resets and quality flags
- Trace (T) is less than 0.01 in; setting it to zero is standard but loses up to 0.25 mm per hour.
- Hourly ASOS values reset at :53–:54, not on the hour; align windows before comparing with radar hours.
- Specials (report type 4) carry partial-hour amounts; mixing them with routine reports double counts.
- GHCN quality flags can blank a value; a blank is missing, not zero.
- MRMS accumulations already handle scan timing; prefer them for totals unless you need the radar's own estimate.
- The last scan of the day needs an end time — midnight here — or its interval is lost.
Internal links
- How to estimate rainfall from radar — the accumulation done properly
- How to compare radar rainfall with gauges — matching windows
- How to read MRMS rainfall in Python — a ready-made accumulation
- Rainfall return periods explained — the IAH daily record
- Radar rainfall too high: hail and bright band — the other overestimates
FAQ
Why is my radar rainfall total two or three times too high?
You probably counted each Level III file as a fixed five-minute scan. With SAILS, the lowest tilt can be scanned up to four times per volume — 140 of KHGX's 231 volumes on 8 July had four — so the same rain is counted repeatedly. Weight each scan by the time to the next.
How do I handle missing hours in gauge data?
Count the hours present and report the sum as a lower bound when any are missing; do not treat missing hours as dry.
Why does an ASOS station show zero rain during a storm?
Its reports may carry no precipitation group at all — some stations have no automated gauge — and many downloads turn "not reported" into zero. Check the raw METAR for a Pnnnn group and the AO2 remark.
What units is GHCN-Daily precipitation in?
Tenths of a millimetre in the per-station CSV files; millimetres from the NCEI data service with units=metric.