
Weather Radar Reflectivity Explained: dBZ, Tilts and Beam Height
On this page
Problem statement
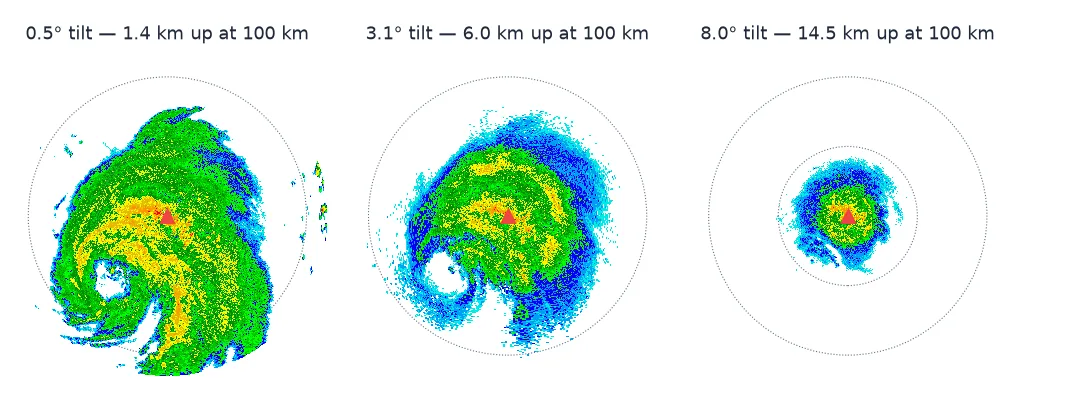
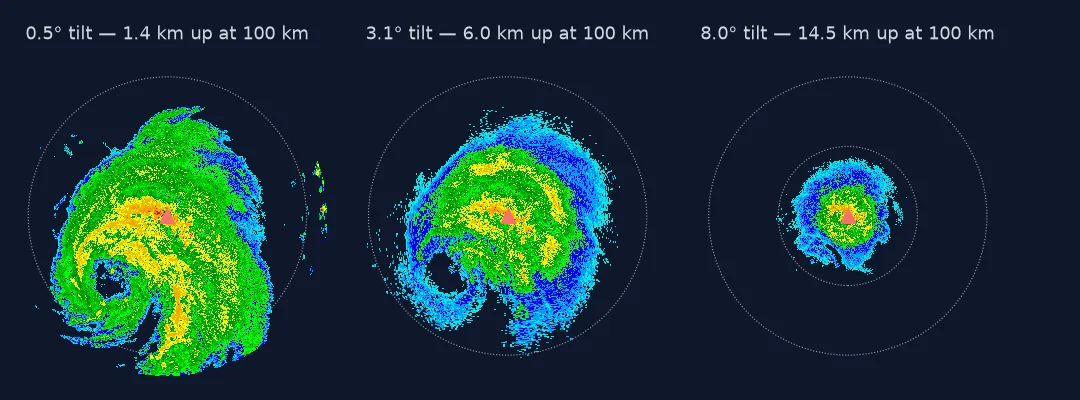
dBZ, the unit of the green-yellow-red map on every weather app, is ten times the logarithm of the radar reflectivity factor. It is logarithmic: every 10 dBZ is ten times more echo, so 40 dBZ is not a third more than 30 but ten times as much, about 11.5 mm of rain an hour against 2.7 by the usual Marshall-Palmer relation. And the map is not a horizontal slice of the atmosphere: each pixel sits at a height that grows with distance from the radar, the beam is kilometres wide where a storm is far away, and the radar scans at a stack of elevation angles, which is why the same storm looks different at each tilt.
This page uses one complete volume scan from the KHGX radar near Houston, taken 20 minutes after Hurricane Beryl made landfall on 8 July 2024, to show what reflectivity is, where in the sky each value was measured, and what the radar cannot see.
Quick answer
dBZ is ten times the logarithm of the reflectivity factor Z (mm⁶ m⁻³). Every 10 dBZ is a tenfold increase in Z, and through a Z–R relationship roughly a fourfold to fivefold increase in rain rate:
for dbz in (20, 30, 40, 50):
    Z = 10 ** (dbz / 10)
    R = (Z / 200) ** (1 / 1.6)                  # Marshall-Palmer
    print(f"{dbz} dBZ: Z = {Z:>9,.0f} mm6/m3, rain rate {R:5.1f} mm/h")
20 dBZ: Z = 100 mm6/m3, rain rate 0.6 mm/h
30 dBZ: Z = 1,000 mm6/m3, rain rate 2.7 mm/h
40 dBZ: Z = 10,000 mm6/m3, rain rate 11.5 mm/h
50 dBZ: Z = 100,000 mm6/m3, rain rate 48.6 mm/h
List the tilts, find the beam, read the distribution
1. Read the volume and list its tilts
A NEXRAD volume contains several sweeps: a full circle at each of a set of elevation angles, the volume coverage pattern. Some low tilts are scanned twice — once for reflectivity and polarimetric fields at long range, once for velocity — and the lowest is revisited during the volume:
tilts = {}
for name in sorted((c for c in dt.children if c.startswith("sweep")), key=lambda c: int(c.split("_")[1])):
    angle = round(float(dt[name].ds.sweep_fixed_angle), 2)
    tilts.setdefault(angle, name)
print(f"{sum(c.startswith('sweep') for c in dt.children)} sweeps, {len(tilts)} distinct tilts:", list(tilts))
23 sweeps, 14 distinct tilts: [0.48, 0.88, 1.32, 1.8, 2.42, 3.12, 4.0, 5.1, 6.42, 8.0, 10.02, 12.48, 15.6, 19.51]
2. Where is the beam?
The beam leaves the radar at a small angle and the Earth curves away beneath it; refraction bends it back down a little. The standard model treats the Earth as having four-thirds its real radius. The beam is also about 0.95° wide, so its footprint grows linearly with range:
def beam_height(r_km, elev_deg, ke=4 / 3, a=6371.0):
    return np.sqrt(r_km**2 + (ke * a) ** 2 + 2 * r_km * ke * a * np.sin(np.radians(elev_deg))) - ke * a

for r in (50, 124, 200):
    print(f"{r:3d} km: 0.48 deg beam centre {beam_height(r, 0.48):.2f} km up, "
          f"{2 * r * np.tan(np.radians(0.95 / 2)):.2f} km wide")
50 km: 0.48 deg beam centre 0.57 km up, 0.83 km wide
124 km: 0.48 deg beam centre 1.94 km up, 2.06 km wide
200 km: 0.48 deg beam centre 4.03 km up, 3.32 km wide
At 124 km — the distance of Beryl's eye from KHGX at landfall — the lowest beam is centred about 2 km above the ground and 2 km deep. Whatever rain happens below that, the radar measures only what falls through the beam.
3. Read the distribution, not just the colours
sw = dt["sweep_0"].ds
z = sw.DBZH.values
echo = z > 5
for lo, hi in ((5, 20), (20, 30), (30, 40), (40, 50), (50, 80)):
    print(f"{lo:2d}-{hi:2d} dBZ: {((z >= lo) & (z < hi)).sum() / echo.sum():5.1%} of echo")
print(f"maximum {np.nanmax(z):.0f} dBZ")
5-20 dBZ: 13.6% of echo
20-30 dBZ: 30.9% of echo
30-40 dBZ: 41.7% of echo
40-50 dBZ: 13.1% of echo
50-80 dBZ: 0.7% of echo
maximum 66 dBZ
Most of a hurricane's rain shield sits between 20 and 40 dBZ — moderate rain by any Z–R relationship. Values above 50 dBZ cover less than 1% of the echo; at 66 dBZ the maximum is beyond what rain alone produces, which points at clutter or hail, not a 200 mm/h downpour.
4. Look at the storm in the vertical
Taking the same azimuth from every tilt and drawing each gate at its true height and depth gives a pseudo-RHI — a vertical cross-section:
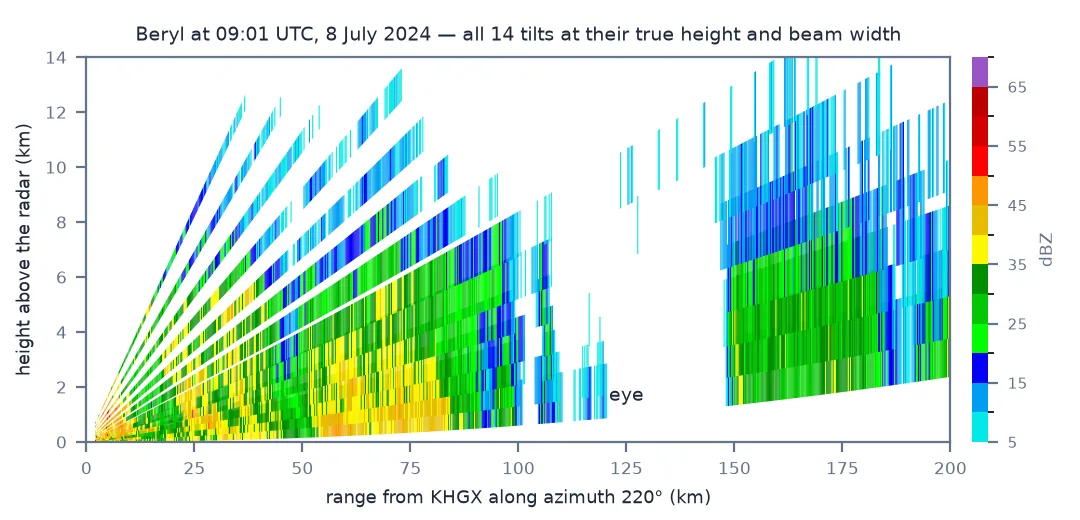
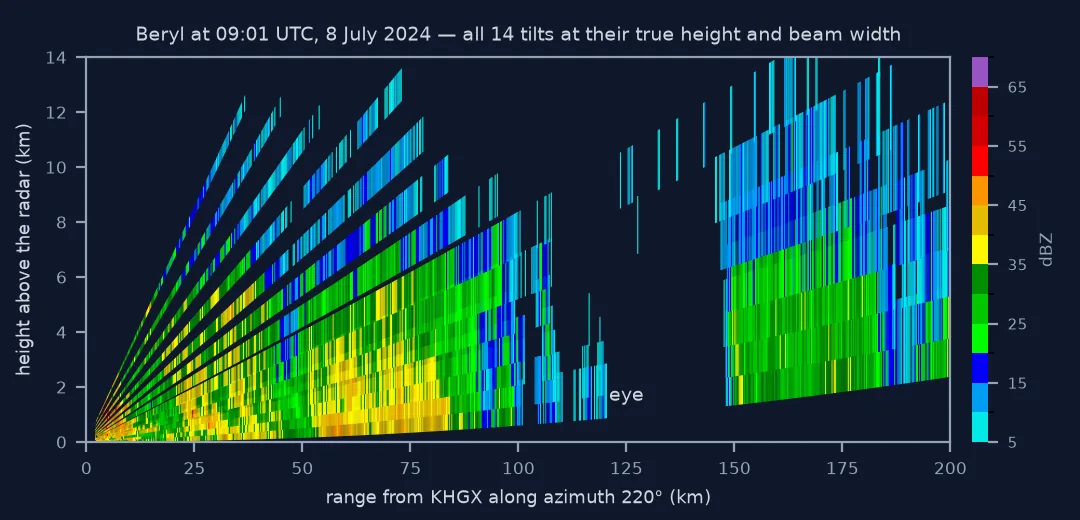
The cross-section through Beryl's eye shows what a plan view hides: the gaps between the tilts, which widen with range; the cone of silence above the radar, where no tilt looks; the eye, empty from about 110 to 145 km at every tilt; and the echo tops. Find the highest tilt with at least 18 dBZ at each range:
tops = {}
for r in range(20, 201, 20):
    top = None
    for angle, name in tilts.items():
        ds = dt[name].ds
        i = np.argmin(np.abs(ds.azimuth.values - 220))
        j = np.argmin(np.abs(ds.range.values / 1000 - r))
        if abs(ds.range.values[j] / 1000 - r) < 1 and ds.DBZH.values[i, j] >= 18:
            top = max(top or 0, beam_height(r, angle))
    tops[r] = None if top is None else round(float(top), 1)
print("18 dBZ echo top (km) along azimuth 220:", tops)
18 dBZ echo top (km) along azimuth 220: {20: 5.4, 40: 5.7, 60: 5.5, 80: 6.0, 100: 3.7, 120: None, 140: None, 160: 6.5, 180: 6.1, 200: 5.4}
Echo tops of 5–7 km are typical of tropical rain, which is shallow but extremely efficient. Continental thunderstorms push 18 dBZ to 12–15 km. Beyond 150 km the lowest tilt is already above 2.5 km, so the echo top measured there is a lower bound on what the radar could have seen.
How far each tilt can see the storm
The data used on this page
NOAA NEXRAD Level II, KHGX (Houston/Galveston), volume 2024-07-08 09:01:25 UTC, from the Unidata NEXRAD Level II archive on AWS.
from pathlib import Path

import numpy as np
import requests
import xradar as xd

Path("data").mkdir(exist_ok=True)
KEY = "2024/07/08/KHGX/KHGX20240708_090125_V06"
path = Path("data") / KEY.split("/")[-1]
if not path.exists():
    path.write_bytes(requests.get("https://unidata-nexrad-level2.s3.amazonaws.com/" + KEY, timeout=300).content)
dt = xd.io.open_nexradlevel2_datatree(str(path))
print(path.name, f"{path.stat().st_size / 1e6:.1f} MB")
KHGX20240708_090125_V06 19.4 MB
Example 1: how far each tilt can see the storm
Each tilt is recorded to a maximum range, and the higher ones are shorter because their beams leave the troposphere:
for angle, name in tilts.items():
    ds = dt[name].ds
    r_max = float(ds.range.values[-1]) / 1000
    print(f"{angle:5.2f} deg: recorded to {r_max:3.0f} km, where the beam is {beam_height(r_max, angle):4.1f} km up")
0.48 deg: recorded to 460 km, where the beam is 16.3 km up
0.88 deg: recorded to 460 km, where the beam is 19.5 km up
1.32 deg: recorded to 430 km, where the beam is 20.8 km up
1.80 deg: recorded to 387 km, where the beam is 20.9 km up
2.42 deg: recorded to 336 km, where the beam is 20.8 km up
3.12 deg: recorded to 296 km, where the beam is 21.2 km up
4.00 deg: recorded to 252 km, where the beam is 21.3 km up
5.10 deg: recorded to 210 km, where the beam is 21.2 km up
6.42 deg: recorded to 174 km, where the beam is 21.2 km up
8.00 deg: recorded to 137 km, where the beam is 20.1 km up
10.02 deg: recorded to 117 km, where the beam is 21.1 km up
12.48 deg: recorded to 96 km, where the beam is 21.2 km up
15.60 deg: recorded to 78 km, where the beam is 21.3 km up
19.51 deg: recorded to 63 km, where the beam is 21.2 km up
Every tilt stops where its beam is about 21 km up, well above the tropopause: there is no weather beyond that point, so the radar stops listening. The 19.5° tilt sees only to 63 km.
Example 2: reflectivity at the same place, three tilts
ds_hi = dt[tilts[3.12]].ds
i0, i1 = np.argmin(np.abs(sw.azimuth.values - 220)), np.argmin(np.abs(ds_hi.azimuth.values - 220))
for r in (40, 80, 160):
    j0, j1 = np.argmin(np.abs(sw.range.values - r * 1000)), np.argmin(np.abs(ds_hi.range.values - r * 1000))
    print(f"{r:3d} km at 220 deg: {sw.DBZH.values[i0, j0]:5.1f} dBZ at {beam_height(r, 0.48):.1f} km, "
          f"{ds_hi.DBZH.values[i1, j1]:5.1f} dBZ at {beam_height(r, 3.12):.1f} km")
40 km at 220 deg: 38.0 dBZ at 0.4 km, 33.5 dBZ at 2.3 km
80 km at 220 deg: 43.5 dBZ at 1.0 km, 32.0 dBZ at 4.7 km
160 km at 220 deg: 32.5 dBZ at 2.8 km, 15.0 dBZ at 10.2 km
The higher tilt measures a different part of the cloud. At 160 km the 3.1° beam is 10 km up, far above the melting level, and reads 15 dBZ where the lowest tilt reads 32.5 dBZ. This is why rainfall products use the lowest unblocked tilt.
The radar equation in brief
A radar sends out a short pulse and listens. Anything in the beam — raindrops, hail, snowflakes, insects, buildings — scatters some energy back. The radar equation converts the returned power and the range into the reflectivity factor Z, which for small raindrops is the sum of the sixth power of their diameters per cubic metre. That sixth power is why a few large drops dominate: one 4 mm drop scatters as much as 4,096 drops of 1 mm.
Because Z spans many orders of magnitude, it is reported as dBZ = 10 log₁₀ Z. A plan-position display then paints each gate of one tilt on a map, as if it were at ground level. It is not: the 0.5° tilt is 1.4 km up at 100 km and 4 km up at 200 km, and each gate is a volume kilometres deep. Reading a reflectivity map well means remembering three things: it is logarithmic, it is tilted, and it is blurred with range.
Range folding, the bright band and attenuation
- Range folding and clutter produce echo that is not weather; dual-pol fields help separate them.
- The bright band, where snow melts into rain, inflates reflectivity in a layer.
- Hail gives very high dBZ that no Z–R relationship should turn into rain.
- Attenuation is minor at S band (NEXRAD) and serious at C and X band.
- Different radars use different colour maps; compare numbers, not colours.
- Anomalous propagation bends beams into the ground on clear, stable nights.
Internal links
- How to read NEXRAD Level II — the file format
- Dual-polarisation radar explained — the other fields
- How to grid a radar sweep — from polar gates to a map
- How to estimate rainfall from radar — dBZ to millimetres
- Radar beam blockage and clutter — when the beam hits something
FAQ
What does dBZ mean?
Decibels of Z, the radar reflectivity factor: dBZ = 10 log₁₀(Z), with Z in mm⁶ per cubic metre. Each 10 dBZ is ten times more reflectivity.
What dBZ is heavy rain?
Around 40–50 dBZ is heavy rain (roughly 10–50 mm/h by Marshall–Palmer). Above about 55 dBZ, hail is likely.
Why does a radar image change between tilts?
Each tilt samples a different height. At 100 km the 0.5° tilt is 1.4 km up and the 3.1° tilt is 6 km up — often above the melting level.
Why can the radar not see the ground far away?
The Earth curves away beneath the beam. At 200 km the lowest beam is centred 4 km above the radar's height.